 |
| About Bioline | All Journals | Testimonials | Membership | News |
|
||||||
|
||||||
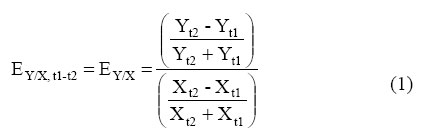
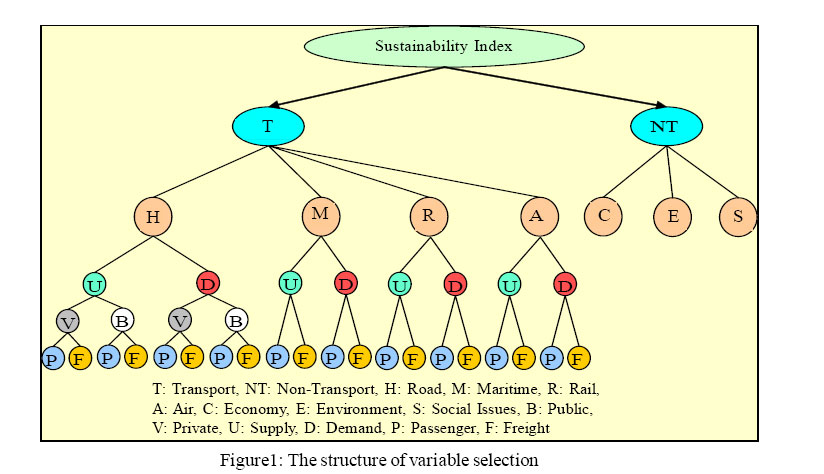
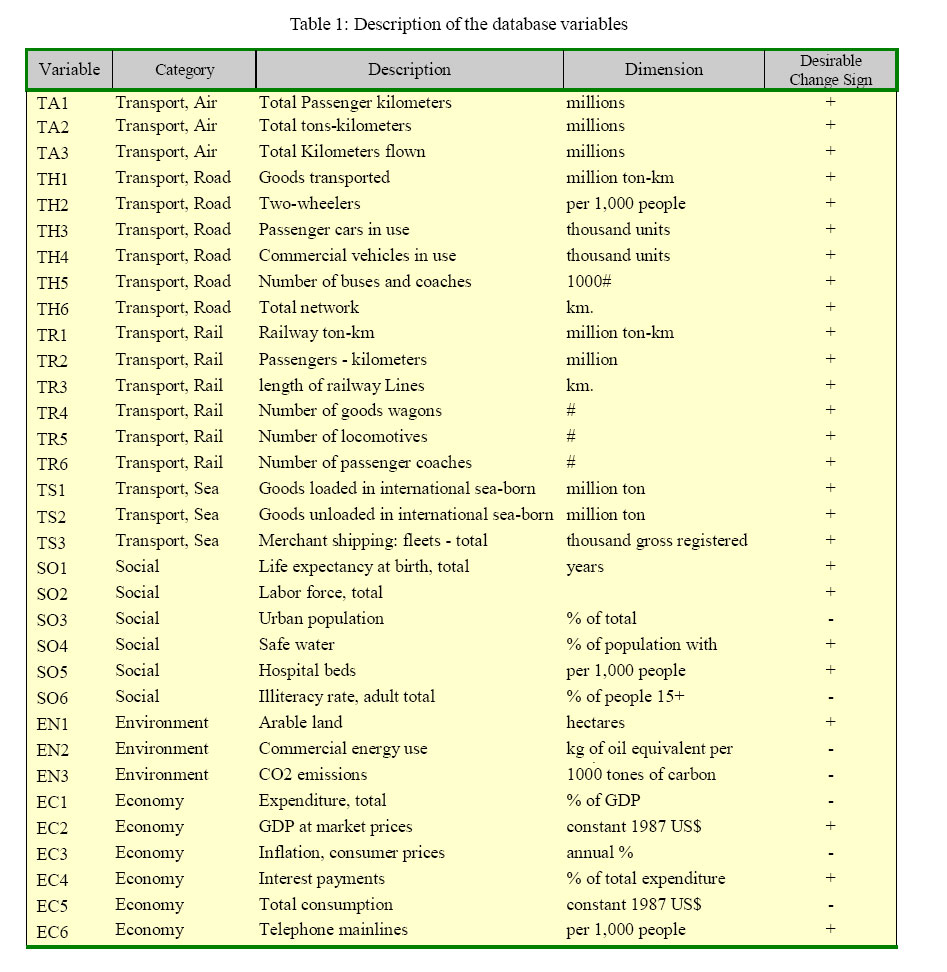
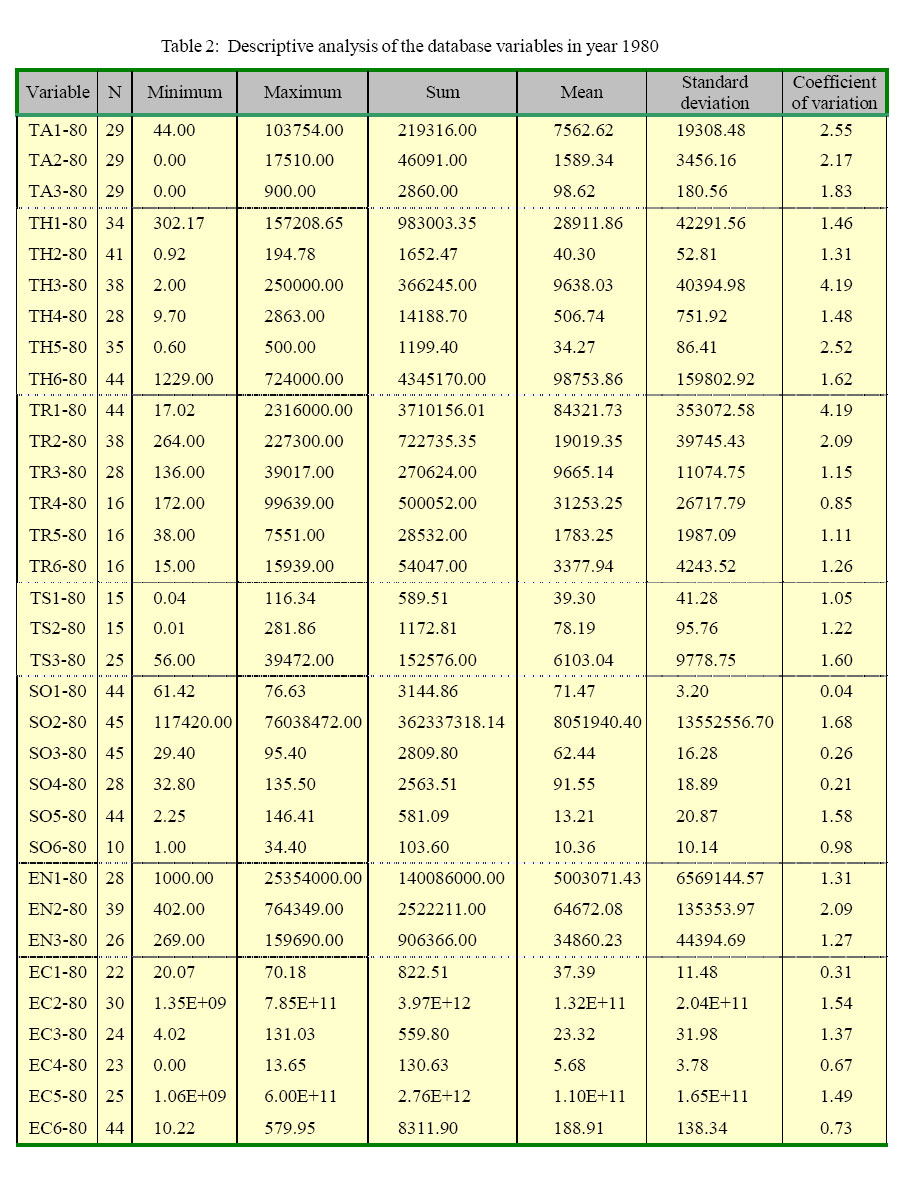
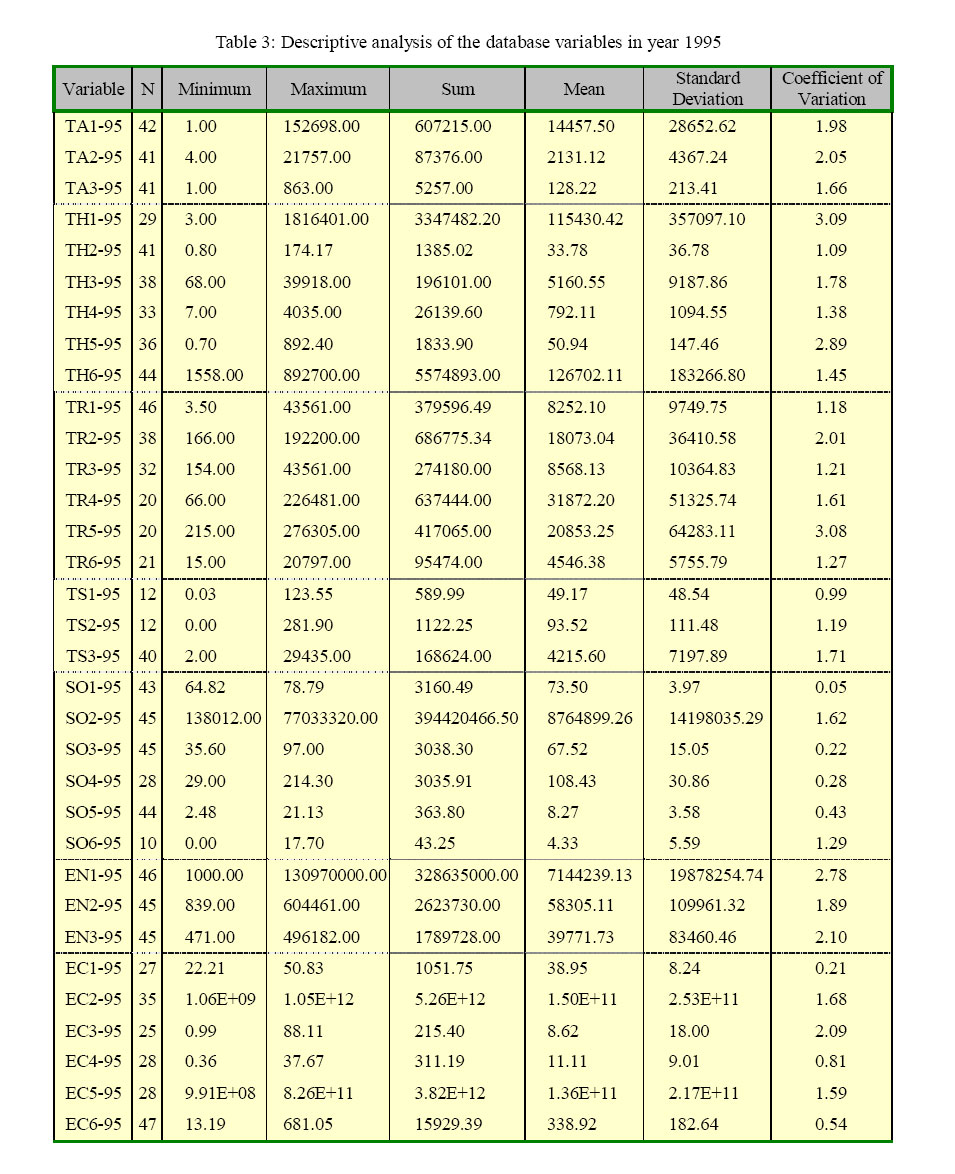
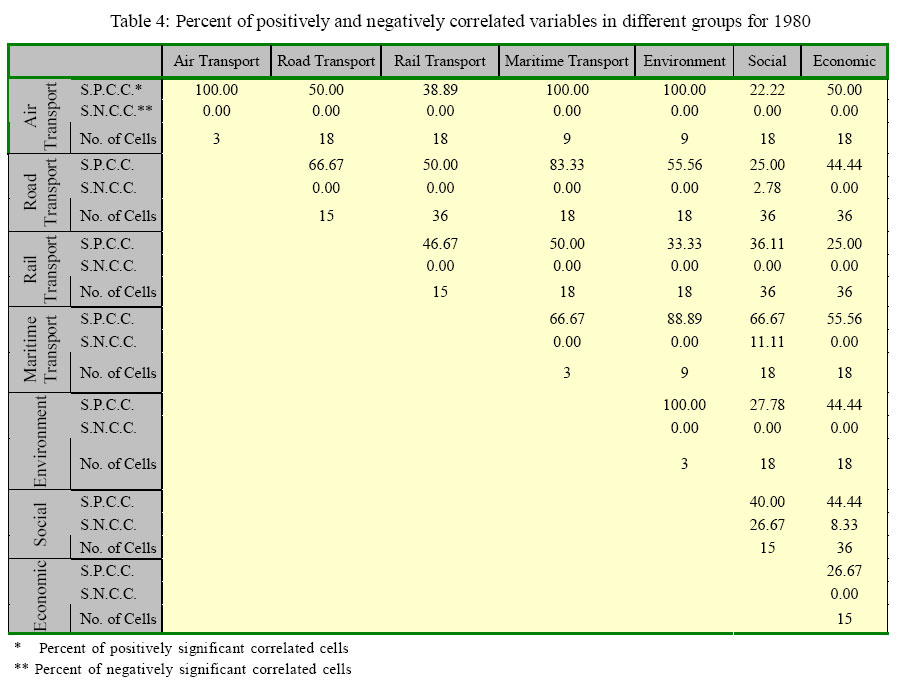
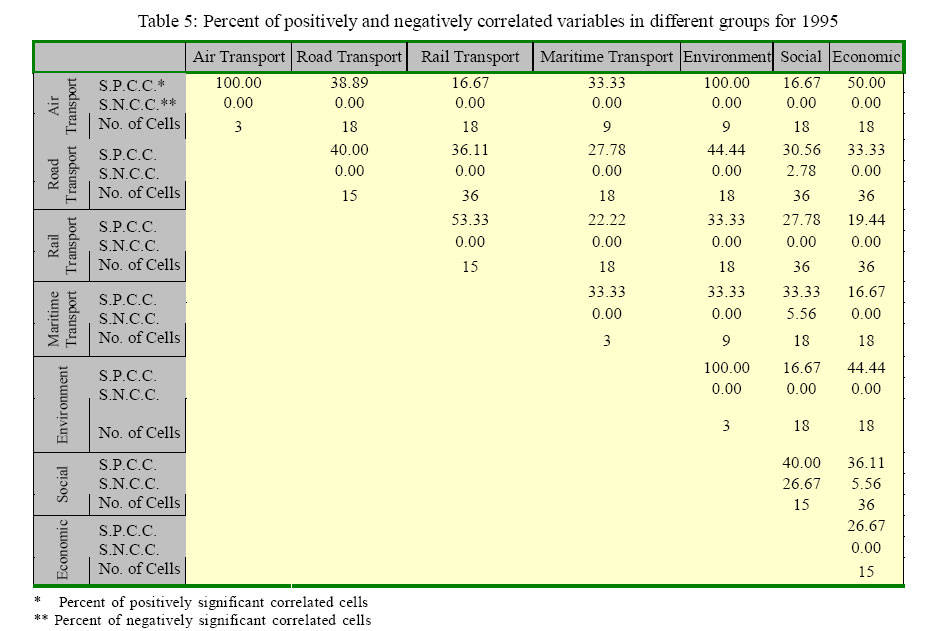
International Journal of Enviornmental Science and Technology, Vol. 2, No. 1, Spring, 2005, pp. 83-96 Sustainable transport indicators: Definition and integration 1 *A. A. Rassafi and 2 M. Vaziri 1Department of Engineering, Imam Khomeini International University, Ghazvin, Iran Code Number: st05011 Abstract In this paper, a different interpretation of sustainable transportation, is introduced, in which sustainability with respect to transportation sector for the selected countries is evaluated. This interpretation characterizes “sustainable development” through “harmonic development”. It means sustainable development with special focus on transportation can be measured by the degree of conformity between environment, economy, and social aspects on one hand, and transportation on the other hand. The best indicator to perform such a measurement is elasticity. The database used for the study encompasses a series of national indicators for each country Seventy nine countries were initially selected for detailed analysis for the period of 1980 - 1995. The data have been extracted from centralized information sources of international agencies. The key dimensions of sustainable development i.e. social, environmental, and economic characteristics are used. Firstly, a set of sustainable transportation indicators is introduced. These indicators, which in fact are elasticities, show the relative change of non-transportation variables with respect to transportation ones. Second composite indices of three non-transportation groups with respect to four transportation modes are calculated. The composite indices are then aggregated by the Concordance Analysis Technique to achieve comprehensive transportation sustainability indices of countries, and according to these values, the countries are compared, ranked, and classified. Mathematical and statistical analyses of the database support the study quantitatively. The results for the selected indicators and countries show that from sustainable transportation point of view and based on the above-mentioned interpretation of sustainable development, United States is in the ranked first, and Sierra Leon is last among the subset of 79 countries with non-missing data. The results of the study depict an overall scheme for comparative assessment of transportation sustainability of the countries. Key words: Sustainable transportation, elasticity, concordance analysis, comparative study, measurement Introduction Although there has been a massive literature on sustainable development since the past decades (WCED, 1987; UN, 1992 and Pezzey, 1992) there is some ambiguity over what exactly the term means (CSAEG, 2003), (Gudmundsson and Hojer, 1996). The common idea behind the concept is the concerns about the relationships among economic activities, social aspects, and environmental considerations (Barter, 1999). Economy is the vital part of the development and the growth of economies and their structural transformation have always been recognized as being at the core of development. On the other hand, environment is the most important part of a sustainability study. The naturalenvironmental constraint to development is the main reason for any concern about sustainability. Development has also huge, undesirable social impacts. It encompasses the strengthening of the material income base as well as the enhancement of capabilities and the enlargement of choices. The other argument regarding social issues is equity considerations. Inter-generational or inter-temporal equity forms one of the cornerstones of the concept and the issue of intra-generational equity cannot be excluded from a comprehensive notion of sustainable development. On the other hand, transportation provides assistance to economic growth by making accessibility to resources and markets. It also improves quality of life linking persons to employment, health, education, recreation and other amenities. Thus, transportation plays a key role in economic and social development. Nevertheless, it has many spill-over effects such as congestion, safety, pollution and non-renewable resource depletion. The concept of sustainable transportation can be derived from the general sustainable development term that embraces all sectors of human activity (WCED, 1987). Efficacious and sustainable transportation is a key component to well functioning and civilized societies. Indeed, both developed and developing countries are confronting critical issues in selecting and planning for their future transportation systems when there is a need towards sustainable development that balances accessibility, mobility, protection of human safety and environment, as well as economic growth and social equity. The concept of sustainable transportation is derived from these general terms that imply movement of people and goods in ways that are environmentally, socially and economically sustainable (OECD, 1996 and Vaziri and Rassafi, 2001). This paper proposes an indicator for measuring, and presents an appraisal of sustainable transportation of the selected world countries. The objective of the study is to address the concept of sustainability in transportation and to formulate a proper definition. The study objective sheds some light on balancing and sustainability aspects of transportation for different countries around the globe. The methodology can be applied to any other time and geographic scope for further elaboration of the involved issues by conducting similar comparative analyses.The paper is organized as follows: firstly, the preliminary statistical analysis of the data is presented. Limited data were available and were extracted from centralized sources of international agencies such as United Nations, International Road Transport Union, and World Bank. Due to incomplete data and missing values, only 79 countries were selected for detailed analysis. The study time-series database consisted of 33 variables, covering 15 years during the period from 1980 to 1995. The database univariate and multivariate statistical analyses showed interesting results and patterns. Secondly, indicators of sustainable transportation using the concept of elasticity are presented. The elasticities of environmental, social and economic variables with respect to different modes of transportation variables are used as transportation sustainability indicators. Thirdly, these indicators are aggregated to more composite indices. The composite indices computed in this stage reflect the average elasticity of three main groups with respect to four modes of transportation, i.e. road, air, rail, and maritime transportation. Finally, using a multi-criteria analysis technique, the composite indices are integrated using different weighting schemes. The last chapter concludes the discussions. Materials and Methods Database preliminary analysis The process of data refinement and screening included several stages of univariate and multivariate statistical analyses. In the last stage, the set of selected variables was filtered by a criterion. Figure 1 shows the structure based on which the variables have been selected. According to this figure for having a comprehensive and reasonable-size set of variables, they should belong to the identified categories. It is worth mentioning that the data availability is an implicit criterion for choosing variables among the others. The limited study resources confined the data collection to information gathering from the international databanks (International Road Transport Union, 1996; UN, 2000 and World Bank, 2002). The final study database consisted of 33 national aggregate variables for 79 countries for the period of 1980 to 1995. The criterion for selecting countries was having the least amount of missing data. The study database variables are described in Table 1. The last column in the table shows the desirable change direction of each variable with respect to increase of transportation ones. The selected countries include Algeria, Benin, Cameroon, Congo, Cote d’Ivoire, Egypt, Gabon, Ghana, Kenya, Madagascar, Mauritania, Morocco, Nigeria, Senegal, Sierra Leon, South Africa, Tanzania, Togo, and Tunisia, from Africa, Argentina, Brazil, Canada, Chile, Colombia, Costa Rica, Dominic1, Ecuador, El Salvador, Guatemala, Jamaica, Mexico, Nicaragua, Panama, Paraguay, Peru, Suriname, United States, Uruguay, and Venezuela, fromAmerica, Bahrain, Bangladesh, India, Indonesia, Iran, Japan, Jordan, South Korea, Lebanon, Malaysia, Maldives, Pakistan, Philippine, Saudi Arabia, Sri Lanka, Syria, and Thailand, from Asia, Austria, Belgium, Bulgaria, Denmark, Finland, France, Greece, Hungary, Iceland, Ireland, Italy, Malta, Netherlands, Norway, Poland, Portugal, Spain, Sweden, Switzerland, Turkey, United Kingdom, and finally Australia and New Zealand from Oceania. The unvaried statistical analysis of the database sheds light on the database cross-sectional and timeseries variability. The analysis covered computation of statistics such as minimum, maximum, mean, standard deviation and coefficient of variation, as summarized in Tables 2 and 3 for 1980 and 1995, respectively. In both tables all variables other than social and a part of economic variables have high variability. The study database univariate analysis showed significant cross-sectional and time-series variability, as was reflected by the coefficients of variation. As a first step to develop an understanding of the interrelationship among the database variables, pair-wise correlation analysis for 1980 and 1995 was performed. The size of the 33×33 correlation matrices prevented their display herein. The matrix revealed a number of interesting patterns. Many pairs of variables were found correlated at a level of significance 0.05. Based on the 33×33 correlation matrices, on the average, a variable was 50.6% in the year 1980, and 37.9% in the year 1995 significantly and positively correlated with the other variables. Similarly, a variable was 3.0% in the year 1980, and 2.6% in the year 1995 significantly and negatively correlated with the other variables. Tables 4 and 5 show the aggregated results of the correlation matrices for two selected cross sections. The correlation analysis reflected significant correlations among 33 variables. The few number of negative correlation in the 33×33 correlation matrices suggestes that growths in each variable is generally associated with the others. This is an overall conclusion according to the averaged values of the countries. In order to develop country-specific study, elasticity analysis is used and will be introduced in the next section. Elasticity analysis Sustainable Development has been characterized by concurrently focusing on three different dimensions: economical, environmental, and social aspects. One way to measure this manifold concept is redefining the popular term “sustainable development” as “harmonic development”. This interpretation is applicable because consistency among the growth of all these three aspects would naturally cause the main objectives of a sustainable development. The current research proposes a measure of sustainability based on this special viewpoint. This measure is elasticity, which is used widely in economic literature. In the paper, the concept of elasticity is used as a technique for developing more comprehensive indicators. The basic idea of “elasticity” is that it measures how strongly people respond to a change in a relevant factor (Jalal and Rogers, 2002). For instance, when the demand for a product is price elastic, then the quantity demanded changes a lot when the price of the product changes. Conversely, when the demand is price inelastic, then the quantity demanded changes only a little when the price changes. Elasticity is widely used in economic analyses that study the relationship between the price of a commodity, and its demand. In such analyses depending on elasticity values, demand can be elastic or inelastic. Indeed, elasticities greater than 1 indicate an elastic relationship and those less than one reflect an inelastic relationship (Vaziri and Rassafi, 2001). In current paper, which comparatively studies the relationship between non-transportation and transportation variables, the ordinal values of elasticity among countries are important and are used to assess sustainable transportation of the countries. Elasticity has limitations and strengths. It measures economic, environmental, or social changes with respect to transportation change and therefore is a trend variable (Jalal and Rogers, 2002). This characteristic also implies that elasticity reflects the relative dynamic behavior of the variables. The term “relative” herein means that elasticity shows the trends of variables but does not reflect their state. The arc elasticity E of a variable Y with respect to a variable X for the period t1-t2 reflects the percent variable Y changes with respect to one percent change of the variable X as is shown by Equation 1:
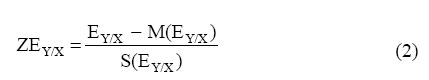
Where EY/X,t1-t2 is the arc elasticity of variable Y with respect to variable X during the period t1 to t2. When the difference between t1 to t2 gets very small, the arc elasticity converges to point elasticity. For the period of 1980 to 1995, 270 arc elasticities were computed. Each of these elasticities shows the percentage change of a particular aspect of a country with respect to that of a transportation variable. Integrating Indicators For comparative assessment of transportation sustainability, elasticities of non-transportation with respect to transportation variables were used to develop a composite sustainability index. There are many suggestions to combine different sustainability variables to develop a single measure to present the approximate overall status (Moffatt, 2001), (United Nations, 2000), (Vaziri and Rassafi 2001), (Vaziri andRassafi, 2003). To aggregate elasticities and make them comparable, first Z scores were computed by:
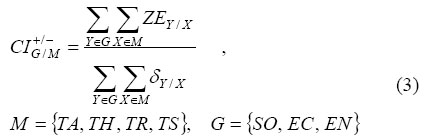
Where ZEY/X is the Z score of the EY/X as computed by Equation 1, M () and S () are functions that return the mean and the standard deviation of their arguments, respectively. The Y is a non-transportation variable, and the X is a transportation variable, Y={SO1-SO6, EN1-EN3, EC1-EC6}, X={TA1-TA3, TH1-TH6, TR1-TR6, TS1-TS3}. The composite index of each nontransportation group, G, with respect to each transportation mode, M, CIG/M using the Z scores were subsequently computed as:
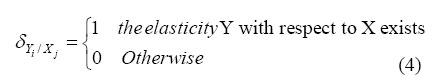
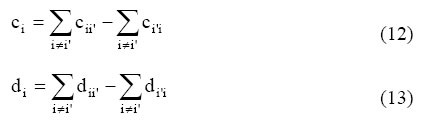
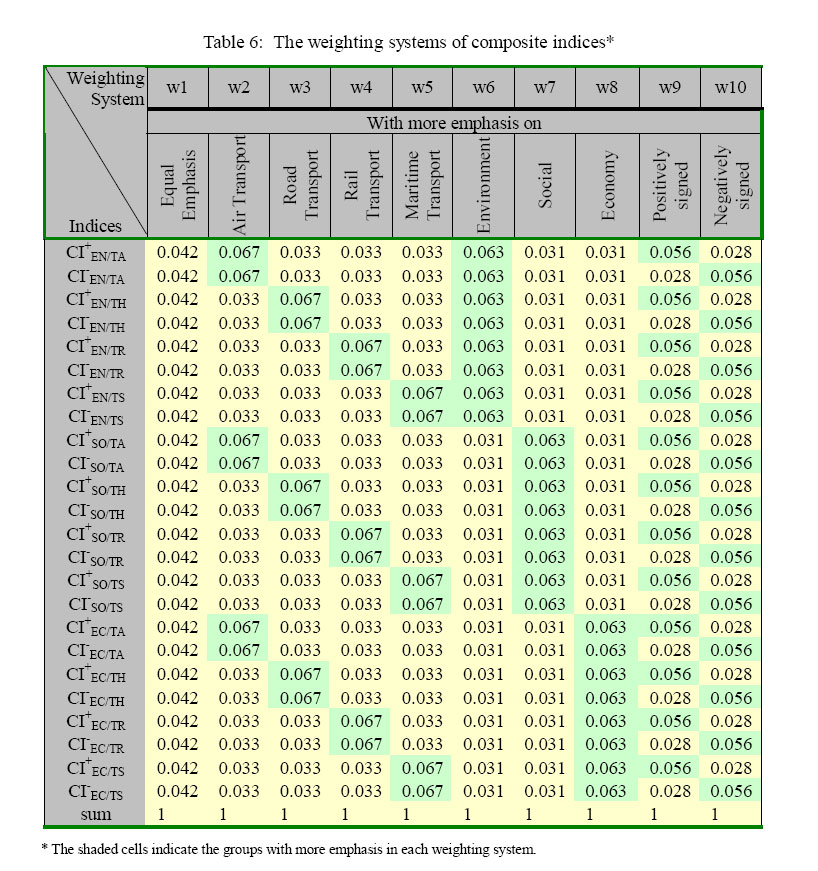
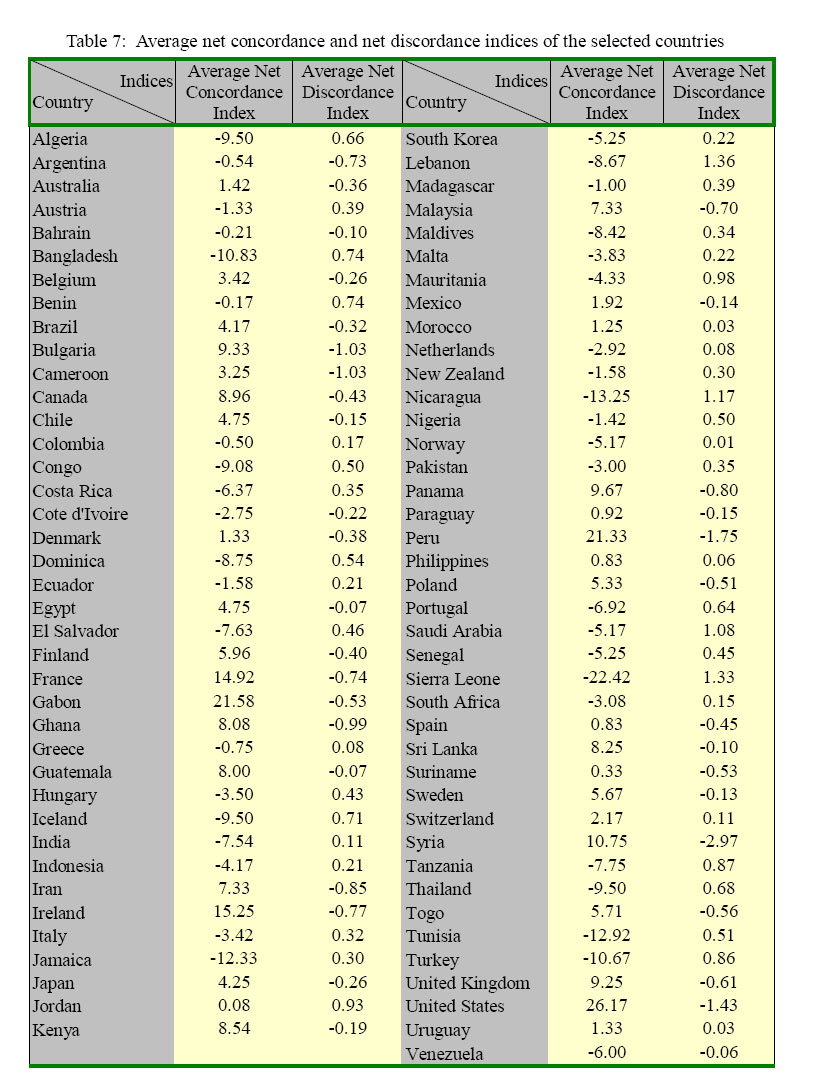
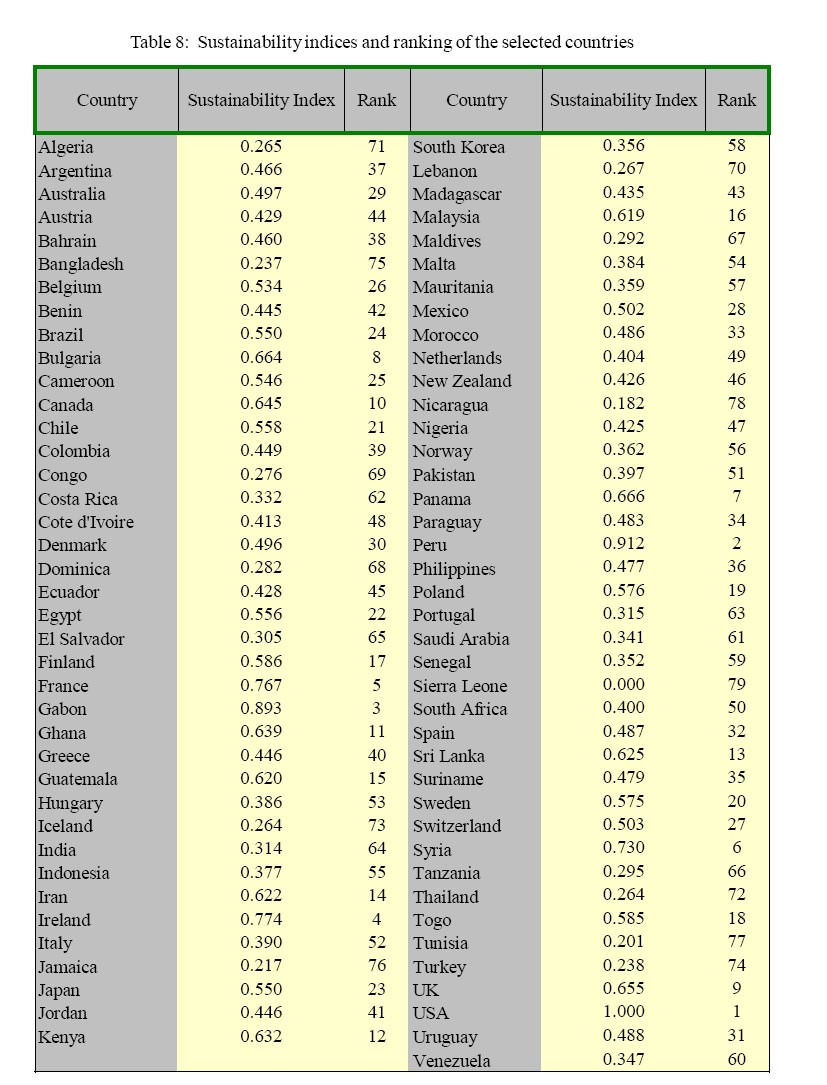
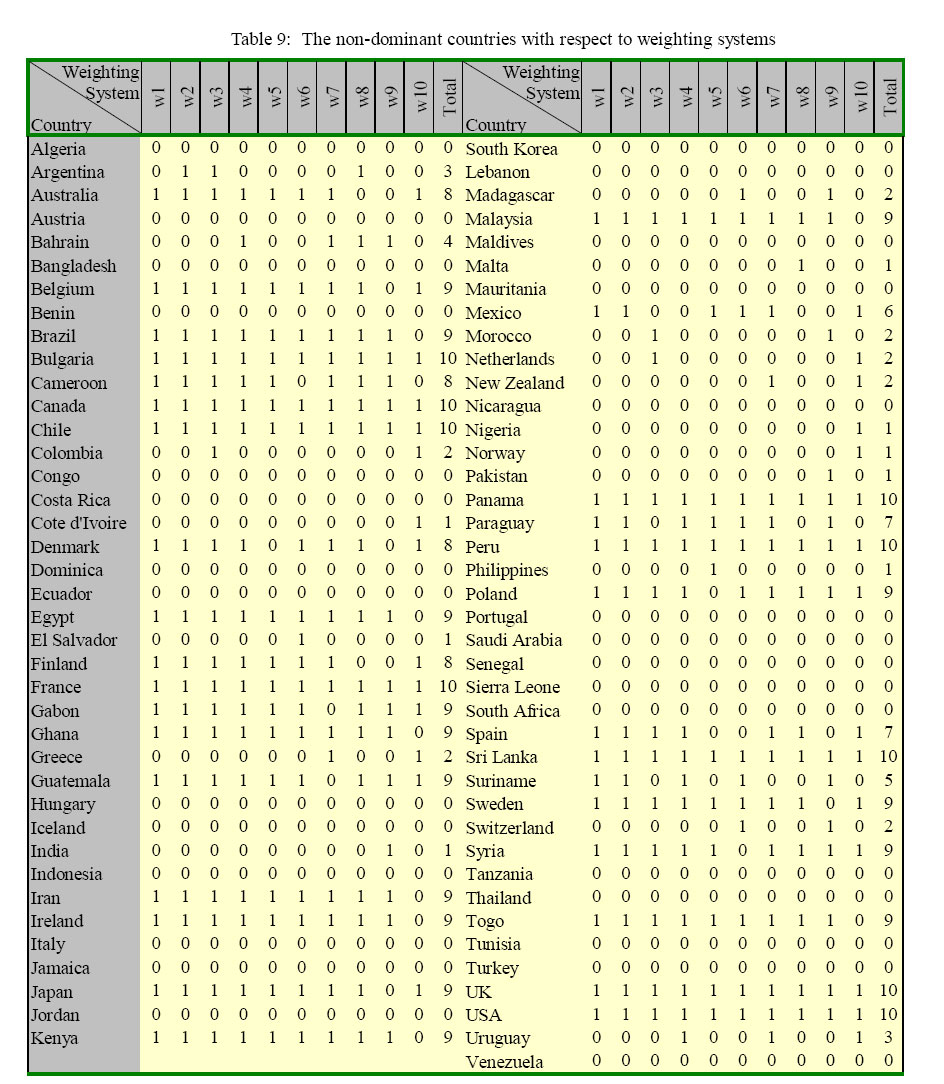
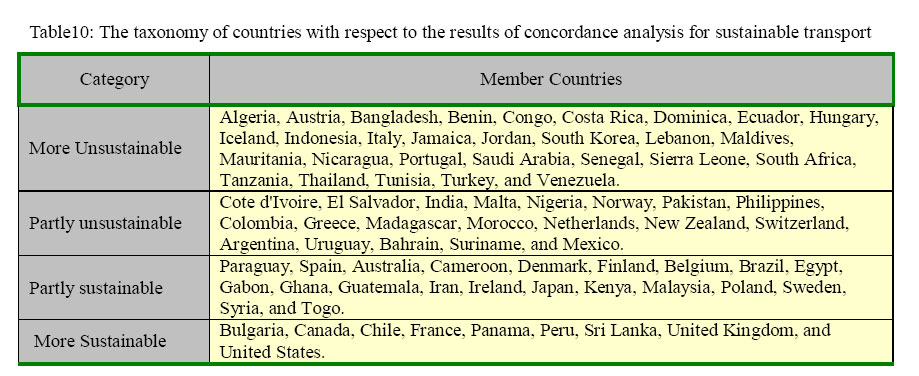
Where CIG +// − M is the composite index of non-transportation group G, including social group, SO, economy group, EC, and environment group, EN, with respect to transportation modes M, including Air, TA, Road, TH, Rail, TR, and maritime transport, TS. The plus or minus signs show two subgroups of G each of which consisted of variables with desirable positive sign or with desirable negative sign showed in Table 1, respectively. Hence, the total number of these composite indices is 12, which is the multiplication of 4 modes by 3 non-transportation groups by 2 subgroups of variables with plus or minus sign in Table 1. For example CI -SO/TA indicates the composite index of social group with desirable negative change with respect to air transportation group. The values of these composite indices can not be tabulated in a reasonable size. Concordance analysis In order to achieve an overall assessment of countries with respect to 24 computed composite indices concordance analysis, is performedwhich is one of the multi-criteria assessment tools. In this technique alternate plans are ranked by a series of pairwise comparisons across the set of objectives inin a rank-ordering technique. In current study, alternatives are countries and objectives are three calculated indices of public and private transport. The analysis is based on the project effects matrix, which contains a vector of scores for each alternative on each of the chosen objective measures. Two different indices are calculated from the project effects matrix: A concordance index calculates the degree to which one alternative plan is preferred to another for a given weighting structure. A discordance index calculates the degree to which one alternative plan is dominated by another. Dominance indices are developed from the concordance and discordance scores, and they are used to establish the relative preference of each alternative with respect to the given weighting scheme. Alternatives that perform better than average on both concordance and discordance are defined as non-dominated (Giuliano, 1985). Let Zij be the raw value of the jth index for the ith country, shown in Table 4. Let rij be the normalized value of the jth index for the ith country. Then:
The concordance and discordance sets are defined as: Cii' ={j | rij ≥ri'j } (6) Dii' ={j | rij respectively. The concordance and discordance indices are respectively defined as
where wj is the weight given to the jth elasticity index, and
Finally, the net concordance dominance and net discordance dominance values are
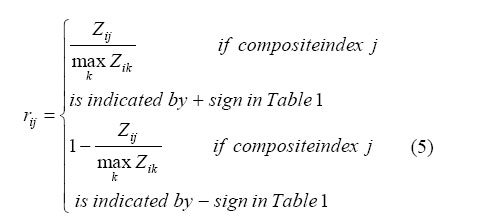
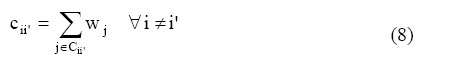
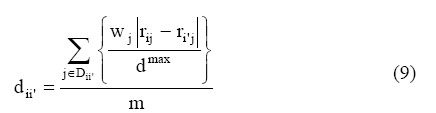
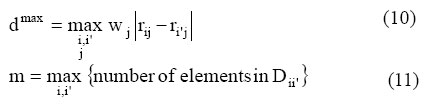
Countries with ci >0 and di<0 may be considered non-dominant. These are the better countries given the set of index weights. Performing the abovementioned calculations for the 79 countries and 24 composite elasticity indices with 10 weighting strategies identifies the comparative situation of countries with respect to transportation sustainability and balancing. The 10 weighting strategies include equal emphasis to all indices as weighting system number 1; and more emphasis to air transport, road transport, rail transport, maritime transport, environment, social, and economic group as weighting systems number 2 to 8, respectively. The last two weighting system belong to more emphasis to subgroups with positive sign, as weighting system 9, and subgroups of negative sign as weighting system 10. Table 6 shows the weighting systems for the composite indices. Table 7 shows the results of calculation of net concordance and discordance indices for the countries and considering the weighting systems introduced. In order to have reasonable size tables, the average values of net concordance and net discordance indices have been reported. Having this values one can rank countries based on each of weighting systems w1 to w10. This has been done in Table 8 which presents a sustainability index of countries after rescaling the values of average net concordance index minus average net discordance index to a range between 0 and 1. In this measurement system 0 is the worst and 1 is the best. The values of the sustainability index of the selected countries show that United States is in the best place and Sierra Leon is in the worst place. Non-dominated countries are identified in Table 9. Countries with greater nondominance values are prefered. The results of this table are in harmony with that of Table 8. This table provides details for classifying countries based on their non-dominance values. Thus, the 79 countries are grouped in three classes of more sustainable; partly sustainable, partly unsustainable; and more unsustainable as shown in Table 10. Discussion and Conclusion The study offers the methodology and results of a comparative appraisal of macroscopic transportation sustainability for the selected world countries. The paper attempts to characterize and assess national sustainability by considering relevant characteristics of a country including transportation, economy, environment, and social aspects. The accessible databases were overwhelmed by and relations for the selected variables. It showed incomplete data and missing values. Seventy nine significant relationships between each variable and countries were selected for detailed analysis. The the others. Having proposed a different viewpoint study time-series database consisted of 33 variables, to sustainable development which was covering 1980 to 1995. The study database univariate analysis showed development elasticity values of non-transport significant variability. The correlation analyses for variables with respect to transport ones were the selected countries presented interesting results presented as study indicators. The elasticity analysis sheds further light on the variable changes and trends during the period of 15 years for the countries. For the selected countries, the composite indices were computed and were suggested for comparative assessment and ranking. Using concordance analysis the 24 composite indices of each country were aggregated to a unique sustainability index. The index showed that among the selected countries United States had the highest ranking and Sierra Leon had the lowest ranking. Moreover, the taxonomy of countries based on the non-dominance values was performed. Given these values, countries were categorized to four classes according to the their non-dominance values within the ten weighting systems. The results of the study depict an overall scheme for comparative assessment of transportation sustainability of the countries. Furthermore, they identify the “more sustainable” countries as practical examples for “more unsustainable”countries, in order to help such countries in development of realistic and optimum strategies. References
© 2005 Center for Environment and Energy Research and Studies (CEERS) The following images related to this document are available:Photo images[st05011t7.jpg] [st05011t5.jpg] [st05011t8.jpg] [st05011f1.jpg] [st05011t9.jpg] [st05011t4.jpg] [st05011t6.jpg] [st05011t10.jpg] [st05011t1.jpg] [st05011t3.jpg] [st05011t2.jpg] |
| |||||||||
