 |
| About Bioline | All Journals | Testimonials | Membership | News |
|
||||||
|
||||||
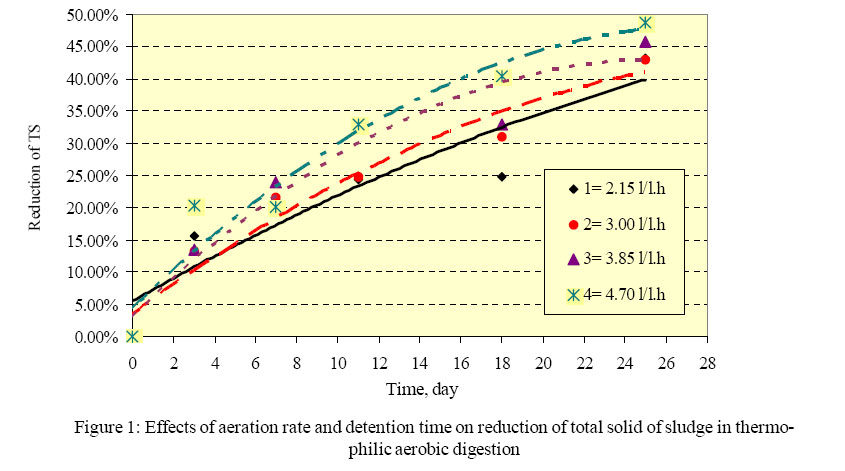
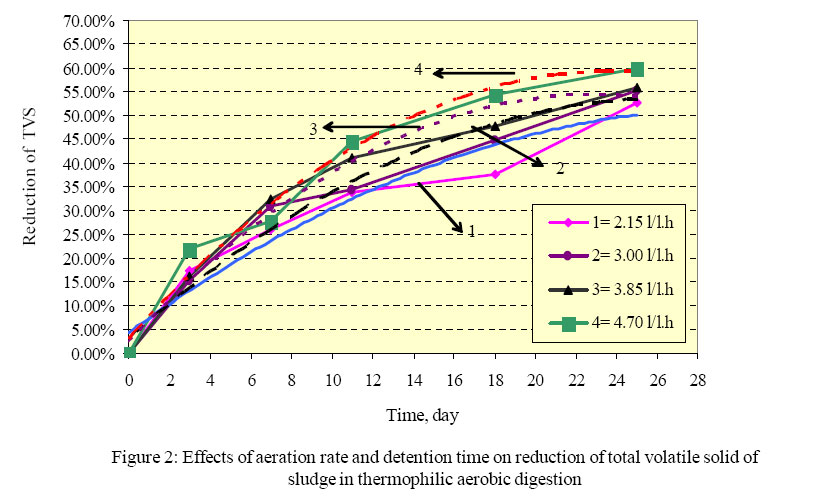
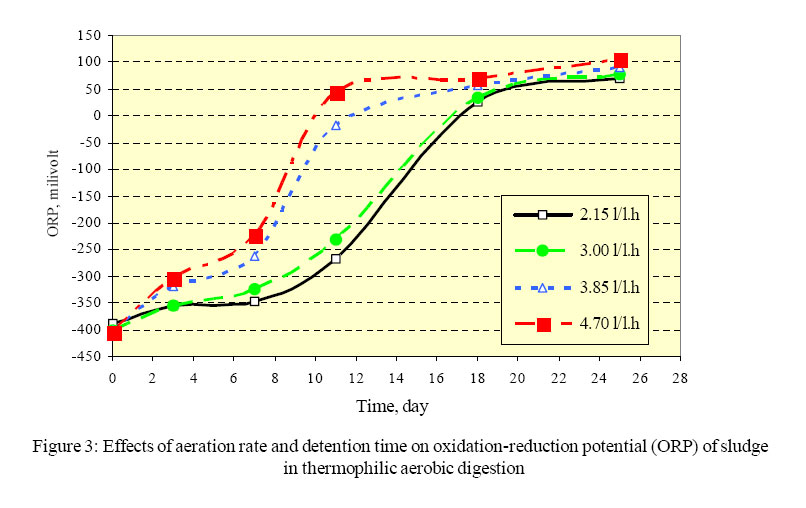
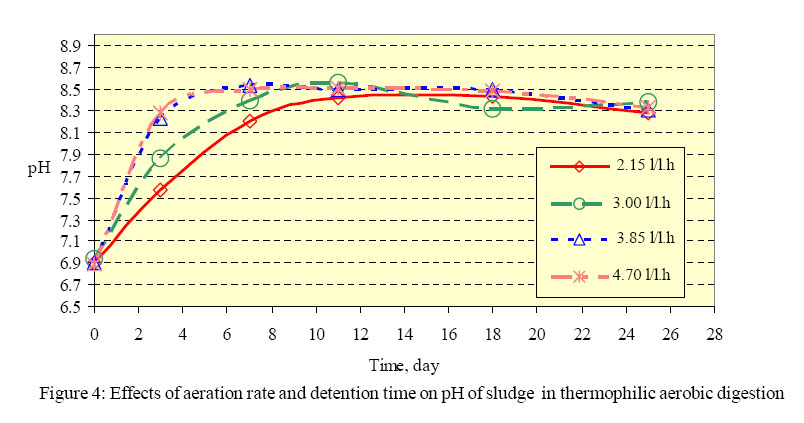
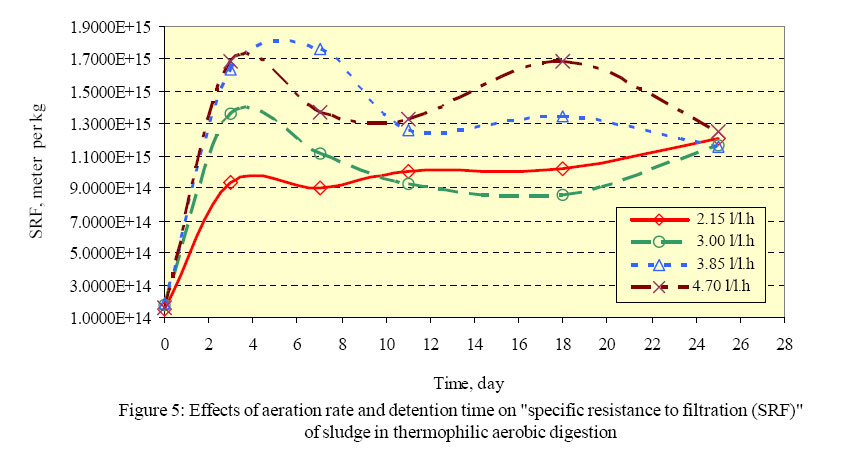
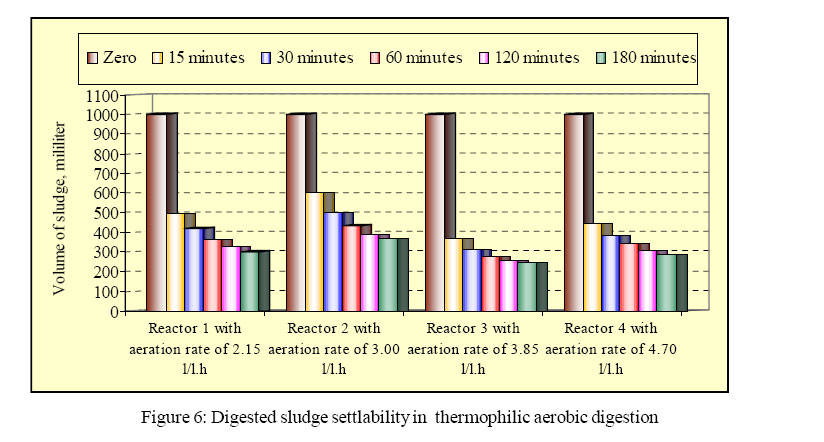
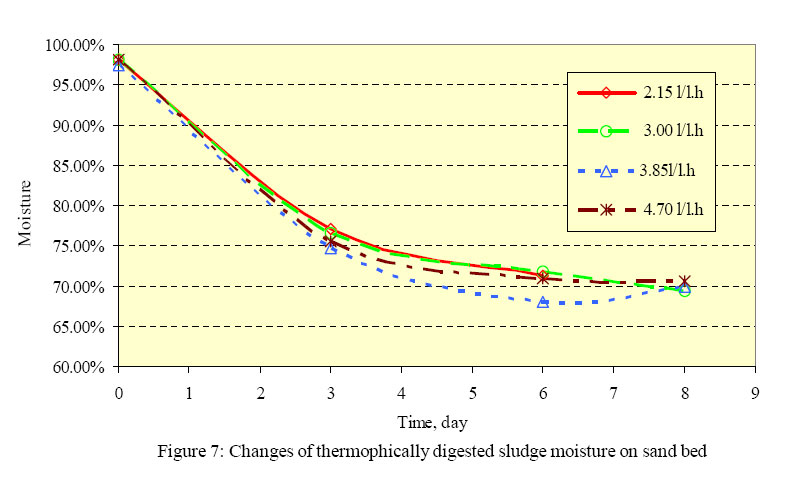
International Journal of Enviornmental Science and Technology, Vol. 2, No. 2, Summer, 2005, pp. 105-111 Effects of aeration rate and detention time on thermophilic aerobic digestion of mixed sludge and its dewaterability H. Movahedian Attar, *B. Bina and Kh. Moeinian Department of Environmental Health Engineering, School of Public Health, Code Number: st05014 Abstract Thermophilic aerobic digestion (TAD) is a possible alternative for rapid sludge degradation and producing Class A biosolids. Aeration rate and detention time are two of the important parameters in TAD processes due to rapidly growing thermophilic bacteria population, limited solubility of oxygen at high temperatures and the need to prevent cooling of TAD process. Also the current knowledge and understanding of dewatering TAD biosolids are limited and incompelet.The objectives of this study were to investigate the effects of various aeration rates and detention time on some characteristics of mixed sewage sludge. Four glass-cylindrical digesters with 7 liters of sludge in each, placed in a water bath and were operated at 55 °C with the aeration rates of 2.14, 3.00, 3.86 and 4.71 volume of air per volume of sludge per hours. It was found the increase in aeration rate decreased the required detention time in order to meet the Class A sludge regulations to reduce vector attraction. The values of Oxidation-Reduction Potential (ORP) were changed from negative values to positiv ones and the values of pH were increased from around neutral to slightly basic, but this increases were occured at different detention times. TAD affected dewaterability of mixed sewage sludge and produced biosolids with higher specific resistance to filtration (lower dewaterability) than undigested sludge. Thermophically digested sludge has a good setteling behavior and air drying on sand bed. Key words: Sludge processing, thermophilic aerobic digestion, Class A biosolid, oxidation-reduction potential (ORP), sludge dewaterability, specific resistance to filtration (SRF) Introduction Thermophilic aerobic digestion (TAD) is a possible alternative for rapid sludge degradation and an efficient method for producing Class A biosolids (Zhou, et al., 2002). The final product of TAD can be used in non-restricted applications as parkland soil conditioner or as agricultural and forest fertilizer (Young-kee, et al., 2002; Zhou, et al., 2002 and Zhou, et al., 2001). The Class A sludge regulations require that two criteria must be met. The first criteria deals with twelve alternatives methods to reduce vector attraction. Under option 1, reduction of vector attraction is achieved if the mass of volatile solids is reduced by at least 38% (U.S.EPA, 2003). The operating temperature of TAD process is one of the main operational parameters. The thermophilic digestion usually covers a temperature from 45 to 65°C, although in some instances hotter temperatures have been observed. (Staton, et al., 2001). Oxygen concentration is one of the limiting parameters in full-scale TAD processes. This is due to high demand for oxygen by the rapidly growing thermophilic bacteria population, limited solubility of oxygen at high temperatures and the need to prevent cooling of TAD process which would occur at high aeration rates (Ugwuanyi, et al., 2005). The actual oxygen requirement for the TAD process depends on factors such as operating temperature, type of sludge and solids retention time (Ros and Zupancic, 2002). At any given aeration rate and waste loading, these variables should relate constantly in such a manner as to lead to reproducible effluent quality (Ugwuanyi, et al., 2005). The aeration rate in TAD is different in references [for example: 0.5-2.0 l/l.h (Ponti, et al., 1995), 2.0 l/l.h (Kelly and Wong, 1997), 11 l/l.h (Zhou, et al., 2002) but the typical range is 2-4 l/l.h (Spinosa and Vesilind, 2001 and Staton, et al., 2001). In these aeration rates and high tempratures the concentration of dissolved oxygen (DO) is very low and monitoring of DO, if not impossible, has proven to be quite difficult. Therefor there is a shift towards determination of oxidation–reduction potential (ORP) as an indicator of the aerobic versus anaerobic condition in TAD (Staton, et al., 2001). The examples of observed ORP in TAD are: from –500 to –300 (Mavinic, et al., 2001) and from –500 to 200 with upper end of +50 to +150 milivolts (Staton,et al., 2001). The current knowledge and understanding of dewatering TAD biosolids are limited and incompelet. The lack of information is partially because of the TAD relatively short history and the difficalties associated with the operation of full scale TAD facilities (Zhou,et al., 2001; Zhou,et al., 2002 and Chang,et al., 2001). Full- scale experience has revealed, however, that thermophilically digested biosolids exhibit poorer dewaterability than mesophilically digested biosolids (Zhou,et al., 2001). One of the classical and most commonly parameter used to evaluate sludge dewaterability or filterability is the specific resistance to filtration (SRF) (European Environment Agency, 1999). The SRF test measures the resistance of sludge to filtration or dewatering (Zahangir Alam,et al., 2003; Chang,et al., 2001 and Lee and Liu, 2000).Values of the order of 1012 m/kg or less are indicative of good dewaterability or filterability and SRF of raw sludge generally exeed 1014 m/kg (European Environment Agency, 1999). Values of 8.5× 10¹³ m/kg for sewage sludge (Zahangir Alam,et al., 2003) and 8.4 × 10¹⁵ m/kg for waste activated sludge have been reported (Chang,et al., 2001). This investigation was carried out to understand the effects of different aeration rates and detention times on some physical and chemical parameters of mixed sewage sludge during TAD. The objectives of this study were to investigate the effects of various aeration rates on: (1) detention time for removing 38 % of total volatile solid, (2) dewaterability of thermophilically digested biosolids, and (3) oxidation -reduction potential of biosolids (4) pH of biosolids, and so on. This study has been done in Isfahan University of Medical Sciences in 2005. Materials and Methods Four glass-cylindrical bioreactors with 20 centimeters in diameter and 20 liters in volume were placed in a water bath and were operated at 55 °C. The feeding sludge was mixed sewage sludge from South Isfahan Wastewater Treatment Plant (SIWTP). The SIWTP has an activated sludge process and the influent of SIWTP is predominantly municipal sewage. The volume of mixed feeding sludge in each bioreactors were 7 liters, the activated sludge/primary sludge ratio of feeding sludge were approximately 2 and the range of total solid in feeding sludge was 1.5-2.0 percent. Air diffusers provided fine bubbles of air and the aeration rates were 2.14, 3.00, 3.86 and 4.71 volume of air per volumeofsludge per hours respectively. Each bioreactors were equipped with an individual mechanical mixers. Prior to each sampling the contents in each bioreactors were thoroughly mixed manually, and the volume of evaporated water was replaced with distilled water. The digestion were repeated three times. Total solids (TS), totalvolatile solids(TVS), oxidation –reduction potential (ORP), pH, moisture and chemical oxygen demand (COD) were measured according to Standard Methods (APHA, 1995). Specific resistance to filtration (SRF) test known as the Buchner funnel test is one of the most commonly employed test for the evaluation of wastewater sludge dewaterability or filterability. The SRF test measures the resistance of sludge to filtration or dewatering (ShangriAlam,et al., 2003; Chang,et al., 2001, Lee and Liu, 2000). The SRF test was performed using a 9-cm diameter whatman # 1 filter paper at an applied vacuum pressure of 600 mmHg. The volume of filtrate was recorded as a function of time. Specific resistance to filtration (SRF = r) was determined using a plot of filtration time / filtrate volume (t/V) versus filtrate volume (V). Using the slope of the line, SRF was calculated from the following formula: t/V = (µr w/ 2A2P)V + µRm /AP (1) where “r” is the specific resistance to filtration (m/ kg), “P” the pressure of filtration (N/m2), “µ” the viscosity of filtrate (N . s/m2), “V” the volume of filtrate (m3), “t” the filtration time (s), “w” the weight of dry solids per volume of filtrate (kg/m3), “A” the area of the filter paper (m2), and “Rm” the resistance on the medium (1/m). For compressible sludge, ignoring “Rm” which is very small as compared to the resistance on the sludge cake, Equation 1 was reduced to: t/V = (µr w / 2A2P)V=bV (2) taking the slope of the line as “b”, SRF was calculated from the formula: r = (2A2P / µw )b (3) Settlability test can be used to investigate the sludge-water separation behavior (Chen,et al., 1996). The settlability test was done to investigate the sludge-water separation behavior. The settling column was a graduated glass cylinder with 6 cm. in diameter. One liter of digested sludge was placed in the setteling column and the height of interface was recorded at 0, 15, 30, 60, 120 and 180 minutes intervals. The air drying of sludge can be done using sand beds (Carl,et al.,1981). The beds used for this test were consists of a glass cubic square with dimensions of 20×20×50 cm. filled with sand and gravel as following: perforated plate at the bottom, then 5 cm layer of gravel with diameters of 3-5 mm. and finally 12.5 cm. layer of sand. The sand had an effective size of 0.3-1.2 mm. and a uniformity 50.00% coefficient of 3. The moisture of digested sludge on the beds was measured during the time. Results The TAD process at 55°C with four different aeration rates (2.15 l/l.h, 3.00 l/l.h, 3.85 l/l.h and 4.70 l/l.h) were performed three times. The average of data are presented in the following figures. Figure 1 and 2 demonstrate the percentage of removed total solid (TS) and total volatile solid (TVS) as a function of time respectively. The average and standard deviation of TS concentrations of feeding sludge for four bioreactors were: 16862± 2497, 16568± 2771, 17185± 2291, 16405± 2737 mg/l respectively. The average and standard deviation of TVS concentrations in feeding sludge for four bioreactors were: 11787± 1458, 11623± 1600, 12103± 1191, 11407± 2189 mg/l respectively. Changes of sludge oxidation-reduction potential (ORP) in all four bioreactors has been showed in Figure 3. The average and standard deviation of ORP in feeding sludge for four bioreactors were: -387± 21, -401± 26, -400± 21, -403± 22 milivolt, respectively. The values of ORP in all four bioreactors were increased during the time of digestion, but the increase of ORP in bioreactors 3 and 4 were found more rapid than bioreactors 1 and 2. Figure 4 shows the changes of pH during the thermophilic aerobic digestion. The average and standard deviation of feeding sludge pH in four bioreactors were: 6.90± 0.35, 6.94± 0.32, 6.91± 0.43, 6.89± 0.30, respectively. The Figure also shows the effects of digestion and different aeration rates on the pH of digesting sludge. The required detention times for increasing the pH to around 8.3 in bioreactors 1, 2, 3 and 4 were 8, 6, 3 and 3 days respectively. Figure 5 shows the effect of aeration rate and detention time on sludge dewaterability. The sludge dewaterability was determined by specific resistance to filtration (SRF) and the average and standard deviation of feeding sludge SRF in four bioreactors were: 1.5039×10¹⁴ ± 6.7171×10¹³; 1.7695× 10¹⁴ ± 2.6211× 10¹³; 1.8410 × 10¹⁴ ± 5.4148× 10¹² and 1.6250×10¹⁴ ± 3.1383×10¹³m/kg respectively. As it can be seen in figure 5 the TAD, In generall, had detrimental effect on sludge dewaterability and significant deterioration was occurred wihin 3-days of digestion. After 3-days digestion at 55°C the initial values of feeding sludge SRF in all four mentioned bioreactoes increased to: 9.3909×10¹⁴, 1.3623×10¹⁵, 1.6342×10¹⁵and 1.6877× 10¹⁵ m/kg respectively. Thereafter, the sludge dewaterability in bioreactor 1 not affected by detention time. However, in other three bioreactors the SRF of sludge decreased in 8 subsequent days. Finally, after 11-days relatively slight changes of SRF were found in bioreactors 2, 3 and 4. Figure 6 shows the settlability or sludge-water separation behavior of digested sludge. As this figure shows the occupied volume by settled sludge is reduced during the time. The average and standard deviation of supernatant COD concentrations of four bioreactors after 60 minutes settling time were: 2921±277, 2365±249, 2557±144, 1933±1085 mg/l respectively. Figure 7 demonstrates the air drying of digested sludge on sand beds. As the figure shows the moisture of sludge after 6 days was around 70 percent. Discussion and Conclusion As Figure 1 shows the removal percentage of TS increases gradually as a function of time in all four bioreactors. For example in bioreactor 4 with aeration rate of 4.70 l/l.h, the percentage of removed TS increases from zero to 19, 28 and 39 percent during 5, 10 and 16 days of detention time respectively. In addition, increase in aeration rate results in more rapid decreasing of TS. For example after 16 days the TS in bioreactor 1 with aeration rate of 2.15 l/l.h was 30 percent while at the same time the removed TS in bioreactor 4 with aeration rate of 4.70 l/l.h was 39 percent. As figure 2 shows the percentage of removed TVS increases gradually as a function of time in all four bioreactors. This figure shows clearly the effect of aeration rate to meet the first criteria of Class A sludge regulations to reduce vector attraction. For removal of 38 percent of TVS, the required detention time for bioreactor 1 with aeration rate of 2.15 l/l.h, bioreactor 2 with aeration rate of 3.00 l/l.h, bioreactor 3 with aeration rate of 3.85 l/l.h, and bioreactor 4 with aeration rate of 4.70 l/l.h, are 14.80, 13.36, 11.71, and 10.43 days respectively. In other words, the efficiency of TVS removal increases with increase in aeration rate. The values of ORP in all four bioreactors were changed from negative values to positive ones (from around –400 to around 50-100 milivolt). These values of ORP are similar to some research workes (Staton,et al., 2001). The increase of ORP for aeration rates of 3.85 and 4.70 l/l.h were more rapid than aeration rates of 2.15, 3.00 l/l.h and this was due to increase in aeration rate. In other words, higher values of aeration rate resulted in higher ORP at a given detention time. However, at detention times of more than 17 days the ORP of all four bioreactor had little changes and closed to each others. The reason is that the content of biodegradable organic matter in all four bioreactors were decreased adequately. In general, pH of sludge were increased from around 6.90 to around 8.40 in all TAD bioreactors (Figure 4) but these increases were happened at different detention times. These pH values have been observed in other investigations (Staton,et al., 2001 and Ugwuanyi,et al., 2005). The required detention time for achieving pH around 8.3 was decreased with increase in aeration rate. TAD produces ammonia and reaction of produced ammonia with water and carbon dioxide will form ammonium bicarbonate and ammonium carbonate which increase the alkalinity. Because nitrification dose not occur the pH of sludge increases. TAD affected dewaterability of mixed sewage sludge and produced biosolids with higher SRF than undigested mixed sewage sludge. Higher SRF suggests more difficult dewatering. TAD resulted in the most deterioriation in dewaterability of the sludge during the first 3-days. However, after 11days changes in SRF of biosolids was not significant. Sizes of produced particles in this study were clearly (optical observations) smaller than the particles in undigested sludge and it seems this is the reason of higher SRF and lower dewaterability of digested sludge. The similar results obtained by other researchers (Zhou,et al., 2001 and Zahangir Alam,et al., 2003). After 60 minutes of settling the volume of sludge was decreased by the 60-70%. Therefore, thermophically digested sludge had a good settling behavior. Regarding air drying of digested sludge on sand bed no important differences were found between four bioreactors and after 6 days the moisture was around 70 percent. Acknowledgement The authors are grateful to the Isfahan University of Medical Sciences for its support. References
© 2005 Center for Environment and Energy Research and Studies (CEERS) The following images related to this document are available:Photo images[st05014f4.jpg] [st05014f7.jpg] [st05014f6.jpg] [st05014f2.jpg] [st05014f1.jpg] [st05014f3.jpg] [st05014f5.jpg] |
| |||||||||
