 |
| About Bioline | All Journals | Testimonials | Membership | News |
|
||||||
|
||||||
International Journal of Enviornmental Science and Technology, Vol. 2, No. 3, Autumn, 2005, pp. 207-215 Modeling of packed absorption tower for volatile organic compounds emission control *1M. S. Rahbar and 2T. Kaghazchi 1Department of Chemical Engineering, Faculty of Engineering, Imam Hossein University, Tehran, Iran Received 8 February 2005; revised 12 June 2005; accepted 10 August 2005 onlined 30 September 2005 Code Number: st05028 Abstract Development of chemical industry and high vapor pressure of volatile organic compounds (VOCs) have been caused that these materials recently be considered as a source of air pollution. These are different methods for separation of VOC from air that absorption by suitable and selective solvent is an efficient method. In this research, mathematical modeling of a packed absorption tower for separation of VOCs from air has been presented. Then, acetone vapors separation in this tower and with Intalox saddle packing has been investigated. Concentration of acetone in inlet air stream was 1.5 mol % which has reduced to 150 ppm (0.015 mol %) in effluent air stream. The results show that the packed absorption tower with this type of packing can separate 99% of acetone vapors. Comparison of the results obtained by Intalox saddle packing with the results obtained by another type of packing (with trade mark of Kerapak patented by Sulzer Company) shows that the tower gives the same efficiency for acetone separation. Thus, the efficiency of absorption process, mainly, depends on solvent type, composition of VOC in feed air, desired composition of VOC in outlet air (or percentage of VOC separation) and pressure drop. Key words: VOC, absorption, modeling , acetone, packed tower Introduction Volatile Organic Compounds (VOCs) are generated by power plants, municipal waste combustors, motor vehicles, solvent use, and the chemical and food industries. They are also emitted from natural sources like forests. VOCs in the atmosphere have two major health impacts: some are directly toxic and they can combine with nitrogen oxides to form ozone. These hazardous air pollutants are associated with cancer as well as adverse neurological, reproductive, and developmental effects (Hwa et al., 2000 and Palmgren, et al., 2001). Abatement methods for such emissions can generally be classified into four categories:
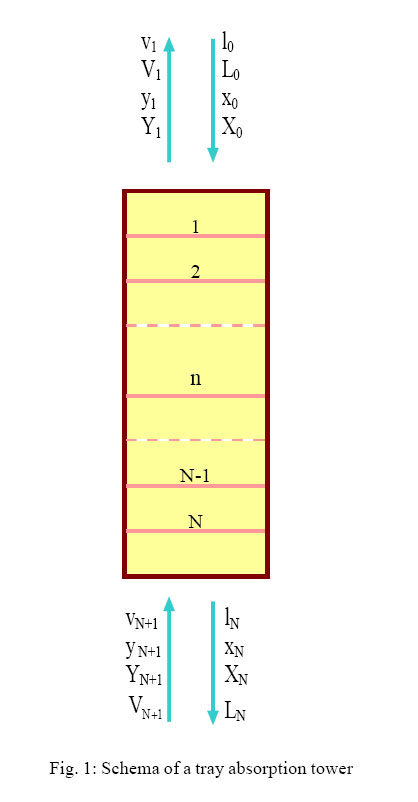
The first three are positive reduction techniques in that they actually reduce the mass of VOC released to the atmosphere. The fourth, solvent substitution does not reduce the quantity of organic emission and has been only marginally effective in reducing ambient concentrations of photochemical oxidants (Butcher, 2005). Carbon adsorption should continue to find use where the solvent has a relatively high market value and is amenable to recovery by such techniques. Incineration is expected to remain a viable alternative when organic concentrations can be maintained at relatively high levels, so that auxiliary fuel requirements are not excessive, or when energy in the hot exhaust elsewhere in the plant. Absorption method is an effective way to reduce VOCs emission from the different chemical process plants. Absorption is a physical process that involves transfer of one or more components from the gas phase into a liquid solvent. It is one of the so-called stage wise or equilibrium-stage operations. In some cases, a portion of the solvent may be transferred than the main intent of the absorption process. Absorption may be carried out on a once-through basis. Generally, however, the solvents used are expensive, so they are processed to remove the absorbed gas and are then returned to the system (Buonicore, 1980). An absorber is shown schematically in Fig. 1. Lean solvent enters the top of the absorber and flows downward in countercurrent contact with the rising vapor stream. Through mixing and contact, either on plates or packing, solute is transferred from the vapor phase to the liquid solvent. The ideal solvent must be defined as nonvolatile, free (or low-cost), no corrosive, stable, no viscous, no foaming, noninflammable, and with an infinite solubility for the solutes. Solvent selection is still very much “cut and try”procedure. There is no infallible a priori way to determine that a given material will make a good solvent for a given process. Absorption may involve the transfer of only one soluble component from an inert gas phase or conversely may involve the transfer of a multitude of solutes from the gas phase to the solvent. In one of the most widely used applications of absorption, in natural-gas processing for liquids recovery, all components in the gas phase are soluble to some extent in the liquid phase (McNulty and Chopey, 1994). This research has been done in Imam Hossein University during years of 2003-2004. Materials and Methods Mathematical modeling of a packed absorption tower For the absorber shown in Fig. 1, a material balance around the column for any component can be written:
For any plate in the absorber, the material balance for any component would be:
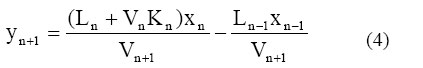
The expression for the vapor-liquid equilibrium curve can be written as: yn = Knxn (3) Substituting from equation (3) into equation (2) then yields, after rearrangement: Equation (4) will not plot as a straight line on y-x coordinates. Constant molar overflow cannot be assumed, because this would mean that no absorption takes place. Any solute transferred from the vapor phase to the liquid phase must result in a decrease in total vapor flow rate and increase in total liquid flow rate. For these reasons, a different approach is employed to provide a straight operation line on the graphical plot for absorption. If all liquidstream compositions are based on the pure solvent rate (l0) and all gas-stream compositions are based on the nondiffusing gas rate ( vN+1) to the absorber, the overall column material-balance becomes:
Along of tower l0 and vN+1 are constant. And the component balance for any tray becomes:
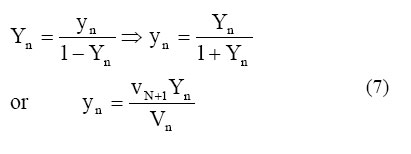
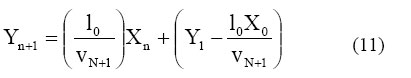
The mole fraction of a component in any stream can be expressed as: For a vapor stream:
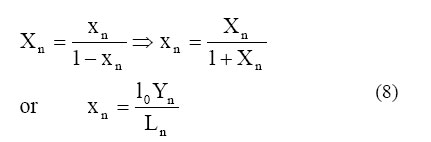
For a liquid stream:
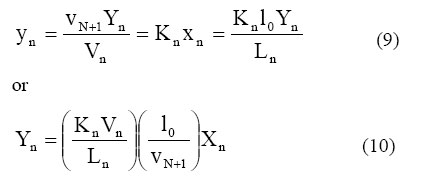
The equilibrium constant can be expressed in terms of Y and X as:
The reciprocal of the group in the first parenthesis, i.e., the group [Ln/(KnVn)], is know as the “absorption factor”. Equation (5) can be rearranged to:
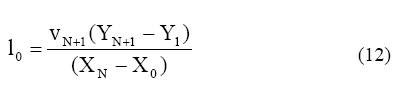
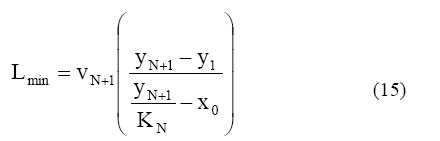
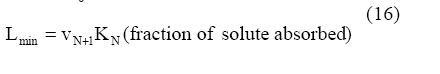
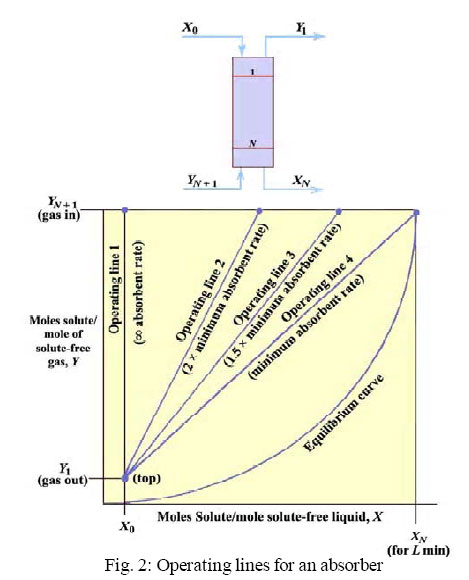
The line is referred to as the “operating line”for the absorber because it primarily depends on the lean-solvent flow to the absorber (l0) and the richgas flow rate to the absorber (vN+1) (Walas, 2005 and Suleimandiab, 1982). Minimum absorbent flow rate Operating lines for four different absorbent flow rates are shown in Fig. (2), where each operating line passes through the terminal point, (Y1 , X0), at the top of the column, and corresponds to a different liquid absorbent rate and corresponding slope, l0/vN+1. To achieve the desired value of Y1 for givenYN+1 , X0, and vN+1, the solute–free absorbent flow ratel0 must lie in the range of ∞ (operating line 1) to Lmin (operating line 4). The value of the solute concentration in the outlet liquid, XN, depends on l0 by a material balance on the solute for the entire absorber. From (5), for n = N,
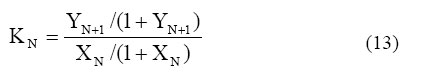
Note that the operating line can terminate at the equilibrium line, as for operating line 4, but cannot cross it because that would be a violation of the second law of thermodynamics. The value of Lmin corresponds to a value of XN (leaving the bottom of the tower) in equilibrium with YN+1, the solute concentration in the feed gas. It takes an infinite number of derived from (12) as follows. For stage N, (3) becomes:
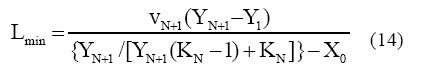
Solving (13) for XN and substituting the result into (12) gives
For dilute-solute conditions, whereY ≈ y and X ≈ x , (14) becomes
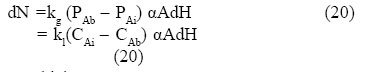
Furthermore, if the entering liquid contains no solute, that is,X0 ≈ 0, equation (15) becomes: This equation is reasonable because it would be expected thatLmin would increases withincreasingvN+1, K-value, and fraction of solute absorbed. The selection of the actual operating absorbent flow rate is based on some multiple ofLmin, typically from 1.1 to 2. A value of 1.5 corresponds closely to the value of 1.4 for the optimal absorption factor mentioned earlier. In Fig. 2, operating lines 2 and 3 correspond to 2.0 and 1.5 times, respectively. As the operating line moves form 1 to 4, the number of required equilibrium stages, N, increases from zero to infinity. Thus, a trade-off exists between L andN, and an optimal value of L exists (Suleimandiab, 1982 and Walas, 2005). Packed column calculations In many instances, absorption is carried out in a packed column, which may be considered to be a differential contactor. For the contactor shown in Fig. 1, the volume of the differential element of height will be: Volume= AdH (17) The interfacial area available for mass transfer is a function of the type and size of packing used in the tower. By incorporating a characteristic of the packing what is an indication of the interfacial contact area, we have: Interfacial area = αAdH (18) The mass transfer that occurs in the differential height in be expressed in terms of either the change in the gas-phase composition or the change in the liquid phase composition. Mass transfer = dN = VdY =LdX (19) In this case:
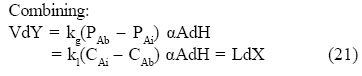
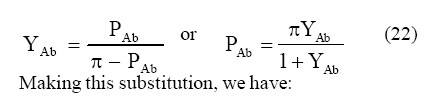
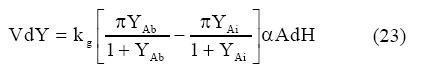
An order to use equation (21), one must be able to relate partial pressure and composition in the gas phase, or concentration and composition in the gas phase, or concentration and composition in the liquid phase. For the gas phase, we can relate the partial pressure and composition by:
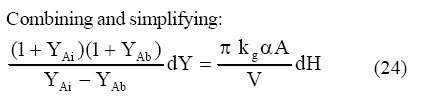
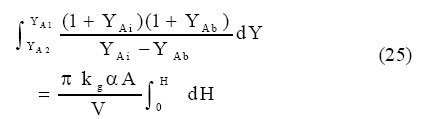
In order to obtain the height of packing required in a given application, equation (24) must be integrated:
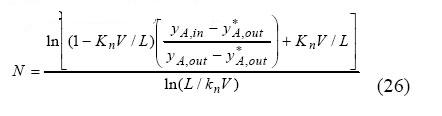
The relationship between bulk and interfacial compositions is, in general, not easily expressible in simple fashion that will allow for analytical integration. For this reason, equation (25) must ordinarily be integrated graphically or numerically (Shulman and Margolis, 2004; McNulty and Chopey, 1994). Transfer units There are two ways in which the total column required for making a given solute recovery can be estimated. One is through the use of the height equivalent to a theoretical plate (H.E.T.P.), and the second is through the use of the height of a transfer unit (H.T.U.). The H.E.T.P. must be experimentally determined in the laboratory, using the specific size and kind of packing of interest. The same thing is true of the H.T.U. Many feel that for a packed column, which approximates a differential contactor, use of the H.T.U. is more rigorous than using the stepwise H.E.T.P. The number of equilibrium stages, N, based on vapor-phase mass transfer and with considering of kn be constant is given by:
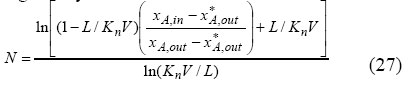
The number of equilibrium stages for the liquid phase is given by:
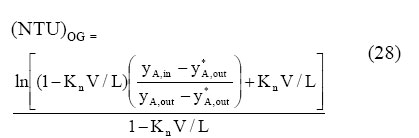
ln( KnV / L) (27) In like fashion, the number of vapor-phase transfer unite (NTU)OG is given by:
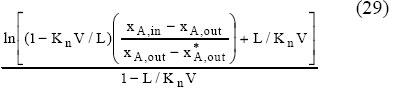
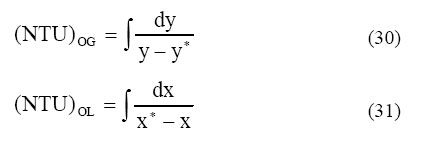
The number of liquid-phase transfer units (NTU)OL is given by: (NTU)OL The number of liquid-phase transfer units (NTU)OL is not the same as the number of gas-phase transfer units ((NTU)OG unless the operating and equilibrium lines are straight and parallel. For absorption column, the operating line is usually steeper than the equilibrium line, which makes (NTU)OG greater then (NTU)OL, but this difference is offset by the difference between (NTU)OG and the column height can be determined using either approach. The (NTU)OL and (NTU)OG, also, can be calculated by graphical method and using of equation (30 and 31) (Walas, 2005 and Strigle, 1988).
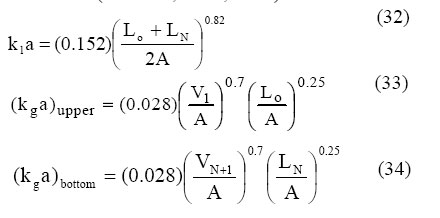
Estimating mass-transfer coefficients A number of methods have been suggested for estimating mass-transfer coefficients for absorption. All of these tend to be both system and packingtype dependent. As a result, few have wide-range general applicability, and all must be used with considerable caution. By far the best procedure is to obtain experimental data for the specific system and packing type being considered. Liquid and gas film coefficients can be calculated by the equations as follows (Chhabra,et al., 1980):
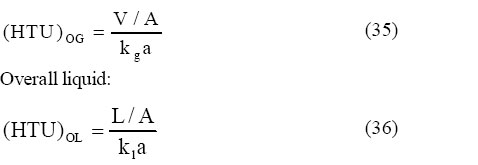
Height of transfer units The overall height of a transfer unit can be defined as the height of a packed section required to accomplish a change in concentration equal to the average driving force in that section. Values of (HTU)OG for a particular system are sometimes available directly from the literature or from pilotplant tests, but often they must be estimated from empirical correlations for the individual coefficients or the individual heights of a transfer unit.
The equation for column height can be written as follows:
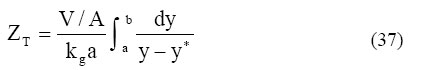
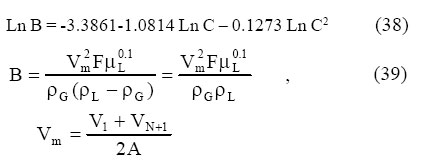
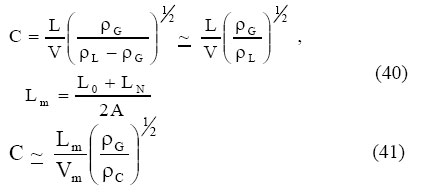
The integral in equation (37) represents the change in vapor concentration divided by the average driving force and is called the number of transfer units (NTU)OG . The subscripts show that (NTU)OG is based on the overall driving force for the gas phase. The other part of equation (37) has the units of length and is called the height of a transfer unit (HTU)OG. Thus a simple design method is to determine (NTU)OG from the y-x diagram and multiply it by (HTU)OG calculated from masstransfer correlations(Wike and Stockar, 2003): ZT = (NTU)OG . (HTU)OG Packed tower diameter In this modeling, we use a quick method for estimation of packed tower diameter presented by Mahajani (Mahajani, 1985). He utilized a series of empirical correlation tells the gas superficial mass velocity (mean) (Vm) at flooding conditions once the packing factor (F) is known:
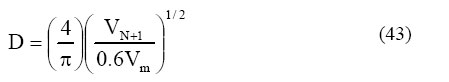
ven L0,VN+1 and the physical properties, one can calculated C and then figure B from equation (39). To find Vm from B, the packing factor (F) is needed. Packing factor (F) is correlated empirically with the packing properties: F = Zd –n (42) Where z and n are constants listed in the table (1) and d is the nominal packing diameter (mm). Design practice generally specifies a gas superficial mass velocity 60% that of the flooding velocity for absorbers. Once Vm at flooding is known, therefore, one can calculate tower diameter (in meter) from a simple geometric relation:
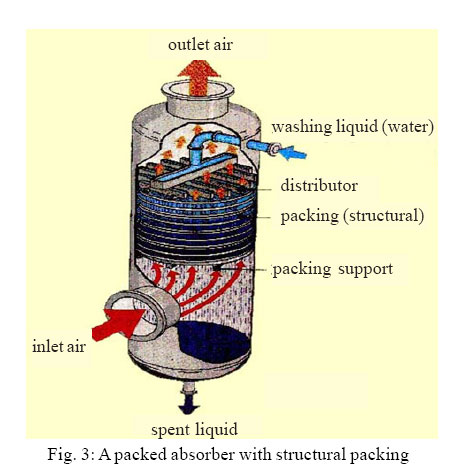
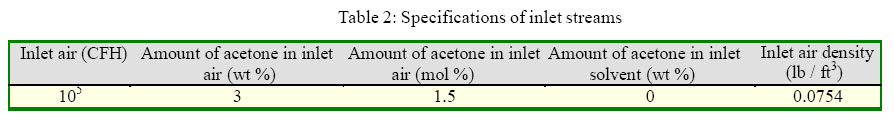
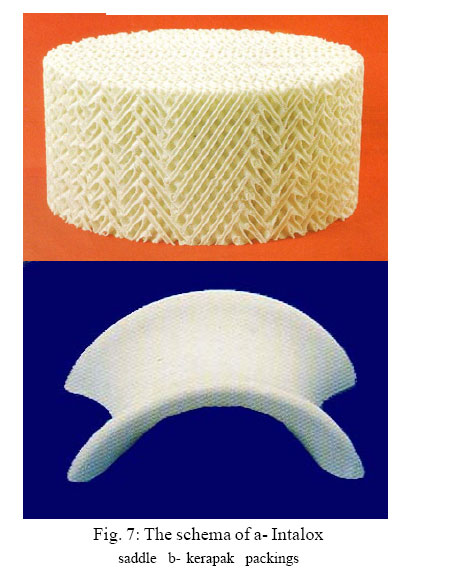
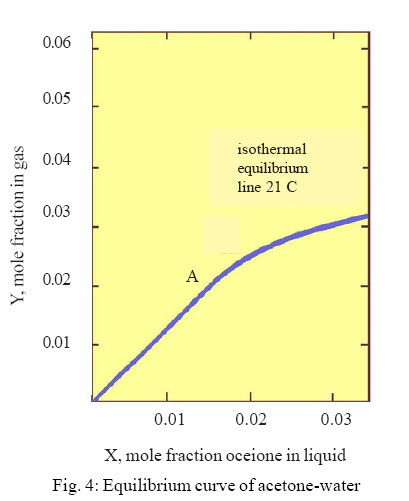
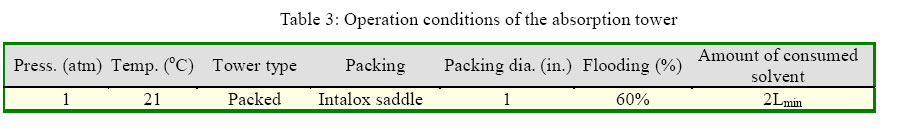
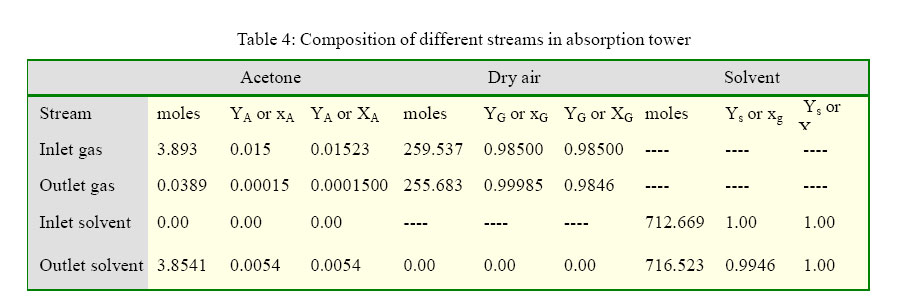
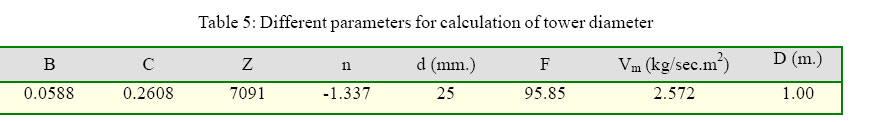
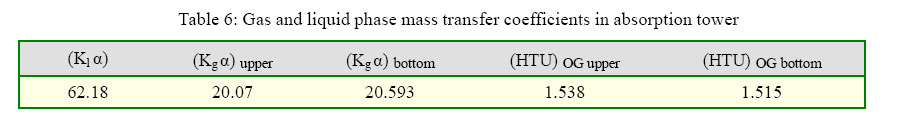
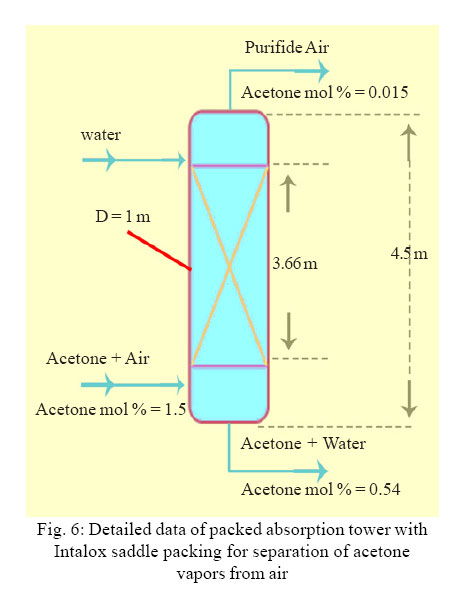
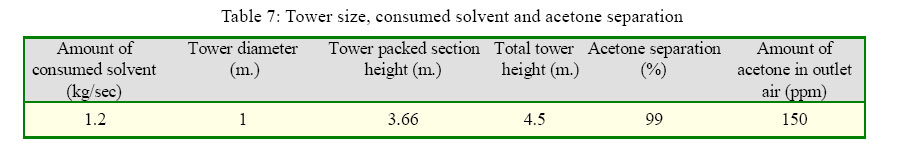
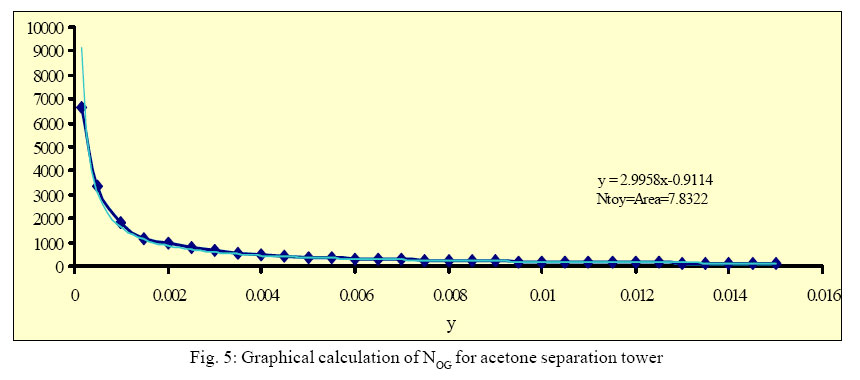
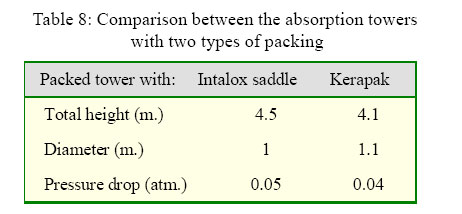
Numerical example: Packed tower design for separation of acetone vapors from air stream Acetone is an organic volatile compound, which uses in chemical industry widely. Due to its high vapor pressure, it can enter into air very easily. Acetone vapors can be separated can be separated from air by absorption process. In absorption process, water contacts with gas stream counter currently in a tower and absorb acetone vapors. The tower operates at 21°C and 1 atm. Fig. 3 presents a schema of this absorption tower with structural packing type. Table 2 shows the characteristic of inlet airflow stream. Packing is “Intalox saddle”type with 1 (in.) in diameter and of ceramic (Fig. 7). Table 2 presents the specifications of inlet streams. The Fig. 4 presents equilibrium curve of acetone water at 21°C. Equilibrium curve can be assumed as equilibrium line as (Wike and Stockar, 2003) : y = 1.4 x or Y = 1.4 X (44) Table 3 shows the column operation conditions. Results The compositions of different streams are presented in Table 4, Table 5 and 6 present the effective parameters for column diameter calculations and different mass transfer coefficients. The number of transfer units is calculated by graphical method which is presented in Fig. 6. The results of all of calculations are listed in Table 7 and Fig. 5. For considering of role of packing type in absorption tower efficiency for separation of acetone, another type of packing is applied. This packing which is named “kerapak”(as trade mark) and patented by Sulzer Company. In opposite of Intalox saddle, this packing is a structural type. Fig. 7 presents the schema of two types of packing. The absorption column mentioned above for acetone vapor separation is structured internally by this packing. The Table 8 presents the total results and compares pressure drop of air and size of tower for these two types of packing. Discussion and Conclusion The results in Table 7 and Fig. 5 showe that the tower with intaloxsaddle pcking can separate 99% of acetone inlet by water as solvent and then, air with minimum content of acetone vapors leaves the column. The result in Table 8 showe that kerapak packing gives less presuree drop and packet tower head in compariny with intaloxsaddle packing, but the column with intalox saddel has less diameter for the same efficiency. Packed absorption tower can separate volatile organic compounds (VOCs) in efficient manner. The efficiency of absorption process, mainly, depends on solvent type, composition of VOC in feed air, desired composition of VOC in outlet air (or percentage of VOC separation) and pressure drop. Numerical example shows that effect of type of packing on efficiency of packed absorption for separation of VOC is negligible in comparing with other parameters. In the cases which solvent is cheap, ratio of L/Lmin can be high which causes decreasing of height of absorption tower and consequently, reduction of fixed capital cost of plant and better maintenance and control. References
© 2005 Center for Environment and Energy Research and Studies (CEERS) The following images related to this document are available:Photo images[st05028f7.jpg] [st05028f1.jpg] [st05028t8.jpg] [st05028f3.jpg] [st05028f2.jpg] [st05028t5.jpg] [st05028t7.jpg] [st05028t6.jpg] [st05028t2.jpg] [st05028t4.jpg] [st05028t1.jpg] [st05028f5.jpg] [st05028f6.jpg] [st05028t3.jpg] [st05028f4.jpg] |
| |||||||||
