 |
| About Bioline | All Journals | Testimonials | Membership | News |
|
||||||
|
||||||
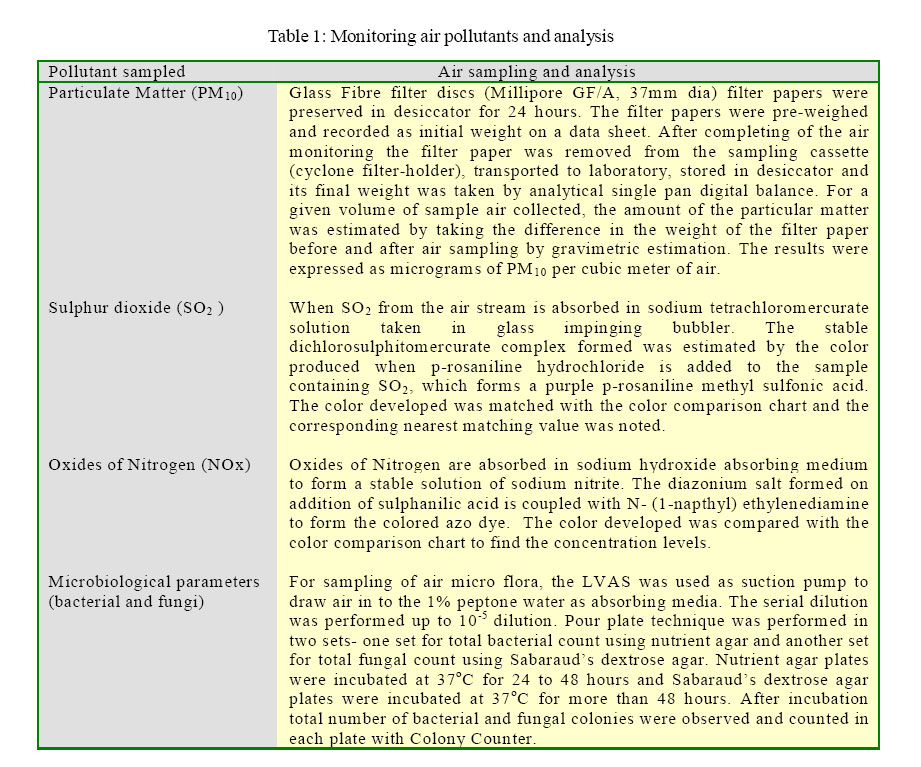
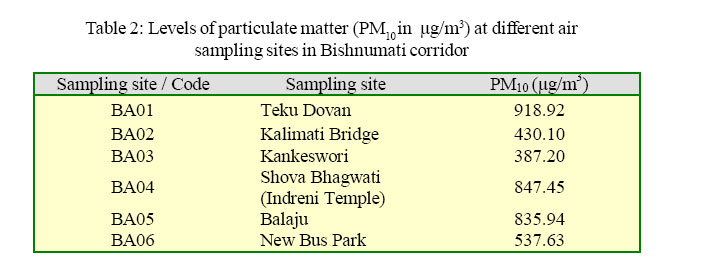
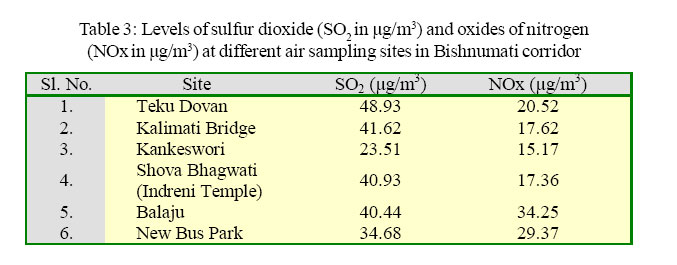
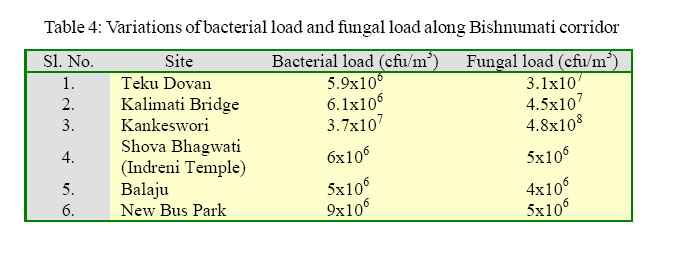
International Journal of Enviornmental Science and Technology, Vol. 2, No. 3, Autumn, 2005, pp. 217-222 Assessment of ambient air quality in Bishnumati corridor, Kathmandu metropolis K. Simkhada, *K. Murthy V and S. N. Khanal Department of Biological Sciences and Environmental Science, Kathmandu University, Dhulikhel, Kavre, Kathmandu, Nepal Received 7 May 2005; revised 7 June 2005; accepted 12 June 2005; onlined 30 September 2005 Code Number: st05029 AbstractThe Kathmandu valley urban area is growing as a metropolis. Bishnumati corridor in Kathmandu valley is is a target of increased pollution. The unabated solid waste land-filling on either side of the river-bank and animal slaughter houses and biological waste arising from these activities, busy commercial and high residential density characterize the corridor. Six areas, namely Teku Dovan, Kalimati Bridge, Kankeswori, ShovaBhagwati, Balaju and New Bus Park areas, all areas falling within the Bishnumati corridor were selected to measure air quality representing corridor. The pollutants quantified were respirable particulate matter – PM10, sulphur dioxide and oxides of nitrogen. The air-borne microbial flora and fungi load quantification were also carried out. Teku Dovan (918.92 µg/m3) and Shovabhagavati areas (847.45 µg/m3) showed higher levels of particulates. Kankeswori area showed highest levels of aerial bacterial (3.7x10⁷ cfu/m3) and fungal load (4.8x10⁸ cfu/m3). The PM10 levels at all the sites are substantial and fall in the categories of ‘Harmful’ and ‘Hazardous’ quality of air suggesting that the corridor needing intervention to minimize the risk from air pollution. Non-judicious open-air combustion of the solid waste contributes to air pollution. Heavy traffic and few roads not clad with asphalt; perceivable mal-odor and persistent stench emanating from the indiscriminate disposal and consequent putrefaction processes, dense population and increased commercial activities are other principal contributing sources to the resulting pollution of the corridor. In view of this status, mitigating measures to minimize exposure to the toxicants in the corridor is a necessity. Key words: Particulate Matter PM10, air quality, corridor, valley, microbial flora IntroductionUrbanization and industrialization have brought together large concentrations of people in small areas. Cities are the focus of many environmental problems, owing to density of energy use and occupation (Brimblecombe, 2001). In the past decade, Kathmandu has gone through rapid and haphazard urbanization. The urban centers of Kathmandu valley harbors huge encroachment of vehicles, establishment of industries and burning of biomass that contribute to its atmosphere. Concentrations of pollutants emitted build up to levels significant to cause adverse effects on plant, animal and human health. Pollution concentrations of urban centers of Kathmandu are reaching the point of potential serious consequences. Dust, smoke and various toxic gases have threatened our existence and well-being. So, it is important to monitor the quality of air around us before implementing preventing and controlling measures of air pollution. Ambient air quality monitoring: Air is ubiquitous. Urban focal points are contaminated with Particulate Matter (PM10) densities. The other pollutants present in the core city areas are oxides of sulfur and nitrogen and carbon monoxide. World Health Organization (WHO) and European Union (EU) have set ambient Air Quality Standards. Similarly there is National Ambient Air Quality Standards (NAAQS) for Nepal. Any pollutant exceeding this standard limit is considered harmful to human health and benign to ecosystem. Kathmandu valley and ambient air: The valley is especially vulnerable to air pollution since the bowl like topography of the valley restricts wind movement and retains the pollutants in its atmosphere. This is more prominent during winter when thermal inversion prevails (Regmi, 2003). The main problem of Katmandu’s ambient air is the high concentration of particulate matter. The Ministry of Population and Environment (MoPE) estimates that the PM10 emission from vehicles in Kathmandu has gone up by more than 5 times, from 570 tons per year to 3,259 tons per year, in the past ten years. The latest inventory states that vehicular emission contributes to 67 percent of the PM10 in Kathmandu valley. Particulates of smaller size and mass are persistent in the environment and exert health impact to exposed resident population in urban setting (Kinney, 2000). As is the case with many urban areas, Kathmandu city also has some vulnerable areas plagued with consistently higher concentration of pollutants, particularly particulate matter pollution. The objectives of the study were to quantify air pollutants - PM10, SO2, and NOx in Bishnumati Corridor; estimating pollutant levels with time and space and to quantify air borne microbes within the Bishnumati corridor of Kathmandu valley metropolis. Materials and MethodsThe site was Bishnumati corridor, is a stretch of approximately 6 km spanning north to the south direction of the Kathmandu Valley, extending from Gongabu Bridge near New Bus Park in the north to Teku Bridge in the south. The site was selected so that it can reflect the ambient air quality of the Bishnumati corridor (Pokhrel, 2004). Air sampling sites: There were altogether six air sampling stations selected in Bishnumati corridor, they were: Teku Dovan (BA01), Kalimati Bridge (BA02), Kankeswori (BA03), Shova Bhagwati, Indreni Temple (BA04), Balaju (BA05), New Bus Park, Gongabu (BA06). Teku Dovan (BA01): Bagmati River and Bishnumati River meet at Teku Dovan. The vicinity was full of dumped wastes producing nuisance and smell. There were very less number of vehicles as the bridge over the Bishnumati River is partially damaged, but the Bishnumati link road was seen quite busy with heavy trucks carrying solid wastes. The monitoring site was very close to the Bishnumati River and the monitoring equipment was kept above the bridge. Kalimati Bridge (BA02): Kalimati is one of the busiest urban centers of Kathmandu city. Large number of vehicles moves on the road. Vehicle encroachment and dust blowing from graveled road on the bank of Bishnumati River are chief sources of particulate matter, oxides of nitrogen and sulphur. Municipal sewers are the point sources of water pollution, bad smell and nuisance. The air monitoring equipment was kept on the roof of the public toilet and the collecting device of the sampler faced towards the bridge. Kankeswori (BA03): The site comprises slaughterhouses on the bank of Bishnumati River. People inhabiting there are of ethnic minority. The place is full of dumped animal wastes chiefly from slaughterhouses and animal carcasses. The place gives pungent smell due to unmanaged dumping of wastes. The monitoring equipment was kept on the roof of the public toilet and the head of the sampler was faced towards the graveled Bishnumati link road. Shova Bhagwati, Indreni Temple (BA04): There are three temples (Shova Bhagwati Temple, Indreni Temple and Vijeswori Temple) in this area. The monitoring equipment was kept on the roof of a shop in front of Indreni Temple, near the road. At this site, two roads, one from Vijeswori area and other is the Bishnumati Link Road meet together. The road from Vijeswori area is a busy road with many vehicles. The head of the sampler was faced towards the road. Balaju (BA05): The site is also one of the busiest areas of Kathmandu city with vehicular traffic. In addition to vehicle exhausts, Balaju Industrial District (BID) is also the source of air pollution in this area. The monitoring equipment was kept at about 25feet above the road and the head of the sampler was faced the road. New Bus Park, Gongabu(BA06): The site is the junction for vehicles coming in to the Kathmandu valley and going out of the valley. The road is busy for almost 24 hours. The monitoring equipment was kept on the roof of the guardhouse at the entrance of New Bus Park. The air monitoring and analysis: Low Volume air Sampler (LVAS), Model Pawan Tara (DevelopmentalAlternatives, 2002), a compact, portable, indoor-cum-outdoor air sampling equipment capable of sampling ambient air for continuous eight hours per battery charging was used. The equipment could sample simultaneously particulates as well as gaseous pollutants. The equipment was stationed at a height of 10 to 25 feet from the ground level during the sampling periods on various sites. In the present study, particulate matter with mean mass diameter of 10 micrometers (PM10), Sulphur dioxide (SO2) and Oxides of nitrogen (NOx) were monitored in the selected air sampling sites for a continuous average period of eight hours during the day time. The sampling airflow rate maintained was 1.5 liters per minute (LPM). The pollutants monitored and their sampling and analysis is briefly presented in the Table 1. Results The observed values of particulate matter noted according to the sampling sites of Bishnumati corridor is presented in Table 2. It can be noted that in Teku Dovan sampling site, maximal concentration of particulates has been observed (918.92 µg/m3, Table 2). This value is the average of two occasions sampling on two different days.Solid waste carrying attributes stench to the entire area evident with the observation here that a maximum level of sulfur dioxide (48.93 µg/m3) in the ambient environment of Teku Dovan area (Table 3). Shovabhagwati and Balaju air sampling sites of the corridor have been observed to be possessing substantial PM10 levels in the respective environments (847.45 µg/m3 at Shovabhagawati and 835.94 µg/m3 at Balaju, Table 2). The sulfur dioxide level was 40.93 µg/m3 (Table 3). The annual average prescribed level for SO2 is 50 µg/m3. The heavy vehicular traffic is the main attributable reason at Balaju area for observing the maximum level of oxides of nitrogen (34.25 µg/m3, Table 3). In fact this level was the highest when compared to the levels of NOx encountered in all other air sampling sites during the survey. The annual average level of NOx prescribed is 40 µg/m3. Even the level of SO2 noted at the Balaju is substantial 40.44 µg/m3, Table 3). The level of PM10 noted in the air-sampling site at the New Bus Park was (537.63 µg/m3, Table 2). The sampler was stationed on the roof of guardhouse situated at the entrance of Bus Park. The road is covered with asphalt and the frequency of passage of vehicles observed was high. The oxides of nitrogen level been noted to be second highest (29.37 µg/m3, Table 3) when compared with the other sampling sites included in the survey. The extent of stench was high here and the level of 41.62 µg/m3of SO2 (Table 3) air pollutant has been observed during the survey. The sampling was conducted by keeping the equipment on the (rooftop of public toilet and the collecting device was facing towards the bridge. Noteworthy finding at Kankeswori area was that of minimal level of particulate matter (387.20 µg/m3, Table 3) largely attributable for the overnight rain, which had a washing effect on the particulate concentration in this area. However, it can be noted that when there was no rain in this particular sampling site, the PM10 concentration was maximal (606.06 µg/m3 while particulate matter, Table 2) with 39.09 µg/m3 of SO2 (Table 3). This substantiates that while rain has a positive effect in bringing down the particulate concentration, on the majority number of days when there is less or no rain the area is characterized by high level of index air pollutants. Higher bacterial and fungal load was noted in this area; the microbial bacterial load of 3.7x10⁷ cfu/m3 and fungal load of 4.8x10⁸ cfu/m3 (Table 4) were observed. Discussion and ConclusionThe national ambient air quality standards prescribe levels of PM10 for a monitoring duration of 24 hours. However, in the present study, since the sampling was done on an average period of 8 hours to have an idea of pollutant levels, the levels have been compared to the prescribed standards with a premise that most of the pollution exist during the day time. The major air pollutants when measured at the six different locations along the Bishnumati corridor and analyzed revealed that the PM10 is a major problem. The respiratory health and the daily particulate matter concentration are positively correlated (Pope, 1991). Concentrations of Particulate Matter however vary at different locations and seasonally (Murthy, 2004). Other gaseous pollutants are SO2 and NOx. Similarly, bacterial loads and fungal loads were also measured in six different sampling sites. Bacterial load and fungal load vary according to the nature of location and season. Concentrations of air micro flora also vary at different locations depending on the sanitations and waste management of the area. At present, Teku Dovan area is actually a landfill site under Kathmandu Metropolitan City Office for solid wastes and the area is characterized by road with out asphalt. There are two venial roads in the area (Bishnumati Link Road and Bagmati Link Road). The bridge near the Dovan is partially damaged. The particulate concentration in the atmosphere around the bridge has been observed to be substantial. Another characteristic feature observed in this area was that the nature of vehicles traversing in the available two link roads was heavy trucks carrying solid waste collected from different parts of city areas. A similar finding has been reported in the city of Bangalore where the main cause of particulate pollution has been attributed to surge in vehicular traffic (Murthy et al., 1987). Actual sampling site at Shovabhagawati was on a rooftop of a shop near the road in the vicinity of Indreni Temple. The sampling site was on a junction of two roads, one coming from Vijeswori area and the Bishnumati Link Road. The three temples of the area are quite famous of Kathmandu valley and are frequented by devotees and visitors. During the air sampling for particulates in this area, the cremation by burning the bodies was observed. In fact this is a common religious practice carried out in this area. As regards to the nature of Balaju air sampling site, it is relevant to mention that the area is characterized by many variety of vehicles moving across the road and the area is one of the busiest in Kathmandu city. Besides possessing many industries, Balaju Industrial District is a known source of pollution in the area. Actual air monitoring equipment was stationed about 25 ft above the ground level facing the road. The Kalimati area, although is one of the busiest urban center of Kathmandu city, has asphalted road linkages. Vehicular traffic is considerable and open sewerage was the characteristic polluting source of the area. The Kankeswori air-sampling site of Bishnumati corridor was unique in the sense that the area was characterized by the number of animal slaughterhouses situated on the bank of Bishnumati River. The entire area had dumps of animal carcasses, animal wastes resulting in offensive smell emanating from putrefaction of biological materials. The air sampling monitoring equipment was stationed on the roof of public toilet. An attempt to quantify the ambient air bacterial and fungal concentrations in all the air sampling sites in Bishnumati corridor is presented in Table 4. The main intention of quantification of microbial flora was driven by the fact that an extensive area of the corridor was used for disposing the solid wastes along the course of Bishnumati River. The solid waste was a complex mixture of the entire range of waste materials from simple paper wastes to complex medical wastes. Besides these facts, one of the areas named Kankeswori area (BA03) was characteristic in having animal slaughterhouses. Animal hide and skin-along with the organic wastes material, tissues and other related biological refuge were being just thrown in open space and was getting mixed with the solid waste complex collected by Municipality and finally land filled in the area. This practice along with the humidity and pressure appear to enhance the rate of putrefaction. Obviously, there was perceivable and consistent stench prevalent in the vast areas of Kankeswori site. A similar study, oriented towards the density of traffic and the density of microbial flora in the ambient environment id reported (Ghimire, 2003). It can be observed in the present study that the bacterial load among the air sampling sites monitored in the corridor ranges between 5x 10⁶ cfu/m3 and 3.7x 10⁷ cfu/m3 noted at Balaju and Kankeswori sampling sites respectively. It can be inferred that in almost all the sampling sites, the bacterial load delineated is homogenous (106 cfu/m3) and in Kankeswori, however, the bacterial concentration observed was maximal. The study by Ghimire et al., 2003, presents the bacterial load in air samples observed in few rural areas such as Nagarkot and Baluwa as 4.13x 10⁴ cfu/m3 and 5.2 x 10⁴ cfu/m3 respectively. These values could be considered as reference values since both of these areas are rather free from pollution. When compared to these reference values, the variation of the bacterial load in Bishnumati corridor was conclusively higher. The variations observed in the fungal load suggest again the similar trend. A minimal air-fungal concentration was noted at Balaju (4x 10⁶ cfu/m3) and maximum fungal load was observed in the Kankeswori area (4.8x 10⁸ cfu/m3). This suggests that organic content in the solid wastes is a principal source for microorganisms and fungi in ambient air.Suggestions: on the basis of findings of the study, the suggestions are made: the local inhabitants, shopkeepers, pedestrians including the school children are at the health risk from ambient dust. Asphalting of the unpaved roads largely prevent re-suspension of particulates and will reduce the ambient particulate concentration. The areas with unmanaged waste dumping, unhygienic slaughter houses have high chances of air-borne diseases and hence public sanitation and hygiene measures of these areas must be addressed to save from potential air-borne epidemics. AcknowledgementsSincere thanks to M/s. World Vision International for supporting this work. The help and laboratory support extended by Ms. Sangeeta Shakya in the analysis of microorganisms in air samples is gratefully acknowledged. Grateful thanks to Vice Chancellor, Dean School of Science and staff members of Department of Biological Sciences and Environmental Science of Kathmandu University for their co-operation to carry out this survey. References
© 2005 Center for Environment and Energy Research and Studies (CEERS) The following images related to this document are available:Photo images[st05029t4.jpg] [st05029t3.jpg] [st05029t2.jpg] [st05029t1.jpg] |
| |||||||||
