 |
| About Bioline | All Journals | Testimonials | Membership | News |
|
||||||
|
||||||
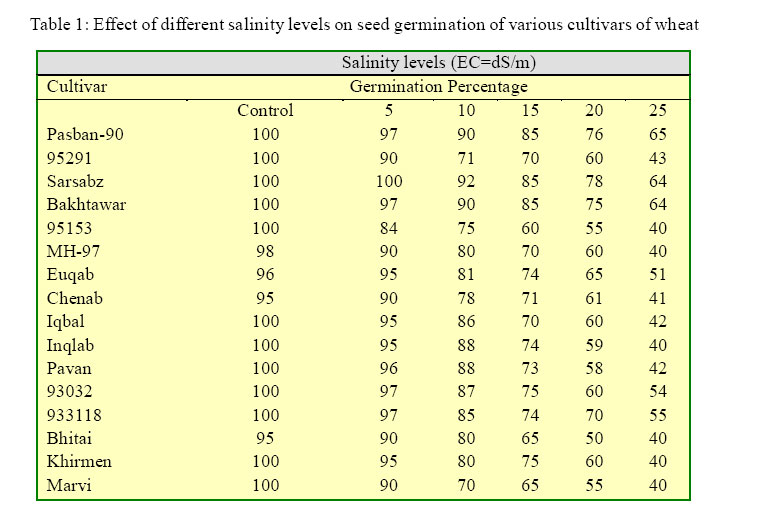
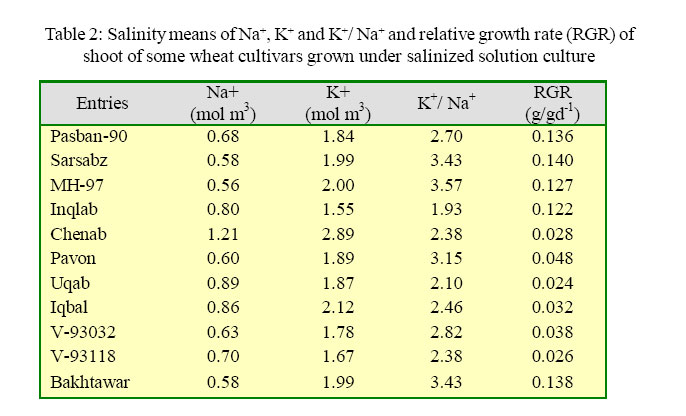
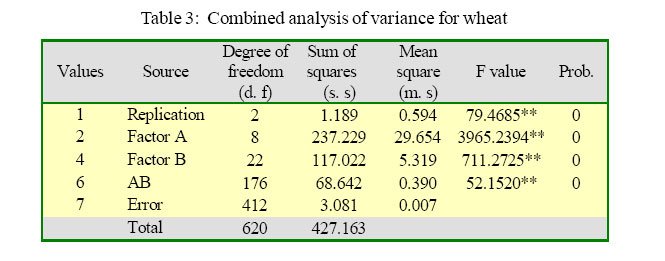
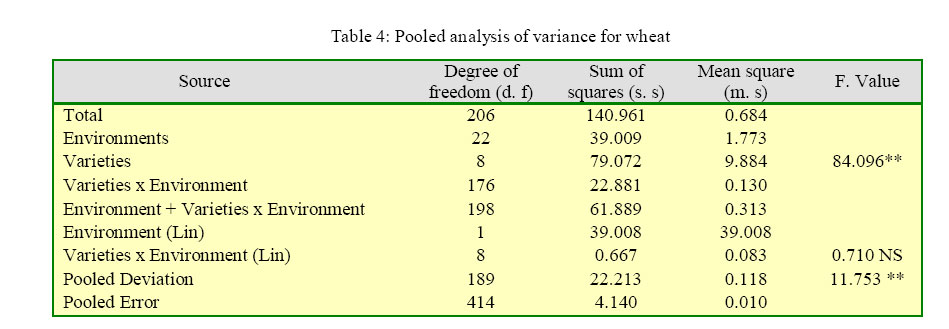
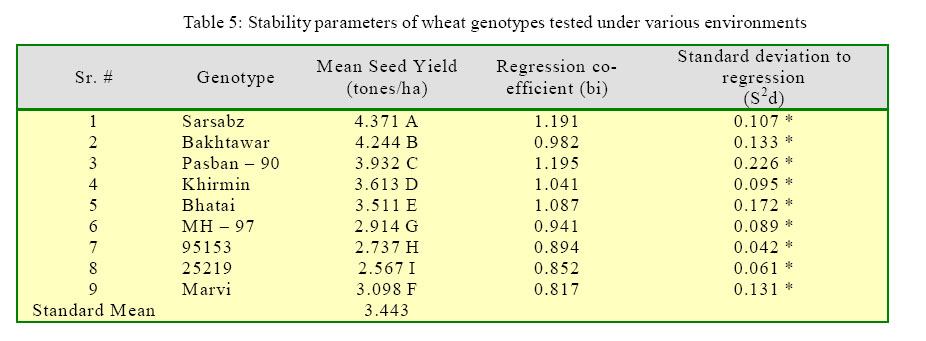
International Journal of Enviornmental Science and Technology, Vol. 2, No. 3, Autumn, 2005, pp. 223-228 Genotypic and environmental interaction in advanced lines of wheat under salt-affected soils environment of Punjab *Y. Ali, Z. Aslam, G. Sarwar and F. Hussain Nuclear institute for Agriculture and Biology P. O. Box 128, Jhang Road, Faisalabad, Pakistan Received 17 August 2005; revised 1 September 2005; accepted 12 September 2005; onlined 30 September 2005 Code Number: st05030 Abstract Wheat cultivars of diverse origin including approved varieties of different provinces of Pakistan i.e. Punjab, NWFP and Sindh were tested against different salinity levels in laboratory as well as in naturally saline fields in different ecological zones. Initially, 16 genotypes were studied for germination test at 6 different salinity levels ranging from 0-25 dS/m (2, 5, 10, 15, 20, 25, EC= dS/m). Then, out of 16 cultivars, 11 were studied for the relative growth rate at different levels of salinity and after their study in the laboratory, 9 genotypes were selected for testing in the naturally saline areas of Punjab province. Under germination percentage study, the varieties viz. Pasban-90, Sarsabz, Bakhtawar, 93032 and 933118 were less affected than other varieties. As regards the relative plant growth, varieties viz. Sarsabz, Bakhtawar, and Pasban-90 were tolerant to salinity at seedling stage while Inqlab was graded as sensitive to salt stress. Regarding field performance, significant differences were observed in the varieties grown under different saline environments and varieties x environment interaction. Varieties x environment (Lin) interaction was non significant while nonlinear interaction (pooled deviation) was significant. Based on overall yield performance, the Sarsabz variety produced the highest seed yield (4.37 T/ha) followed by Bakhtawar (4.24 T/ha) and Pasban-90 (3.93 T/ha). Regression coefficient values showed non significant differences to unity while standard deviation to regression showed significant differences to zero. These results indicated that the genotypes viz. Sarsabaz, Bakhtawar and Pasban-90 are better tolerant to saline environment as compared to others. The two genotypes, Marvi and 25219 had low regression values and can fit under stress environment. Key words: Environmental interaction, salt-affected, wheat, Punjab Introduction Wheat (Triticum aestivum L.) is the staple food for a large part of the world population including Pakistan. In this country, it is grown on 8.141 million hectares with an average yield of 2.28 tones/ha with total production of 18535 thousand tonnes (Economic Survey of Pakistan, 2003). This is far below than that of most of the countries of the world like Germany (7.9 tones/ha), France (6.6 tones/ha) and Egypt (6.4 tones/ha) (Agri. Statis. of Pak., 2002). The production of wheat can be increased either by bringing more area under cultivation or by increasing per hectare yield. Currently, it is nearly impossible to increase area under wheat crop due to other competing crops, restricted supply of irrigation water etc. Therefore, the only alternative left is to increase it’s per hectare yield by better crop management techniques and introducing high yielding varieties along with resistance against biotic and abiotic stresses. Saline soils are widely distributed in arid, semi-arid and in dry coastal areas including Pakistan. The yield is hampered to a greater extent when the underground water is not altogether suitable for irrigation or is brackish. Out of 20.2 million hectares of cultivated land in Pakistan, 6.8 million hectares are affected with salinity. Out of this, the affected area in Punjab province is 2.67 million hectares. The salinity area has been categorized into four major classes namely very severe saline lands (652 thousands hectares), severely saline (738.3 thousands hectares), moderately saline (804.8 thousands hectares) and slightly saline area (472.4 thousands hectares). (Agri. Statis. of Pakistan, 2002). Pakistan is seriously facing water scarcity problem both for irrigation and drinking. Moreover, almost 70% of the groundwater available contains moderate to high concentration of salts. The condition is alarming as it has created a situation of crises in the country. Reclamation, drainage and water management can minimize the extent and spread of saline soils, however engineering and management costs are high. Therefore, new strategies to cope with salinity problem are essential. One example of new strategy is breeding crops for increased salt tolerance. It is possible to improve the genetic tolerance of wheat crop to salinity and thereby increase the productivity of marginal lands. Efforts to breed for salinity tolerance are slow due to limited knowledge of genetics of tolerance, inadequate screening techniques, low selection efficiency and poor understanding of salinity and environmental interaction. It is now well established that some plant species can tolerate high salinity (Glenn, et al., 1996. Rehman, et al.,1998). Significant differences in their character effectiveness have also been reported among varieties of different species including wheat (Akhtar, et al., 1994, 1998. Saqib, et al., 1999) and cotton (Qadir and Shams, 1997,Ashrafand Ahmad, 2000).The differential behavior of plant species may be helpful for exploitation of these soils by growing fairly tolerant genotypes. This paper reports the results of different studies pertaing to seed germination in Petri dishes, solution culture, and ion uptake behavior and field performance of nine wheat genotypes in different ecological zones of the Punjab province under natural saline field condition. These studies would help identify genotypes with high yield along with their better adaptivity in different saline environments. Materials and Methods Germination test Seed germination of wheat cultivars viz. Pasban -90, 95291, Sarsabz, Bakhtawar, 95153, MH-97, Euqab, Chenab, Iqbal, Inqlab, Pavan, 93032, 933118, Bhattai, Khirmen and Marvi (Table-1) was tested in Petri-dishes, having six salinity levels (EC=0, 5, 10, 15, 20 and 25 dSm-1). Salinity levels were prepared by the addition of Na2SO4, CaCl2, MgCl2, and NaCl in the ratio of 10: 5: 1: 4 (on equivalent basis) to Hoagland nutrient solution (Qureshi, et al., 1977). Ten seeds of each cultivar (in 3 replicates) were placed in Petri dishes lined with filter paper well soaked with respective treatment solution. Petri dishes were covered by a black cloth to avoid light. Percentage of seed germination was recorded daily after initiation of germination over a period of ten days. A seed was considered germinated when both radical and plumule had emerged. Plant growth Pre-germinated seeds of wheat were planted in pots containing thoroughly acid washed quartz gravel (5-25 mm. dia) filled in plastic buckets. Ten plants were transplanted in each pot with 10% Hoagland nutrient solution. Strength of the nutrient solution was raised up to 50% for 1-2 days for establishment of plants. Salinity was raised up to 10 EC dS/m with stepwise increase of EC=5 dS/mday-1.The experiments were conducted in RCB design with four replicates. The nutrient and salt solutions were circulated twice daily and changed after one-week interval. After 2-3 days when healing of plant roots was accomplished, first harvesting was done. Second harvest was taken after 14 days interval of first harvest. Three plants in each harvest were taken and after washing in distilled water were dried with tissue paper. Fresh weight of both roots and shoots were recorded. The material was dried at 70 °C for 72 hours in forced air oven. The relative growth rate (RGR) was calculated by the formula: RGR = 1/W x δw/δt g/gday-1 W = Where dry weight of shoot of the initial harvest δw = Dry weight of shoot at final harvest – dry weight of shoot at initial harvest The dried plant material was ground and digested in concentrated HNO3 (Aslam, 1985 and Rashid, 1986). The digest was subjected to flame photometer to determine the concentration of various cations, (Na+, K+, Ca++, Mg++) (Lauchli and Wieneke 1979). Field performance Wheat cultivars were tested in the natural saline fields of district Faisalabad, Toba Tek Singh and Jhang at twenty three different locations during three consecutive years, 2001-2003. Nine cultivars of wheat viz. Sarsabz, Bakhtawar, Pasban-90, Khirmin, Bhatai, MH-97, 95153, 25219 and Marvi were sown in RCB design in four replications. Soil samples were collected from 0-15 and 15-30 cm depth before sowing of crop. The physiochemical analysis of 015 cm soil was (pH = 8.37, EC= 4.19 dS/m and SAR = 26.24) whereas 15-30 cm. soil had pH = 9.32, EC =16.6 dS/m, SAR = 49.88. At maturity, grain yield was recorded and subjected to analysis of variances (Steel and Torrie 1980) and stability parameters following Eberhart and Russell model (1966). Results Effect of salinity on seed germination Seed germination was little affected up to salinity level of EC 10 dS/m. But, thereafter, it progressively decreased. However, the germination was always 40 percent or higher in all the cultivars even at salinity levels of 25 dS/m. The cultivars in general, did not differ much among themselves at each salinity level. The only notable exceptions were Pasban-90, Sarsabz, Bakhtawar, 93032 and 933118. Seed germination in these cultivars were less affected than other varieties at various levels and it was 65, 64, 55 and 54 percent even at EC=25 dS/m. In contrast, all other cultivars had 40 percent seed germination at EC=25 dS/m (Table 1). Singh, et al. (2000) studied 20 wheat genotypes having EC=2.8 and 20.8 dS/m along with control. The germination percentage declined under salinity stress. The genotypes Raj-3077 and Kharchia-65 were most tolerant to salinity while Raj-4530 Raj3934 was most susceptible genotypes. Effect of salinity on plant growth The typical mechanism of salinity tolerance in wheat is the Na+ exclusion or uptake reduction and increased absorption of K+ to maintain a good Na+, K+ balance in the shoot. The mean performance for salinity rating, Na+, K+ and K+/ Na+ in the shoots of wheat cultivars is presented in table-2. These data demonstrated that the K+/ Na+ which is the balance between Na+ and K+ in the shoot is a valid criterion in measuring salinity tolerance in wheat. If K+/ Na+ are narrow then the variety is tolerant and if K+/ Na+ is wide then it is called sensitive. It has been advocated that plants having higher tolerance to salinity generally maintain higher K+/ Na+ in their tissues (Gorham et al. 1985). It is clear from the data that variety Sarsabz had the highest relative growth rate i.e. 0.140 g/gday-1 followed by Bakhtawar and Pasban-90 which gave 0.138 and 0.136 RGR, respectively. The lowest RGR was noticed in Uqab 0.024g/gday-1. When plants are grown under saline conditions, as soon as the new cell start its elongation process, the excess of salts modifies the metabolic activities of the cell wall causing the deposition of various materials which limit the cell wall elasticity. Secondary cell wall appears sooner, cell walls become rigid and consequently the turgor pressure efficiency in cell enlargement is decreased (Acesves, et al., 1975). The other expected causes of this reduction could be the shrinkage of the cell contents, reduced development and differentiation of tissues, unbalanced nutrition, damage of membrane and disturbed avoidance mechanism (Kent and Lauchli, 1985). Salinity also decreased the shoot fresh and dry weight of all the genotypes significantly when compared to control. High sodium and chloride concentration in the rooting medium could have suppressed the uptake of K+,Ca++ and NO3 and ultimately the growth (Gorham and Wyn Johens, 1993). The reduction and the shoot dry weight under saline conditions were also due to reduced growth as a result of decreased water uptake, toxicity of sodium and chloride in the shoot cell as well as reduced photosynthesis (Brugnoli and Lauter, 1991). The mean performance for salinity rating K+, Na+ and K+/ Na+ in shoot of wheat showed that variety Sarsabz, Bakhtawar and Pasban-90 are tolerant to salinity at seedling stage and gave K+/ Na+ (3.43) while the lowest K+/ Na+ was observed in variety Inqlab (1.93) and was graded as sensitive to salt stress. Field Screening of Wheat Cultivars for Salt Tolerance Grain yield performances at different locations Combined analysis of variance (Table 3) indicated that varieties and environments showed highly significant differences. The significant differences in varieties may be due to the variations in their genetic make up that forced the varieties to exhibits different behaviour in different environments. The varieties x environment interaction also showed highly significant differences which were an indication that the data can be further processed for stability analysis. Pooled analysis of variance in which the variance was partitioned into linear and non linear also indicated highly significant differences in varieties (Table 4). Varieties x Env. (Lin) was non significant but non linear (pooled deviation) showed highly significant differences. The genotype x environment interaction (G x V) may be of cross over or non cross nature depending upon the mean performance of the genotypes over different environments. A non cross over G x E interaction is that in which case the ranking of genotypes remains constant across environments and the interaction is significant because of changes in the magnitude of response (Baker, 1988, Matus, et al., 1997) or a cross over G x E interaction, in which a significant change in rank occurs from one environment to another (Matus, et al., 1997). The genotypes differed significantly in their mean seed yield performance. Overall, Sarsabz produced the highest seed yield (4.37 t/ha) followed by Bakhtawar (4.24 T/ha) and Pasban –90 (3.93 T/ha). At 12 locations, Sarsabz ranked first position while 2nd. at 4 locations and 3rd. at 7 locations. Barkhtawar achieved 2nd. and 3rd. position at most of the locations. So, overall the G x E interaction in this study was of cross over nature. Varieties, Pasban, Khirmin, and Bhatai also produced high grain yield, respectively. (Table 5) Discussion and Conclusion It is well known effect that regression coefficient (bi) should be a parameter of response and deviation to regression as a parameter of stability along with above average seed yield. Accordingly regression value near 1.00 indicates less response to environmental changes, and hence showing more adaptiveness. Thus, a genotype with unit regression coefficient (bi=1) and deviation not significantly different form zero (s2d=0) is said to be the most stable genotype. The results of wheat genotype at different salt-affected ecological zones studied under this research work indicated that none of them fit optimum standard of stability in respect of standard deviation to regression coefficient however, based on average grain yield and regression coefficient genotype Sarsabz, Bakhtawar and Pasban-90 were better as compared to other genotypes under study. Two genotypes, Sarsabz and Pasban-90 had regression coefficient values more than unity hence more responsive to rich environment therefore, may be recommended only for highly favourable environment or suitable for rich environment and the genotypes, Marvi and 5219 for poor environment. Based on high seed yield and stable performance of Sarsabz, Bakhtawar and Pasban in different saline environment, it may be concluded that by promoting the cultivation of these genotypes in saline areas, such as studied here, the yield of wheat can be enhanced and ultimately it will be helpful to improve the economic position of the growers of those areas. References
© 2005 Center for Environment and Energy Research and Studies (CEERS) The following images related to this document are available:Photo images[st05030t4.jpg] [st05030t3.jpg] [st05030t5.jpg] [st05030t2.jpg] [st05030t1.jpg] |
| |||||||||
