 |
| About Bioline | All Journals | Testimonials | Membership | News |
|
||||||
|
||||||
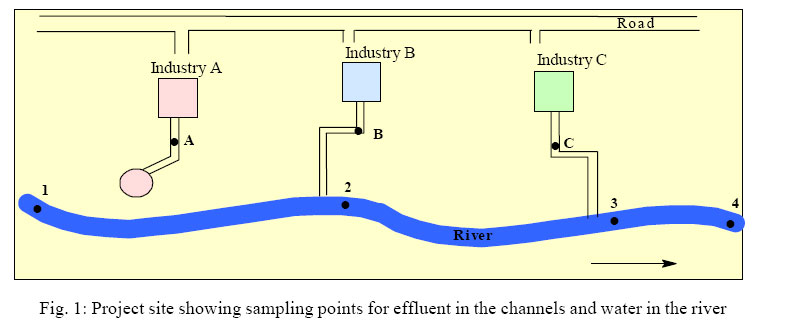
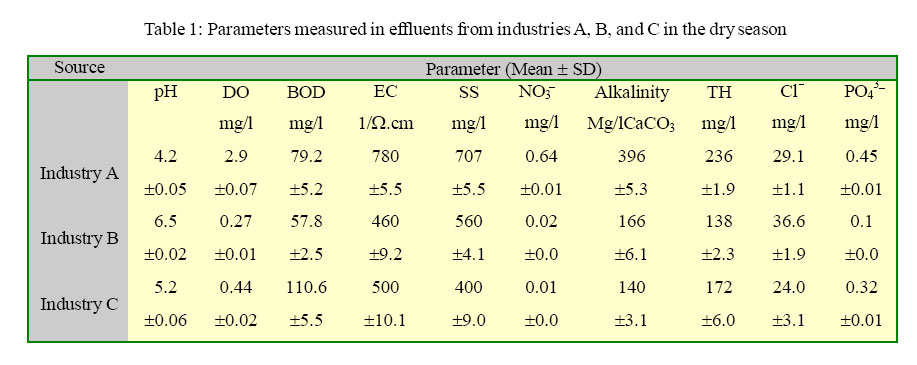
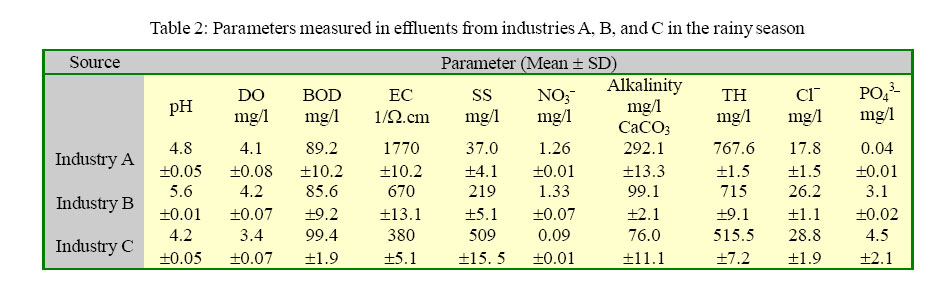
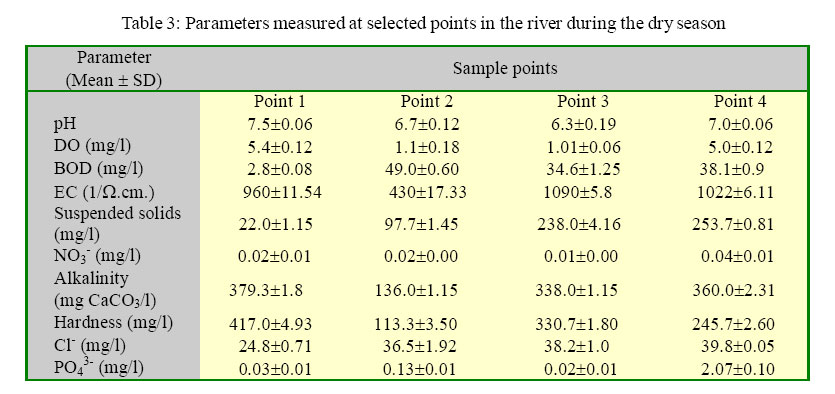
International Journal of Enviornmental Science and Technology, Vol. 2, No. 3, Autumn, 2005, pp. 237-244 Assessment of the impact of industrial effluents on water quality of receiving rivers in urban areas of Malawi O. Phiri, *P. Mumba, B. H. Z. Moyo and W. Kadewa University of Malawi, Bunda College of Agriculture, Lilongwe, Malawi Received 30 June 2005; revised 19 July, 2005; accepted 2 August 2005; onlined 30 September 2005 Code Number: st05033 Abstract A study was carried out in Malawi to assess the extent of chemical pollution in a receiving river as affected by industrial effluents. Both the effluents and the water at selected points in the river were analysed for pH, dissolved oxygen, biochemical oxygen demand, electrical conductivity, suspended solids, nitrate, alkalinity, hardness, chloride and phosphate in the dry and rainy seasons. The results showed that the effluents were acidic in both the dry season (range: 4.2 ± 0.02–6.5 ± 0.02) and in the rainy season (range:4.2 ± 0.05 – 5.6 ± 0.01). While the levels of dissolved oxygen, biological oxygen demand, electrical conductivity, suspended solids, alkalinity and chloride were relatively high in the dry and rainy seasons, the concentration of phosphate and nitrate were low in both seasons. The water upstream was neutral (average pH, 7.40 ± 0.04) with high dissolved oxygen but low in the levels of the other parameters in both seasons. The water after the effluent receiving points was acidic and the levels of the other parameters were high, especially downstream. The results suggested that the water in the river was polluted and not good for human consumption. It is therefore recommended that the careless disposal of the wastes should be discouraged and although the values in some cases were lower than the allowable limits, the continued discharge of the effluents in the river may result in severe accumulation of the contaminants and, unless the authorities implement the laws governing the disposal of wastes, this may affect the lives of the people. Key words: Industrial effluents, river water, pollution, water quality Introduction Water is essential to all forms of life and makes up 50-97% of the weight of all plants and animals and about 70% of human body (Buchholz, 1998). Water is also a vital resource for agriculture, manufacturing, transportation and many other human activities. Despite its importance, water is the most poorly managed resource in the world (Fakayode, 2005). Ground and surface waters can be contaminated by several sources. In farming areas, the routine application of agricultural fertilizers is the major source (Altman and Parizek, 1995; Emongor et al., 2005). In urban areas, the careless disposal of industrial effluents and other wastes may contribute greatly to the poor quality of the water (Chindah et al., 2004; Emongor et al., 2005; Furtado et al., 1998 and Ugochukwu, 2004). A study on the impact of industrial effluent on water quality of a river carried out in Nigeria (Fakayode, 2005) showed that the chemical parameters studied were above the allowable limits and also tended to accumulate downstream. The increasing demand on water arising from fast growth of industries has put pressure on limited water resources. While most people in urban cities of the developing countries have access to piped water, several others still rely on borehole and river water for domestic use. Most of the rivers in the urban areas of the developing world are the end points of effluents discharged from the industries. Industrial effluents, if not treated and properly controlled can also pollute ground water (Olayinka, 2004; SARDC, 2005). Therefore, both bole holes and rivers generally have poor quality water in the affected areas. Since people use untreated waters from these sources, the result is continuous outbreaks of diseases such as cholera, bilharzia, diarrhoea and others. Malawi, like other African countries, is experiencing rapid industrial growth and this is making environmental conservation a difficult task (Kadongola, 1997). Although the government has put in place policies for effective environmental conservation and natural resources management, lack of political will is impeding their implementation. This is also compounded by the fact that the industrial sector shifts the responsibility of pollution prevention to the government alone and this makes it difficult to prevent pollution. As a result, there is unsustainable and wasteful utilization of resources which give rise to dwindling wild life; more land degradation and increasing generation and indiscriminate disposal of commercial, industrial and domestic wastes. In the capital city of Malawi, there is a big river that runs through an industrial site and empties into Lake Malawi, approximately 120 km. away. The effluents from some industries are discharged into this river. People who live near the area use the water from the river for domestic purposes. Unfortunately, there is no information on the quality of the effluent discharged into this river and also on the quality of the water in the river for human use. Such information is important for the authorities to take proper action in preventing pollution of the environment for the good health of the population. The objective of this study was therefore to assess the extent of chemical pollution in receiving rivers as affected by industrial effluents discharged therein. Materials and Methods Study area The study was conducted in the effluent channels from three industries and in a receiving river that runs through an industrial area in the capital city of Malawi. The layout of the area and the sample collection points are shown in Fig. 1. The major industries discharging effluents into the river are the opaque soft drink manufacturing company (Industry A), a textile company (Industry B) and opaque beer brewing company (Industry C). Industry A has a waste disposal site that is close to the river. Samples and sampling Samples of effluents were collected in duplicate in the morning and afternoon from points A, B and C in the channels, leading to the river, for five days. Water samples in the river were collected in duplicate in the morning and afternoon from four sampling places 1, 2, 3 and 4. Sample point 1 was 1 km. upstream of point 2; point 4 was 1km downstream of point 3 and points 2 and 3 were half a kilometre apart. All samples were placed into thoroughly cleaned 1liter polyethylene bottles and tightly closed. Each bottle was rinsed with the appropriate sample before the final sample collection. The samples were placed in a cooler box and then taken to the laboratory for analysis. Sampling was carried out in the dry and rainy seasons. Chemical analysis pH: The pH was measured directly either in the effluent channel or in the river using a pH meter. Electrical conductivity (EC): This was measured directly either in the effluent channels or the river using a conductivity meter. Dissolved oxygen (DO): This was measured directly in the effluent channels or the river using a DO meter. Biochemical oxygen demand (BOD): This was determined by conventional methods (AOAC, 2002). A sample of the solution (50 ml.) was placed into a 500 ml BOD bottle and filled to the mark with previously prepared dilution water.A blank solution of the dilution water was similarly prepared and placed in two BOD bottles.A control solution without dilution water was also prepared and placed in a BOD bottle. The bottles were stoppered, sealed and incubated for five days at room temperature. BOD was calculated from the relation: BOD = (D1-D2)/P, where D1= dissolved oxygen 15 minutes after preparation, D2= dissolved oxygen in diluted sample after incubation and P = amount of sample used. Phosphate (PO43-): To a 50 ml. sample was added 8ml. of combined reagent (a mixture of solutions of sulphuric acid, potassium antimony tartrate, ammonium molybdate and ascorbic acid), mixed and left to stand for 10 minutes. The absorbance of the solution was then measured at 880 nm. (AOAC, 2002) and the concentration of phosphate obtained from a calibration curve. Nitrate (NO3-): This was determined by calorimetric methods (AOAC, 2002). To a 10 ml. sample in a sample tube was added sulphuric acid (13 N, 10 ml.). The tube was placed in a water bath at 10 oC for 3 minutes after which brucine reagent (0.5 ml.) was added. The tube was then placed in boiling water bath for 25 minutes and then cooled. The absorbance of the sample was read at 410 nm. using a calorimeter and the concentration of nitrate obtained from a calibration curve. Hardness (TH): This was obtained by titrimetric methods (AOAC, 2002). 25 ml. sample was diluted with distilled water after which, 2 drops of buffer solution (pH 10), sodium cyanide (250 g.) and indicator powder (200 g.) were added. The solution was then titrated with 0.01M EDTA to a blue endpoint. The hardness was obtained as mg CaCO3/l. Suspended solids (SS): A sample (200 ml.) was left to stand for 20 minutes after which it was poured into a previously weighed platinum dish and evaporated to dryness. Chloride (Cl-): This anion was determined by titration of the sample with silver nitrate. To 100 ml. sample was added potassium chromate (5%, 1 ml.) and titrated with 0.1 M. silver nitrate solution to the first appearance of a buff color (AOAC, 2002). Alkalinity: This was obtained by titrating 50 ml of sample with HCl (0.1M). Data analysis Data was analysed using Statistical Package for Social Sciences (SPSS). The paired t-test was used to compare the means as well as the seasonal differences in effluent quality and also the water quality of the water in the river. Results Table 1 shows the concentrations of the parameters obtained in the effluent from the three different industries sampled in the dry season and Table 2 shows the concentrations of the same parameters obtained in the rainy season. In the dry season, the pH was 4.2±0.05 in the effluent from industry A, 6.5±0.02 in the effluent from industry B, and 5.2±0.06 in the effluent from industry C. In the rainy season, the pH values were 4.2±0.05 in the effluent from industry C, 4.8±0.05 in the effluent from industry A and 5.6±0.01 in the effluent from industry B. The dissolved oxygen (DO) levels in the rainy season ranged from 3.4±0.07 mg/l. in the effluent from industry C to 4.2±0.07 mg/l. in the effluent from industry B. In the dry season the values were 0.27±0.01 mg/l. in the effluent from industry B, 0.44±0.02 mg/l. in the effluent from industry C and 2.9±0.07 mg/l. in the effluent from industry A. The levels of biochemical oxygen demand (BOD) in the dry season were 57.8 ±2.5 mg/l. in the effluent from industry B, 79.2±5.2 mg/l. in the effluent from industry A and 110.6±5.5 mg/l. in the effluent from industry C. In the rainy season, the highest amount of BOD was in the effluent from industry C (99.4±1.9 mg/l.) and the least was in the effluent from industry B (85.6±9.2 mg/l). The electrical conductivity (EC) in the rainy season was 380.0±5.1/ Ω.cm in the effluent from industry C, 670±13.1 1/Ω.cm in the effluent from industry B and 1770.0±10.2 Ω.cm in the effluent from industry A. In the dry season, the values were 460 ± 9.2 1/ Ω.cm in the effluent from industry B, 500±10.1 1/ Ω.cm in the effluent from industry C and 780±5.5 1/Ω.cm in the effluent from industry A. The suspended solids (SS) were 37.0±4.1mg/l in the effluent from industry A, 219± 5.1mg/l in the effluent from industry B and 509±15.5 mg/l in the effluent from industry C in the rainy season. In the dry season, the values ranged from 560±4.1 mg/l. in the effluent from industry B to 707±5.5 mg/l. in the effluent from industry A. The alkalinity levels in the dry season were 140±3.1 mg. CaCO3/l. in the effluent from industry C, 166±6.1 mg. CaCO3/l. in the effluent from industry B and 396±5.3 mg CaCO3/ l. in the effluent from industry A. In the rainy season, the values ranged from 76.0±11.1 mg. CaCO3/l. in the effluent from industry C to 292.1±13.3 mg. CaCO3/l. in the effluent from industry A. The hardness (TH) in the dry season was 138±2.3mg/l. in the effluent from industry B, 172±6.0 mg/l. in the effluent from industry C and 236±1.9 mg/l. in the effluent from industry A while in the rainy season, the values were 515.5±7.2 mg/l. in the effluent from industry C, 715±9.1 mg/l. in the effluent from industry B and 767.6±1.5 mg/l. in the effluent from industry A.In the rainy season, the concentration of chloride ranged from 17.8±1.5 mg/l. in the effluent from industry A to 28.8±1.9 mg/l. in the effluent from industry C while in the dry season, the values ranged from 24.0±3.1 mg/l. in the effluent from industry C to 36.6±1.9 mg/l. in the effluent from industry B. The concentration of phosphate in the rainy season ranged from 0.04±0.01 mg/l. in the effluent from industry A to 4.5±2.1 mg/l in the effluent from industry C. The parameters obtained in the water at selected points in the river (Fig. 1) in the dry and rainy seasons are given in Tables 3 and 4 respectively. In the dry season, the pH levels were 7.5±0.06 at point 1, 6.7±0.12 at point 2, 6.3±0.19 at point 3 and 7.0±0.06 at point 4 while in the rainy season the values were 7.3±0.02 at point 1, 6.4±0.23 at point 2, 5.2±0.08 at point 3 and 6.5±0.16 at point 4. The dissolved oxygen (DO) at point 1 was high in both the rainy season (5.2±0.08 mg/l) and the dry season (5.4±0.12 mg/l). While the values were slightly higher in the rainy season at points 2 (5.7±0.1.8 mg/l), 3 (4.1±0.10 mg/ l) and 4 (6.0±0.21 mg/l), they were lower at these points in the dry season. Levels of biochemical oxygen demand (BOD) were 2.8±0.08 mg/l at point 1, 49.0±0.6 mg/l at point 2, 34.6±1.25 mg/l at point 3 and 38.1±0.9 mg/l at point 4 in the dry season. In the rainy season the values were 4.2±1.13 mg/l, 15.8±1.03 mg/l, 24.5±1.41 mg/l and 36.6±0.74 mg/l respectively, at these points. The electrical conductivity (EC) was 960±11.54 1/Ω.cmat point 1, 430±17.33 1/Ω.cmat point 2, 1090±5.8 1/Ω.cmat point 3 and 1022±6.11 1/Ω.cm. at point 4 in the dry season. In the rainy season, the electrical conductivities ranged from 498.3 ± 6.01 1/Ω.cm at point 1 to 583.3±4.41 1/Ω.cm at point 4. The values at points 2 and 3 were much higher. In the dry season, the hardness of the water was 417.0±4.93 mg. CaCO3/ l. at point 1, 113.3±3.50 mg. CaCO3/l at point 2, 330.7±1.80 mg. CaCO3/l at point 3 and 245.7±2.60 mg. CaCO3/l at point 4 while in the rainy season the values were 246.0±2.32 mg. CaCO3/l at point 1, 362.7±2.45 mg. CaCO3/l at point 2, 342.2±3.01 mg. CaCO3/l at point 3 and 297.8±2.01 mg. CaCO3/l. at point 4. The alkalinity of the water was 379.3±1.8 mg CaCO3/l upstream, 136.0±1.15 mg. CaCO3/l at point 2, 338.0±1.15 mg. CaCO3/l at point 3 and 360.0 ±2.31 mg. CaCO3/l at point 4 in the dry season while in the rainy season, the values were 51.0 ±2.08 mg. CaCO3/l at point 1, 220.0±1.2 mg. CaCO3/l at point 2, 208.0±2.91 mg. CaCO3/l at point 3 and 344.7±2.0 mg CaCO3/l at point 4. In the dry season, the levels of suspended solids were 22.0±1.15 mg/l at point 1, 97.7±1.45 mg/l at point 2, 238.0±4.16 mg/l at point 3 and 253.7±0.81 mg/l at point 4 and in the rainy season these were 665.0±13.2 mg/l at point 1, 62.9±0.58 at point 2, 82.3±1.45 mg/l at point 3and 77.7±1.45 mg/l at point 4. The concentration of chloride in water in the dry season was 24.8±0.71 mg/l at point 1, 36.5±1.92 mg/l at point 2, 38.2±1.0 mg/l at point 3 and 39.8 ± 0.05 mg/l at point 4. In the rainy season the values were 24.8±1.22 mg/l, 28.7±0.72 mg/l, 31.2±0.12 mg/ l and 34.7±0.35 mg/l at these points respectively. The concentration of phosphate in the dry season was 0.03±0.01 mg/l at point 1, 0.13±0.01 mg/l at point 2, 0.02±0.01 mg/l at point 3 and 2.07±0.1 mg/ l at point 4. In the rainy season, the values were 2.46±0.08 mg/l at point 1, 0.05±0.0 mg/l at point 2, 0.07±0.01 mg/l at point 3 and 1.11±0.03 mg/l at point 4. The concentration of nitrate averaged 0.02±0.1mg/l in the dry season and 0.01±0.0 mg/l in the rainy season. Discussion and Conclusion The results showed that the pH of the effluent from industry A was the lowest in the dry season while pH for the effluent from industry B was the highest. The low pH levels in the effluent from industriesAand C could be due to theraw materials such as corn, sorghum, enzymes, lactic acid and yeast that are used by these two industries. However, in the rainy season the effluent from industry C was the most acidic and that from industry B was least acidic. Notable was the fact that in both seasons, the effluents were acidic (pH<7.0) The dissolved oxygen levels in the dry season differed significantly (p<0.05), being lowest in the effluent from industry B and highest in the effluent from industry A. The low DO value from the effluent in the textile company suggests that this industry was producing a lot of organic substances, most likely, the dyes, which are high oxygen-demanding wastes. Seasonal differences were also significant (p<0.05), the values being lower in the dry season than in the rainy season. The higher values in the rainy season could be due to rainwater, which resulted in more freshness of the water. All the values were below the minimum standard (>5mg/l.) set by the Malawi Bureau of Standards (MBS, 2000). The levels of biochemical oxygen demand varied significantly (p<0.05) between the effluents in the dry season, being highest in the effluent from industry C and lowest in the effluent from industry B. The rainy season levels also varied between sampling points. In this case however, the highest amount was in the effluent from industry C and the least was in the effluent from industry B. The rainy season values were much higher than the dry season ones. In the dry season, the values of electrical conductivities were much lower (p<0.05) than those in the rainy season. The higher values in the rainy season could be due to ground water and surface runoff from the surrounding farming areas that might have brought in ionic substances such as nitrates, chlorides and phosphates from fertilizers. This was also shown by the higher values of these ions in the rainy season compared to those in the dry season. The suspended solids were highest in the effluent from industry C in the rainy season and the least were in the effluent from industry A. However, the values in the dry season were much higher (p<0.05) in all the effluents. The alkalinity levels were much higher (p<0.05) in the dry season than in the rainy season. The hardness (TH) in the effluents followed the opposite trend to that of alkalinity. The values were higher in the rainy season compared to those in the dry season. In both seasons the values were highest in the effluent from industry A. The pH of the water in the river showed considerable variation. Upstream (point 1), the water was nearly neutral in the two seasons. The effluents from the industries did not directly affect point 1 and as such, the observed pH values were what would be expected of normal river water. The water at points 2, 3 and 4 was however more acidic than it was upstream. Although industry A was not directly contributing to the water quality, the effects of the effluents from industries B and C were apparent in this respect. The pH values were lower at points 2, 3 and 4 in both seasons. The relatively lower values in the rainy season could be due to a combined effect of the effluent and some incoming fertilizers such as calcium ammonium nitrate and urea from the farming areas due to runoff. The dissolved oxygen at point 1 was low in both the rainy season and the dry season. Although the values were slightly higher in the rainy season at points 2, 3 and 4, they were lower at these points in the dry season. The slightly lower DO level at point 2 in the dry season could be due to the nature of the effluent that was released immediately before that point. The effluent discharged had DO level of 0.27mg/l., which suggested that the industries were releasing some organic substances that were high oxygen-demanding wastes (Emongor et al., 2005). In addition, it had been observed, during sample collection, that the water was calm at this point probably because of the presence of some plants that were growing there and this might have retarded oxygen mixing between the atmosphere and water (Boyd, 1990). However, at point 4, the DO level increased slightly and this could be due to fewer plants growing there than at point 2, and this might have helped to increase flow of water which in turn helped aeration of the water. The higher DO values in the rainy season could be a result increased water volume in the river. The BOD levels were generally high at points 2 and 3 in the dry season. The higher values at these points meant that there were greater quantities of degradable wastes probably from the effluents from industries B and C both of which had BOD levels of 57.8±2.5mg/l. and 110.6±5.2mg/l. respectively, at the points of discharge into the stream. This also corresponded with the low DO levels that were noted at these points. The levels of BOD during the rainy season varied significantly (p<0.05) between points, although, the amounts at point 2 and point 3 did not vary significantly. This could be due to the fact that the effluent fromindustryA thatwas being dumpedin a pit behind its premises, might have been washed away by storm water and affected the quality of water in the river. The electrical conductivities were higher (p<0.05) at points 3 and 4 in the dry season. The lower EC observed at point 2 could be due to the fact that since industry B is a textile factory, it could be using synthetic detergents in its operations and these could precipitate ionic species, resulting in low conductivity. The higher conductivities observed at points 3 and 4 could be attributed to the relatively low DO and high BOD levels in the effluents coming from the industries B and C. However, in the rainy season, the electrical conductivities were lower than those observed in the dry season. This was attributed to dilution of salts arising from increased water volume in the river. Significant differences (p<0.05) between sampling points were also observed. There were also significant seasonal differences between sampling points with point 2 showing a tremendous increase. In the dry season, the hardness of the water was surprisingly high upstream. Activities were observed upstream and beyond point 1 that included farming, bathing and washing of clothes by villagers around the area and these activities could account for the high level of hardness of the water. In the rainy season, the hardness exhibited a different trend from that in the dry season. Water hardness increased from point 1 to point 2 and steadily decreased at points 3 and 4. However, at point 4 (downstream), the levels declined, and this was in contrast to what other workers found out (Fakayode, 2005). There were significant seasonal differences (p<0.05) in the mean levels of hardness between points. In general, the values obtained from the different points in different seasons showed that the water was relatively hard although the levels were below those set by the Malawi Bureau of Standards (500mg CaCO3/l). The water upstream was more alkaline in the dry season, decreased at point 2 but increased again at points 3 and 4. The high values upstream and downstream could be due to the water’s cleanliness, which made people utilize it for purposes such as washing and bathing. Since most soaps have water-softening agents such as washing soda and sodium carbonate, the use of soaps might have increased the concentration of carbonates and hence alkalinity. The relatively greater levels of alkalinity observed at points 3 and 4 could be attributed to low levels of DO after the out fall of the effluents from industry C at point 3. In the rainy season, a different trend was observed; the low levels of alkalinity observed upstream could be attributed to the fact that during this time, the water at this point was turbid and dirty probably as a result of land runoff, and this might have prevented people from using the water for washing and bathing. In the dry season, the lowest levels of suspended solids were obtained at point 1 and the highest levels were obtained at point 3. This was attributed to the fact that during this period, the water was relatively free from materials that were brought in the river through runoff. The high levels of solids at points 2, 3 and 4 were attributed to the entry of effluents from industries B and C. This showed that the entry of these effluents had an impact on the levels of solids in the river. However, in the rainy season, greater levels of suspended solids were obtained at point 1, with the least at point 4. As similar studies (Fakayode, 2005) have shown that contaminants tend to accumulate downstream, it is difficult to explain the opposite effect in this observation. In the dry season, the concentration of chloride was highest (p<0.05) at point 4 and least at point 1 in agreement with what has been observed in other studies (Fakayode, 2005). A similar trend was observed in the rainy season. The concentrations in the dry season were higher though than in the rainy season. The concentration of phosphate varied between sampling points in the dry season, being highest at point 4. The concentration at points 1, 2 and 3 did not differ much. However, in the rainy season, the trend was the opposite; it decreased downstream. The concentration of nitrate did not differ significantly between sampling points in both the dry season and the rainy season. In general, the values were higher in the wet season than in the dry season probably as a result of surface runoff of fertilizers from the farming areas. Overall, the study has shown that the effluents from the industries have a big impact on the water quality of the receiving river. Although the values in some cases were lower than the allowable limits, the continued discharge of the effluents in the river may result in severe accumulation of the contaminants and, unless the authorities implement the laws governing the disposal of wastes, this may in turn affect the lives of the people. The results of this study have shown that the effluents were very acidic in both the dry and rainy seasons. While dissolved oxygen, biochemical oxygen demand, electrical conductivity, suspended solids, alkalinity and chloride were relatively high, in the dry and rainy seasons, the concentrations of phosphate and nitrate were low. In the dry season, the water upstream was neutral with high dissolved oxygen but low in levels of the other parameters. The water after the effluent receiving points was acidic and the levels of the other parameters were high and especially downstream. The results suggest that the effluents being discharged into the river have considerable negative effects on the water quality of the water in the river and as such, the water is not good for human use. It is therefore recommended that that careless disposal of the wastes should be discouraged and if possible, there is need to install a treatment plant for all the industrial wastes so that they are treated before being dumped into the environment. References
© 2005 Center for Environment and Energy Research and Studies (CEERS) The following images related to this document are available:Photo images[st05033t2.jpg] [st05033t3.jpg] [st05033t1.jpg] [st05033f1.jpg] |
| |||||||||
