 |
| About Bioline | All Journals | Testimonials | Membership | News |
|
||||||
|
||||||
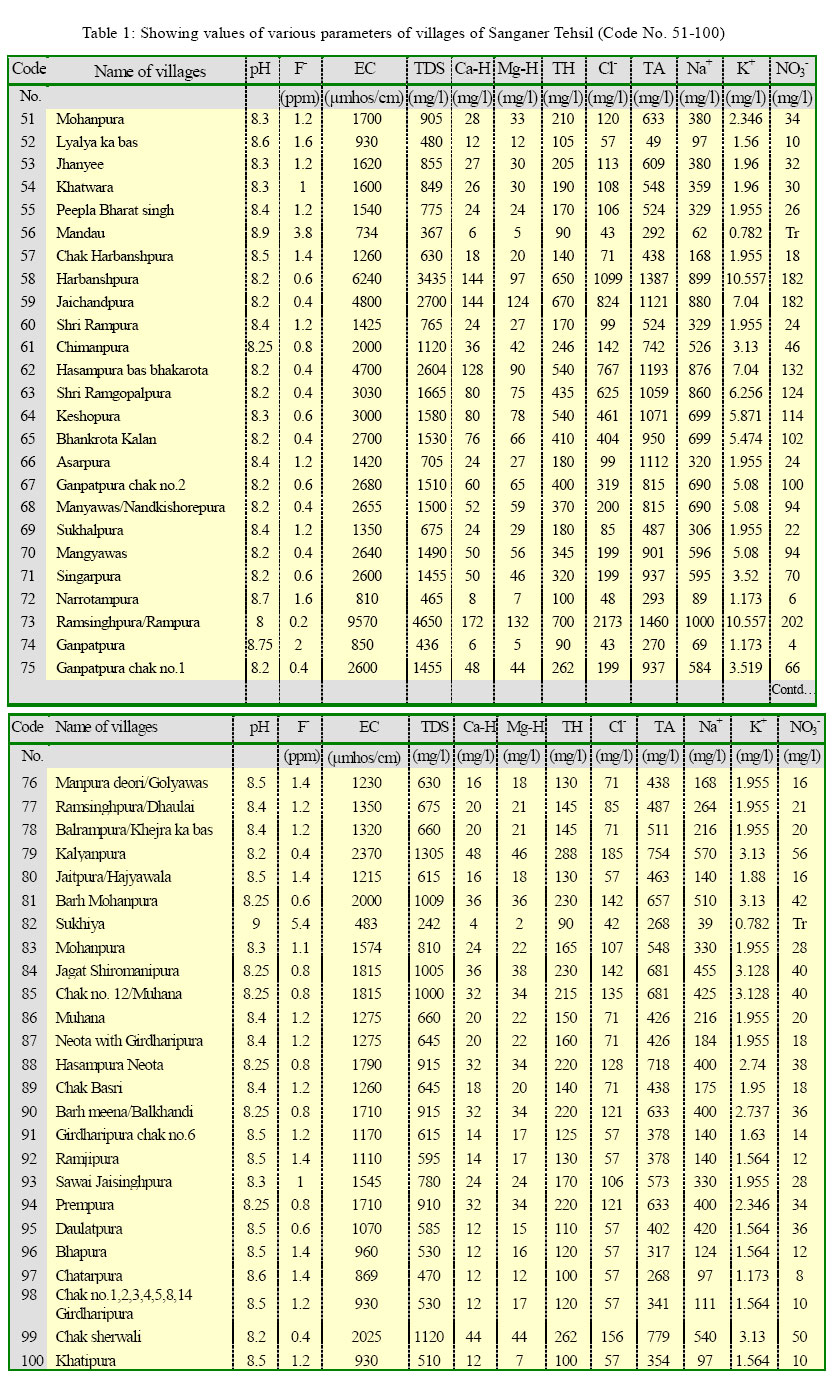
International Journal of Enviornmental Science and Technology, Vol. 2, No. 4, Winter 2006, pp. 373-379 Chemical analysis of drinking water of villages of Sanganer Tehsil, Jaipur District P. Jain, *J. D. Sharma, D. Sohu and P. Sharma Reproductive Physiology and Environmental Toxicology Laboratory, Department
of Zoology,
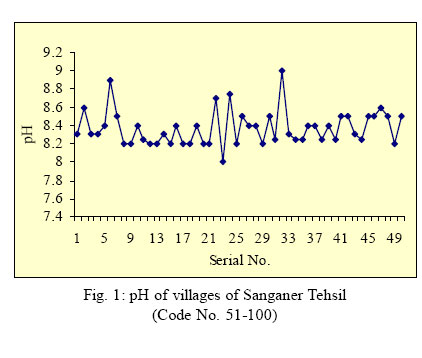
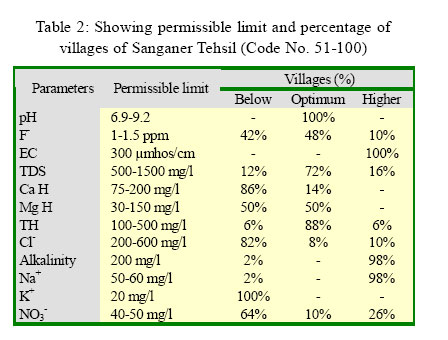
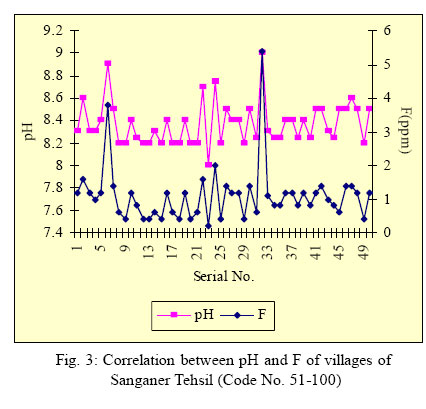
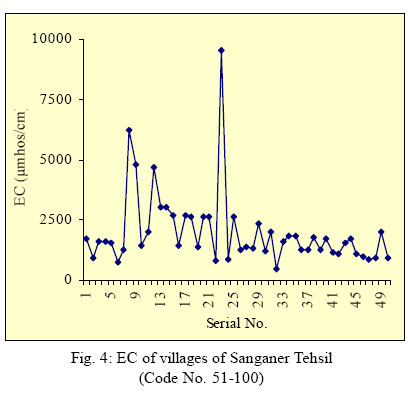
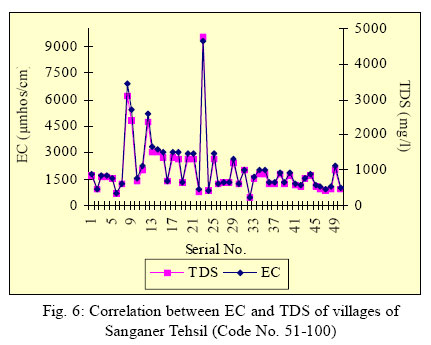
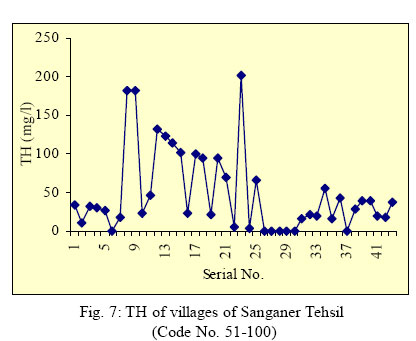
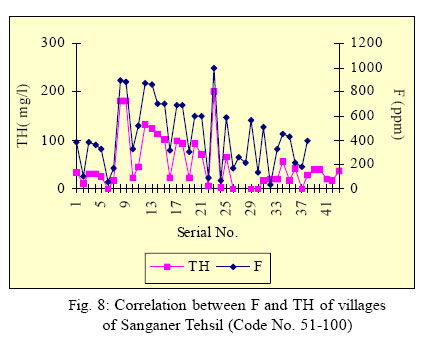
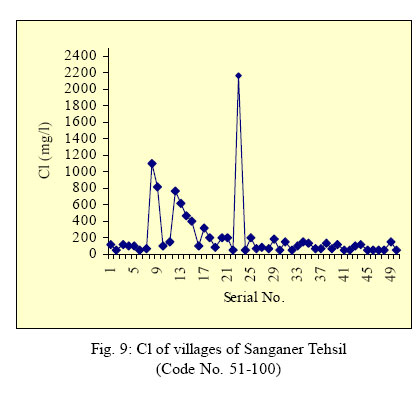
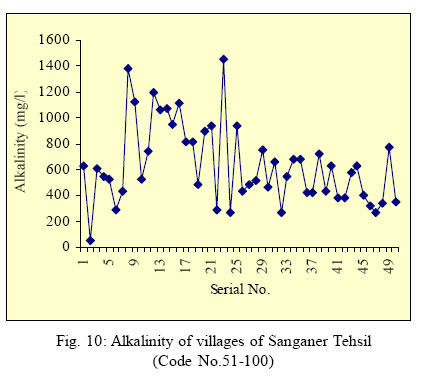
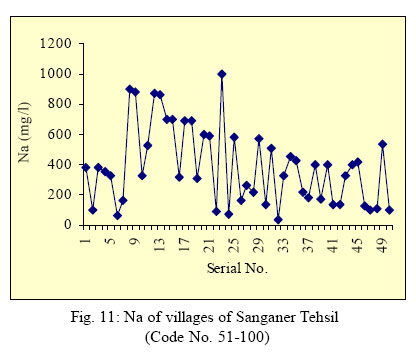
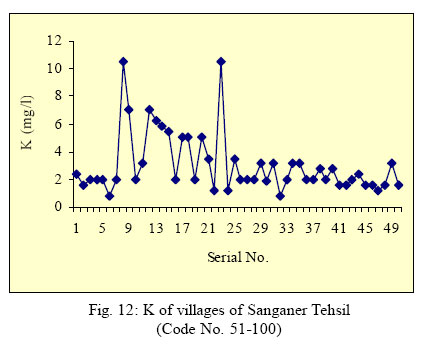
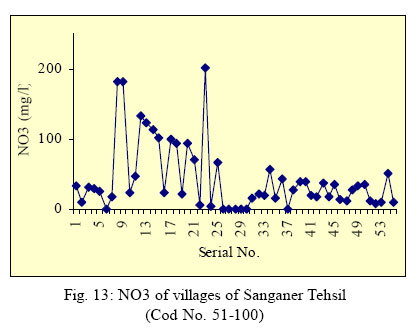
University of Rajasthan, Jaipur-302004, India Received 15 October 2005; revised 7 November 2005; accepted 4 December 2005 available online 22September 2005 Code Number: st05050 ABSTRACT: Due to pressure of human activity, urbanization and industrialization, the groundwater sources are degraded gradually; therefore pure, safe, healthy and odorless drinking water is a matter of deep concern. There are many pollutants in groundwater due to seepage viz. organic and inorganic pollutants, heavy metals, pesticides, fluorides etc. In Rajasthan state, all 32 districts are affected with high fluoride concentration in groundwater and among these Jaipur ranks second. The drinking water samples were collected in clean polyethylene plastic containers from villages (Code No. 51-100) of Sanganer Tehsil of Jaipur District. The water samples were analysed for pH, Fluoride (F-), Electrical Conductivity (EC), Total Dissolved Solid (TDS), Calcium (Ca), Magnesium (Mg), Total Hardness (TH), Chloride (Cl-), Carbonate (CO3-2), Bicarbonate (HCO3-), Alkalinity, Sodium (Na+), Potassium (K+) and Nitrate (NO3- using standard techniques in laboratory (APHA, 1985). The results revealed that most of the water samples were below or out of limited; according to the WHO standards (1996). The fluoride concentration ranged from 0.4 to 5.4 ppm, where 42% samples showed fluoride less than permissible limit and 48% water samples were within optimum limit i.e. 1-1.5 ppm while 10% samples contained Fluoride higher than permissible limit. pH of all the samples were within limit (6 to 9.2), while EC of all the water samples were out of limit i.e. 300 µmhos/cm. The alkalinity was greater than permissible limit (200 mg/l) in 98% villages and only 2% villages had below than optimum limit. The NO3- concentration was less than permissible limit (45 mg/l) in 64% villages whereas 26% samples showed higher concentration of NO3- . However only 10% samples contain optimum level of nitrate. Moreover Na concentration was greater than permissible (50 to 60 mg/l) limit in 98% water samples whereas K+ concentration was below the optimum (20 mg/l) level in all the samples studied. The results revealed that the quality of drinking water of Sanganer is very poor, which can be used for drinking and cooking only after prior treatment. Key words: Drinking water, Sanganer Tehsil, fluoride, electrical conductivity, total dissolved solids, nitrate INTRODUCTION Groundwater is a valuable natural resource for various human activities (Prasad and Narayana, 2004). Natural water always contains dissolved and suspended substances of organic and mineral origin. The pollution of groundwater is of major concern, firstly because of increasing utilization for human needs and secondly because of the ill effects of the increased industrial activity. High concentration of fluoride in groundwater is a considerable health problem in several regions of the world. Considerable part of India has fairly good distribution of fluoride contaminated groundwater (Sinha, 1991). As per report of UNICEF, 20% of the fluoride affected villages in the world are in India and out of these, 10% are in Rajasthan. High fluoride in groundwater is present especially in peninsula and in arid to semi-arid regions of north-western India (Jack et al., 1999). The groundwater of Jaipur district is contaminated with various pollutants including fluoride. So the present study was undertaken to assess the quality of drinking water of villages of Sanganer Tehsil (Code no. 51-100). The sampling of water analysis was done in month of October and November 2003 at various location viz. hand pumps, open wells, tube wells and PHED supply from villages of Sanganer Tehsil of India. MATERIALS AND METHODS Sanganer Tehsil is attached with the main city. It lies between 26°49’ to 26°51’ N latitude and 75°46’ to 75°51’ E longitude. It covers an area of 635.5 sq. km. Water samples were collected in clean polyethylene bottles from different sources viz. tube wells, hand pumps, open wells and other sources. The samples were analysed for different parameters as pH, F-, EC, TDS, Ca, Mg, TH, Cl-, CO3-2, HCO3-, Alkalinity, Na+, K+ and NO3- by using standard techniques (Anonymous, 1976). RESULTS The resultsrevealed that pH ranged from 8 to9. Minimum pH (8.0 ± 0.11) was observed from Ramsinghpura village and Maximum (9.0 ± 0.14) was observed from Sukhiya village (Table 1 and Fig. 1). pH is expressed as a number ranging from 0-14. The number is an expression of the concentration of H+ ion in the solution. All water samples were found to be within limit but alkaline in nature (Table 2). pH showed positive correlation with fluoride and negative correlation with other parameters (Table 3). Trivedi (1988) also reported fluoride concentration associated with alkalinity. According to WHO (1996), the permissible limit for pH is 6.9 to 9.2. Fluoride (F-) variedfrom 0.2 to5.4 ppm. Minimum (0.2 ± 0.08 ppm) and maximum (5.4 ± 0.11 ppm) concentration of Fwas observed from Ramsinghpura and Sukhiya villages respectively (Table 1, Fig. 2). Permissible limit for F- concentration is 1-1.5 ppm according to WHO (1996). The data revealed that 10% villages of Sanganer Tehsil are affected with high concentration of F-, whereas 42% villages had lower F- content. However, 48% villages contained optimum limit of fluoride concentration (Table 2). A positive correlation (r=+0.893) was observed between F and pH (Fig. 3) as earlier reported by Teotia and Singh (1981) and Trivedi (1988). EC is a numerical expression of ability of an aqueous solution to carry electric current. USPH recommended permissible limit for electrical conductivity (EC) is 300 µmhos/cm. The values of EC ranged from 483-9570 µmhos/cm. Minimum (483 ± 36.68 µmhos/cm) and maximum (9570 ± 161.65 µmhos/cm) EC was reported from Sukhiya and Ramsinghpura villages respectively (Table 1 and Fig. 4). By analyzing the results, all water samples showed EC higher than permissible limit (Table 2). EC signifies the amount of TDS in water. Findings of the present study were in agreement with the results of the survey conducted by Gupta et al. (1994). The total dissolved solids (TDS) in drinking water reveal the saline behaviour of water, which indicates the organic pollution level of water. TDS ranged from 242 to 4650 mg/l. Minimum (242 ± 39.26 mg/l) and maximum (4650 ± 254.03 mg/l) concentration of TDS was observed from Sukhiya and Ramsinghpura villages respectively (Table 1 and Fig. 5). According to WHO (1996), TDS should be between 500-1500 mg/l. TDS was found to be within limit in 72% villages, lower in 12% villages, whereas 16% villages showed TDS higher than limit (Table 2). In this study, significant positive correlation (r=+0.995) was observed between EC and TDS (Table 3, Fig. 6). Calcium hardness (Ca-H) ranged from 4 to 172 mg/l. Minimum Ca-H (4 ± 1.15 mg/l) was observed from Sukhiya village whereas maximum Ca-H (172± 6.92 mg/l) was reported from Ramsinghpura Village. Magnesium hardness (Mg-H) ranged from 2 to 132 mg/ l. Minimum (2 ± 1.15 mg/l) and maximum (132 ± 6.92 mg/l) values were reported from Sukhiya and Ramsinghpura villages respectively. Ca-H and Mg-H combined to form total hardness. TH varied from 90 to 700 mg/l. Minimum (90 ± 24.24 mg/l) and maximum (700± 57.74 mg/l) was reported from Sukhiya and Ramsinghpura villages respectively (Table 1 and Fig. 7). WHO recommended safe permissible limit for hardness i.e. 100-500 mg/l (Table 2). In groundwater, hardness is mainly due to carbonates, bicarbonates, sulphates and chlorides of Ca and Mg. Ca H was within permissible limit in 14% villages whereas 86% villages contained Ca H below than limit (Table 2). Mg-H was below than limit in 50% villages and 50% villages showed Mg-H within optimum limit. Total hardness was higher in 6% villages; below than limit in 6% villages whereas 88% samples contained TH within optimum limit (Table 2). In this study, hardness showed negative correlation with F- and pH (r= -0.544; r= -0.702) (Table 3 and Fig. 8). The results are in agreement with the findings of Trivedi (1988) and Sharma (2003). Chloride (Cl) varied from 42 to 2173 mg/l. Minimum (42 ± 6.92 mg/l) was reported from Sukhiya village and maximum (2173 ± 99.88 mg/l) was observed from Ramsinghpura village (Table 1 and Fig. 9). The chloride content was higher than permissible limit (200-600 mg/l) in 10% villages whereas lower in 82% villages. Only 8% villages were within optimum limit (Table 2). High content of chloride gives salty taste to water. Carbonate (CO3 -2 ) ranged from 24 to 216 mg/l. At some villages CO3 -2 concentration is negligible. Minimum (24 ± 6.92 mg/l) and maximum (216 ± 11.55 mg/l) content of CO3 -2 was observed from Bhapura, Girdharipura Chak Nos. 1,2,3,4,5,8,14, Khatipura and Ramsinghpura respectively. Minimum bicarbonate (HCO3 -) (49 ± 6.35 mg/l) observed from Lalya ka bas village and maximum (1244 ± 87.18 mg/l) was reported from Ramsinghpura village. CO3 -2 and HCO3 - together make total alkalinity. It ranged from minimum (49 ± 6.35 mg/l) Lalya ka bas to maximum (1460 ± 98.72 mg/l) from Ramsinghpura villages (Table 1 and Figure 10).Alkalinity washigherthan permissible limiti.e. (200 mg/l)in 98% villages,only 2% villages contained alkalinity belowthan limit (Table2). Alkalinity showedpositive correlation with EC, TDS, Cl, TH, NO3- , Na+ and K+ (Table 3). The results are in agreement with the results of Devi et al. (2003). High values of alkalinity give undesirable taste to water. Minimum (39 ± 2.88 mg/l) and maximum (1000 ± 58.31 mg/l) Sodium (Na+) content was observed from Sukhiya and Ramsinghpura villages respectively (Table 1 and Fig. 11). Almost all the villages (98%) contained higher concentration of Na+ except in Sukhiya village wherein it was below limit. The acceptable limit for Na+ is 50 mg/l according to WHO (Table 2). Potassium (K+) content of water samples varied from 0.782 to 10.557 mg/l. Minimum (0.782 ± 0.22 mg/l) and maximum (10.557 ± 1.62 mg/l) K+ content were observed from Mandau and Ramsinghpura villages respectively (Table 1, Figure 12). All the water samples (100%) contained K+ content lower than permissible limit i.e. 20 mg/l (Table 2). Minimum (6 ± 1.15 mg/l) and maximum (202 ± 1.15 mg/ l) nitrate (NO3- ) content was observed from Narottampura and Ramsinghpura villages respectively. At two villages (Sukhiya and Mandau) NO3 was in trace amount (Table 1 and Fig. 13). NO3 content was lower than permissible limit (40-50 mg/l) in 64% villages; 10% were within limit whereas 26% villages had NO3 concentration higher than limit. Higher concentration of NO3 in water causes a disease called “Methaemoglobinaemia” or known as “Blue-baby Syndrome”. It is particularly infant disease upto 6 months of child (Agrawal, 1999). DISCUSSION AND CONCLUSION The data indicate that the groundwater of Sanganer Tehsil is highly deteriorated as it is polluted with high amount of fluoride, nitrate and alkalinity. Most of the parameters were either more than permissible limit or below limit. Therefore, the drinking water of villages of Sanganer Tehsil is not potable. To maintain quality of groundwater, the continuous monitoring of physicochemical parameters should be done and can be used for cooking and drinking only after prior treatment. ACKNOWLEDGEMENT Authors are thankful to State Ground Water Department, Government of Rajasthan and Head, Department of Zoology, University of Rajasthan, Jaipur for providing necessary facilities. REFERENCES
© 2006 Center for Environment and Energy Research and Studies (CEERS) The following images related to this document are available:Photo images[st05050f7.jpg] [st05050f12.jpg] [st05050f6.jpg] [st05050f1.jpg] [st05050f9.jpg] [st05050f5.jpg] [st05050f10.jpg] [st05050f2.jpg] [st05050f8.jpg] [st05050f13.jpg] [st05050f3.jpg] [st05050t3.jpg] [st05050f11.jpg] [st05050f4.jpg] [st05050t1.jpg] [st05050t2.jpg] |
| |||||||||
