 |
| About Bioline | All Journals | Testimonials | Membership | News |
|
||||||
|
||||||
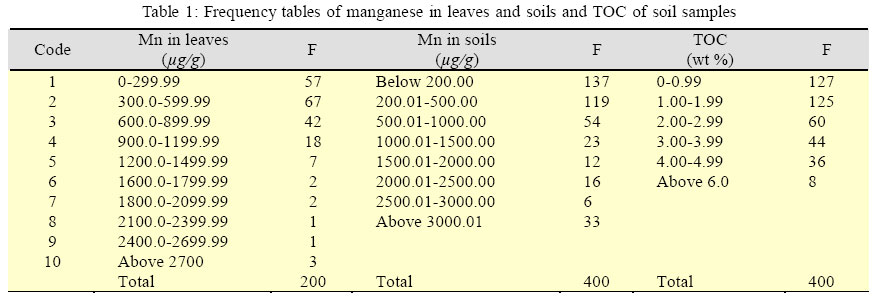
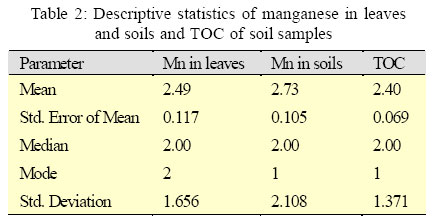
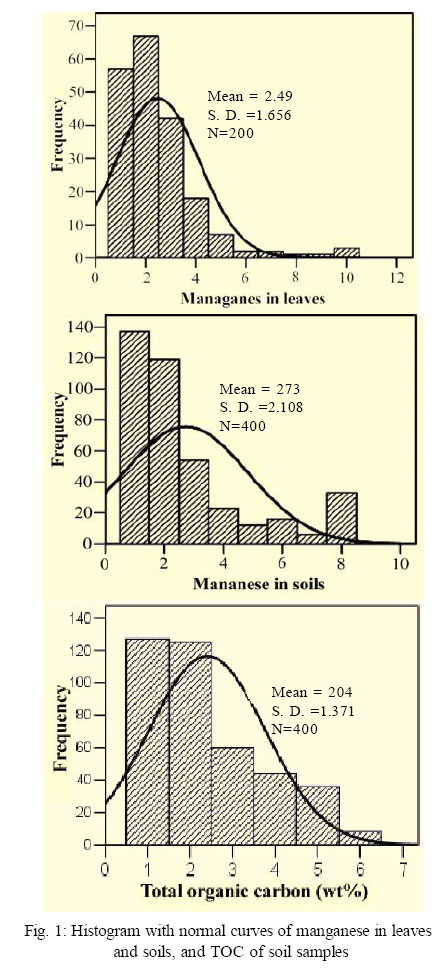
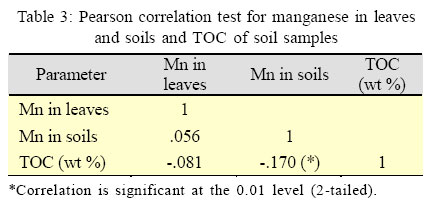
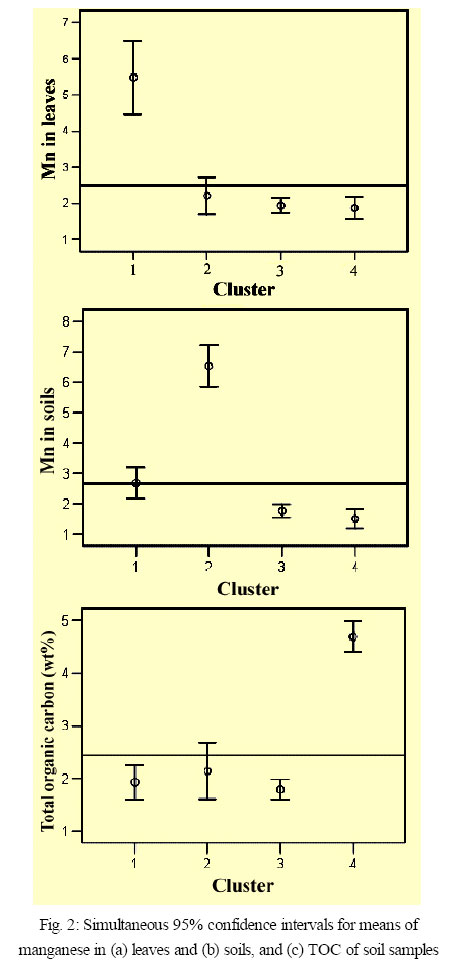
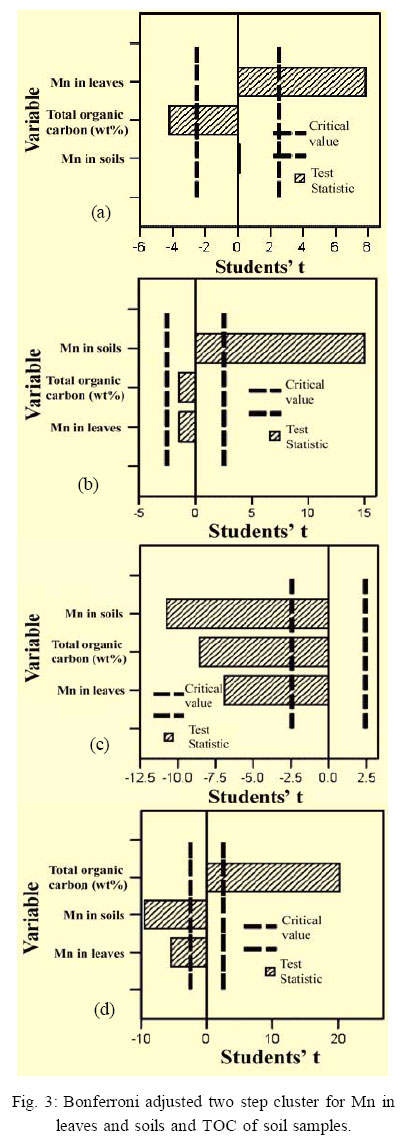
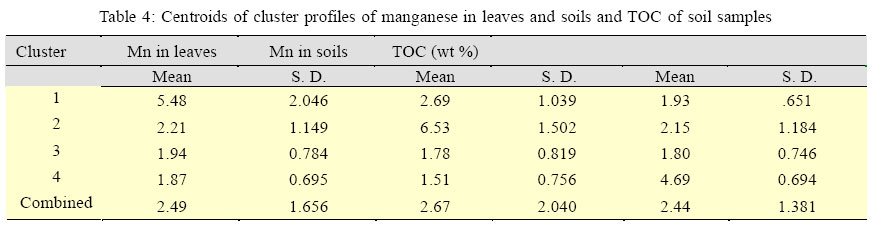
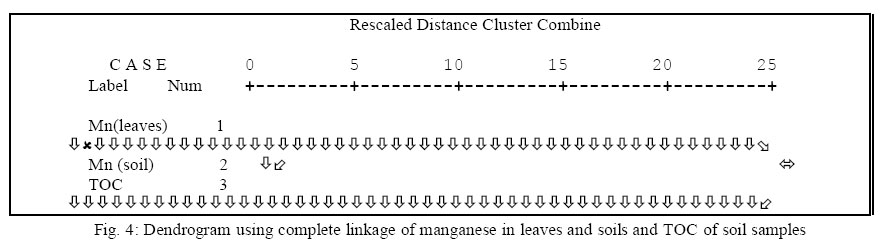
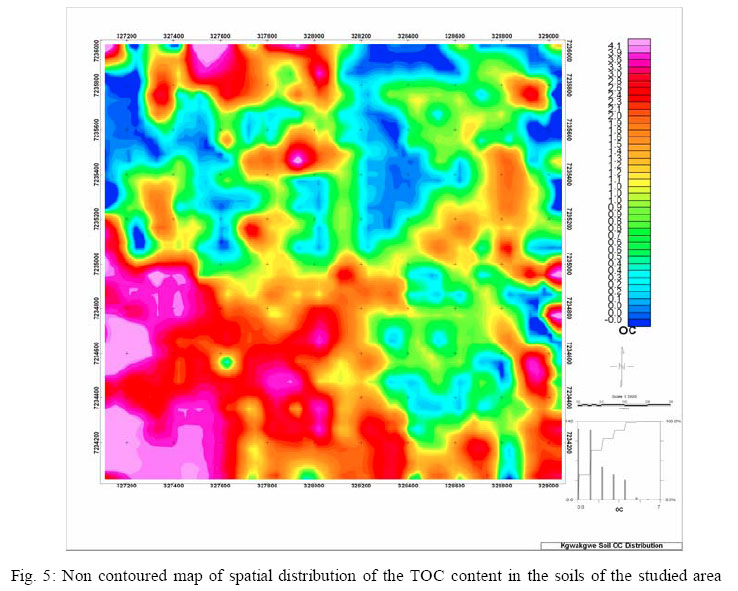
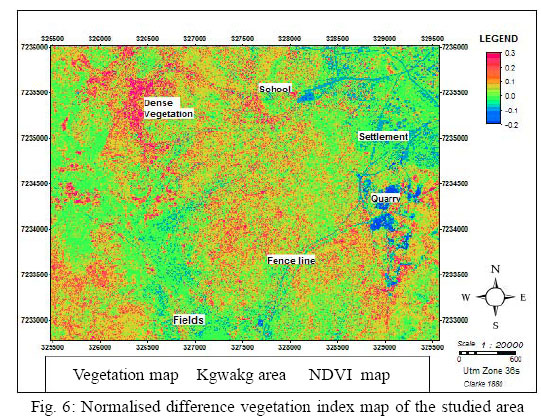
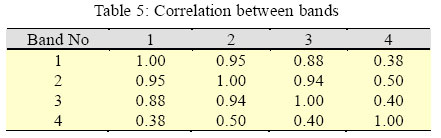
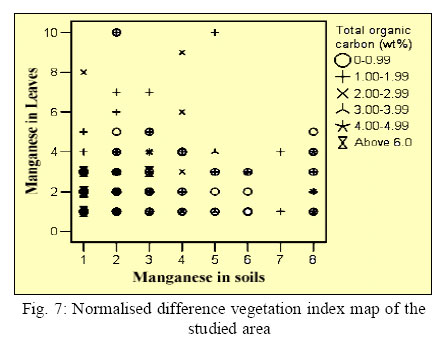
International Journal of Enviornmental Science and Technology, Vol. 3, No. 1, 2006, pp. 15-24 Total organic carbon in soils and its relation with manganese concentrations in soils and vegetation close to an abandoned manganese mine 1*G. I. E. Ekosse, 2P. S. Fouche and 2B. Mashatola 1X-Ray Diffraction Unit, Faculty of Science, University of Botswana, Botswana *Corresponding Author, E-mail:ekossege@mopipi.ub.bw Received 31 January 2005; Code Number: st06003 ABSTRACT This study aimed at quantifying the total organic carbon (TOC) present in soils within the proximity of the Kgwakgwe Mn oxide ore abandoned mine, Botswana, and establish its relationship with Mn concentrations in soils and vegetation based on multivariate and Geographical Information Systems (GIS) analytical techniques. Four hundred soil samples and 200 vegetation set samples were obtained from a 4 km2 area close to the abandoned mine. The TOC in soil samples were determined using a carbon/hydrogen/moisture determinator, and Mn concentrations in soils and vegetation by atomic absorption spectrophotometry. Results were processed using the statistical package for social science (SPSS), GIS, and Remote Sensing (RS) techniques with the Integrated Land and Water Information System (ILWIS), Geosoft Oasis Montaj and ArcGIS software packages. The values for TOC in the soil samples from the study area ranged from 0 wt % to 7.91 wt %, with a mean of 1.90 wt %, and at the control area, from 4.07 wt % to 4.86 wt %. The range of concentrations of Mn in soils was from 36 mg/g to 24908 mg/g and for Mn concentrations in the vegetation samples from 26 mg/g to 3611 mg/g with a mean of 598 mg/g. Results of correlation coefficients depicted very weak negative association except Mn in soils/Mn in leaves which was weak but positive. The statistical data yielded four clusters as follows: cluster one consisted mainly of Mn in leaves, cluster two was constituted of Mn in soils, and cluster four had TOC. Cluster three was dominated by the three parameters but with negative t statistic. The spatial presentation of data presented revealed little or no vegetation in the south eastern area and those close to the mine workings, and some significant vegetation in the north western part of the study area. The low TOC in the soils is associated to low vegetation cover which is considered to have been influenced by the soil clay fraction mineralogy and high concentrations of Mn. Key words: Bonferroni adjusted clustering, cluster analysis, image processing, spatial presentation NTRODUCTION The use of multivariate analyses and geographical information system (GIS) techniques in understanding different physical environments in Botswana has been limited toclaysandclay minerals (Ekosseand Forcheh, 2005), Mn concentrations in soils and vegetation (Ekosse and Fouche, 2005, 2005a) and nickel-copper deposit (Ekosse et al, 2005). Both techniques have not been applied to establish statistical relationship among total organic carbon (TOC) in soils, Mn concentrations in soils and Mn concentrations in vegetation. Kgwakgwe soils are moderate, moderate-well to well drained, having brown to yellowish brown colour, and sandy loam to sandy clay texture (Mitchell, 1976; Remmelwaal, 1988).Kgwakgwevegetation is dominated by acacia plants which include Acacia tennispina, Acacia mellifera, Acacia karoo, Acacia hereroense, Acacia caffra and Acacia tortills, and other dominant species are Combretum apiculatum, Euclea undulata and Terminalia sericea (Timberlake, 1980). The soil lithology and vegetation type of the study site (2 km x 2 km) and thecontrolsitewere very similar. Thecontrol site of 900 m2 (300 m x 300 m), separated by a paleotopographic barrier devoid of Mn mineralization, located 4 km south of the studied area, was chosen (Ekosse and Vink, 1998). Manganese was mined at Kgwakgwe (latitudes 24 o59' and 25 o02', and longitudes 25 o17' and 25 o20’), south eastern Botswana from 1957 to 1987 (Ekosse, 2001; Ekosse and Mulaba-Bafubiandi, 2003; Ekosse and Nkoma, 2002; Ekosse and Vink, 2001; Lanzincka, 1992). However, no rehabilitation of mine sites was effected at the abandonment of the mining project (Ekosse and Fouche, 2005). Consequently, the possibility of high Mn in soils affecting the Mn concentrations in vegetation thereby causing sparse vegetation cover within Kgwakgwe may not be ignored. Linked to this suspected phenomenon is the relationship of TOC to the environment. This study therefore addressed the association of Mn concentrations in soils and vegetation in relation with the TOC in soils close to the abandoned mine. It was carried out by investigating the statistical relations of these parameters in the soils and vegetation, based on a multivariate statistic approach. It attempted to elucidate on environmental mining impact on the TOC in soils and the spatial distribution of the vegetation of the study area. MATERIALS AND METHODSSoils and vegetation sampling and samples The techniques and methods for soil sampling as described by Jewell et al., (1993), Crépin and Johnson (1993) and Tan (1996, 1998) were used to obtain soil samples from both the study area and the control site. Four hundred soil samples were taken at 100 m intervals, and at a depth of between 0 cm and 20 cm, nine samples from the control site for analyses. Vegetation sample sets obtained at alternate soil sample points consisted of leaves from Combretum apiculatum, Euclea undulata and Terminalia sericea. Mature dark green leaves with leaf diameter ranging from 2 cm to 4 cm within both the study and control sites were harvested for laboratory analyses. Between 100 and 200 leaves depending on the leaf diameter, which constituted a sample set, were sampled per sampling area. Two hundred vegetation set samples were obtained at 200 m intervals and four vegetation sets of samples from the control site. Laboratory analyses The TOC contents in soil samples were determined using a LECO RC-412 multiphase Carbon/Hydrogen/ Moisture Determinator. The principle is based on converting all C to CO2 in an oxidising analytical atmosphere. The organic form of C produces both H2O and CO2, which enables TOC to be measured from observable H2O peaks. The quantitative analysis program was set for the time and temperature required, which isthirtyminutes at 125 oC, afterqualitativetests were conducted to obtain the ranges. Manganese concentrations in the samples were determined by atomic absorption spectrophotometry after acid digestion. The procedure for sample digestion is as reported by Jones and Case (1990) and Page et al., (1982). Multivariate analyses and GIS techniques The data was processed with the aid of the SPSS software, and statistical multivariate analyses as explained Page et al., (1982) were performed. The analyses included descriptive statistics, frequency tables, Pearson’s correlation matrix, Chi-square or ttest of significance for 95% confidence levels, the Bonferroni adjusted two-step cluster analysis, and hierarchical clustering. Laboratory results were processed with the Integrated Land and Water Information System (ILWIS), Geosoft Oasis Montaj (version 4.2) and Arc GIS softwarepackages. TheTOC data were processed and analysed quantitatively. Geosoft Oasis Montaj was used to prepare gridded map which served as the base map. Image enhancement techniques contrast stretching and image filtering was applied to data to improve visual interpretation. A quickbird2.4 m – 2.8m resolution with zero cloud cover multispectral standard imagery of the study area was processed to establish the vegetation cover. The vegetation cover was determined using the Normalised Difference Vegetation Index (NDVI) (ILWIS 3.0, 2002; Principles of Remote Sensing, 2000), which is calculated as follows: NDVI= (Infrared - red)/ (Infrared +red)= (band 4 – band 3)/ (band 4 + band 3) (1) Where NDVI values range from –1 to 1(Principles of remote sensing, 2000). The NDVI assumes isovegetation lines converge at origin and all bare soil in an image will form a hypothetical line in spectral space known as the soil with zero vegetation. Green vegetation yields high values for the ratio whilst in contrast water yields negative values and bare soils give near zero values. The NDVI which works best at >30 % vegetation cover (Principles of Remote Sensing, 2000; Erdas Imagine, 1992) was used to do the overlays. The study area definitely had enough vegetation cover for the effective application of NDVI technique. The NDVI compensates for changes in illumination, surface slope and aspect. RESULTSTOC and Mn concentrations The results of laboratory analyses for TOC in soil samples, and Mn concentrations in both soils and vegetation are presented in samples Tables 1 and 2 and Fig. 1. Values obtained for TOC in soil samples from both the study site and the control area ranged from 0 wt % to 7.91 wt %, with a mean of1.90 wt %.At the control area, the TOC in the soil samples ranged from 4.07 wt % to 4.86 wt % (Tables 1 and 2). The TOC values obtained for soil samples at the control site were significantly higher than the mean TOC value for soil samples from the study site. The range of concentrations of Mn in soils from the study area was from 36 μg/g to 24908 μg/g with a mean of 1089 μg/g; and in the control area was from 62 μg/gto 763 μg/g; and these values were significantly lower than the mean concentration values of soils from the study site (Ekosse and Fouche, 2005). The Mn concentrations in the vegetation samples from the study area was from 26 μg/g to 3611 μg/g with a mean of 598 μg/g; and in the control area was from 131 μg/g to 324 μg/g; and these values were also significantly lower than the mean concentration values of soils from the study site (Ekosse and Fouche, 2005a). Inferential statistics and multivariate analysis The product moment correlation coefficients among the TOC, Mn concentrations in soils and Mn concentrations in leaves are shown in Table 3. In general, the correlation coefficients depicted very weak leaves, and Fig. 2 reflects their 95 % simultaneous confidence intervals for their means. Coded values (110) which are used in the clusters are based on real values shown in Table 1. Four clusters were obtained, and their interpretations are based on the mean values obtained for each parameter. Cluster one was characterized by Mn concentrations in leaves, cluster two by Mn concentrations in soils, and cluster four by TOC in soils. Cluster three was characterized by none of the three parameters. Figs. 3 is the Bonferroni Adjustment “by variable” importance charts for two step cluster analysis for TOC in soil samples, Mn concentrations in soil samples, and Mn concentrations in vegetation samples. The variables are lined up on the Y axis, in descending order of importance. The dashed vertical lines mark the critical values for determining the significance of each variable. For a variable to be considered significant, its t statistic must exceed the dashed line in either a positive or negative direction. Anegative t statistic indicates that the variable generally takes smaller than average values within this associations. The TOC/Mn in soils and TOC/Mn in leaves depicted very weak correlation reflecting weak negative associations. The Mn in soils/Mn in leaves portrays weak positive association. Table 4 gives the cluster profile of TOC in soil samples, Mn concentrations in soils and Mn concentrations in cluster, while a positive t statistic indicates the variable takes larger than average values. Cluster one shows Mn concentrations in leaves and TOC in soils exceeding the critical value (Fig. 3a). The negative t statistic for TOC indicates that the variable generally take smaller than average values within this cluster. For the formation of cluster two, Mn concentrations in soils, was the only important parameter, and with a positive t statisticvalue obtained for it (Fig. 3b). In cluster three, the importance measures for the three parameters exceed the critical value, and were all having negative t statistic values (Fig. 3c). In cluster four, TOC was the most important followed by Mn concentrations in soils and to a lesser extent, Mn concentrations in leaves. However, only TOC indicated positive t statistic value (Fig. 3d). Further complementary multivariate analysis of the soil samples using complete linkage hierarchical clustering method and correlation coefficients as a measure of similarity was performed (Fig. 4). The degree of association between groups of variables is represented by the distance axis. The lower the value on the axis, the more significant the association is. Two main hierarchical clustering were obtained. Mn concentrations in leaves and Mn concentrations in soils were very well coordinated followed by the linking of the three parameters by TOC in soils at the end of the distance axis. DISCUSSION AND CONCLUSION Spatial distribution of TOC and vegetation cover The colours reflected in the non contoured map presented in Fig. 5 as bluish, greenish, yellowish, brownish and reddish colour shades were unevenly spatially distributed and depicted prograded TOC values. Colour gradation in the non contoured map is reflected from blue for the low soil TOC values progressivelyto green, yellow,brown, red and pink for the high soil TOC values in the study site. From the map, it could be deducted that the TOC values for soil samples are high in the part west of Kgwakgwe Hills and in the central northern part of the study area. Otherwise the TOC values are generally low in the Kgwakgwe Mn mining sites and in the northeastern parts of the map area. High and low are used relatively in this context to distinguish the wt % of TOC in the soils in the study area; otherwise in general the TOC values are low. The vegetation index values from the image of the study area shown in Fig. 6 range from – 0.2 to 0.3. Quarry sites, roads, houses and bare ground have the lowest values of around less than zero, fields, cleared areas have values around zero. Trees around homesteads, sparse vegetation shows values around 0.1 whilst dense vegetation shows the highest values between 0.2 and 0.3. Difference in brightness values in the image may have been caused by topographic conditions, shadows or changes in sunlit illumination angles and intensity. These conditions could hamper the ability to identify surface material in a satellite image. A ratio transformation of image data was used to reduce the effect of these environmental conditions. Ratio images were also used for discriminating subtle differences in spectral variations and to eliminate albedo effects and shadows. Vegetated areas have a high reflection in the near infrared and a low reflection in the visible range of the spectrum. Clouds and water on the other hand have larger visual than near infrared reflectance. Rocks and bare soils have similar reflectance in both spectral regions (BRIMP, 2001; Ringrose and Matheson, 1991).Multi band statistics was performed to find the difference between all pixel values and the mean values for each channel i.e. channel variability. Correlation between two or more channels is shown by covariance statistics. A correlation matrix was used to evaluate the degree of correlation between individual bands and is as shown in Table 5. The matrix normally has values ranging from -1 to 1, indicating a strong negative correlation to a strong positive correlation respectively. Each band has a 1.00 correlation with itself as expected otherwise the higher the correlation it implies that there is redundancy in the data as information is being repeated across the two bands. If the value is zero, then there is either no correlation or the correlation is weak. Large positive values are indicative of strong positive correlation, and large negative vales reflect strong negative correlation. Band 1and Band 2, Band 1 and Band 3, and Band 2 and Band 3, show the highest correlation. The NIR (Band 4) and visible bands have the lowest correlation in the order; Band 4 and Band 1, Band 4 and Band 3, Band 4 and Band 2 respectively. The NR shows a highest correlation of 0.5 to band 2 in the visible range. Band combinations with lowest in other words showing more information correlation were bands 4, 1, 3. Environmental considerations It was observed that the plant leaves changed in colour from light reddish yellow around the mine workings area to green in the valleys and close to settlements. Leaves of plants located at the periphery were more colour affected than others. The peripheral leaves were the first to alter in colour. Where discoloration of leaves occurred, it was noticed that the young leaves started out as green but changed progressively in colour to light reddish yellow and eventually to golden yellow. In areas where Mn oxide ore occurred and/or was mined, either there was no vegetation cover observed or the area was covered with sparse vegetation. In these mine working areas, the plants were stunted and conspicuously shorter than their distant neighbours within the study area and the control site. Mature leaves of plants in areas of darkly coloured soils were between 2 cm and 2.5 cm in length compared to areas where soils were light brown to yellow in colour with plants having fresh broad leaves exhibiting full growths both in colour (green) and length (6 cm to 7 cm). Efforts were made to establish the association of Mn concentrations in soils and vegetation to TOC. Increase in Mn concentrations in soils and leaves corresponded to decrease in TOC in the soils (Fig. 7). This relationship was also statistically demonstrated through clustering. More than 60 % of the samples which constituted cluster three had very low TOC. The few samples which constituted cluster one had Mn concentrations in leaves to be between 1200 μg/g and 2099 μg/g; and those for cluster two had Mn concentrations in soils to be between 2000 μg/g and 3000 μg/g. This demonstrates that the clustering was governed mainly by percentages of TOC and Mn concentrations in soils, and Mn concentrations in leaves. The amount of TOC present in soils is governed by the soil organic matter (OM). Furthermore, the vegetation is the main determinant of OM in soils. However, soil Mn influences Mn in leaves (vegetation). The soil Mn is controlled by the CEC and the CEC by the soil clay fraction mineralogy. At Kgwakgwe, the dominance of 1:1 clay minerals (Ekosse, 2001), and the acidic nature of the soils does not favour exchange sites for Mn ions and as such they remain in solution and are available for plant uptake.In conclusion, this study focused on using multivariate analyses and GIS techniques in understanding the spatial distribution of TOC in soils close to an abandoned manganese mine, and to establish any relationship of with Mn concentrations in soils and vegetation. Distribution patterns show that where TOC percentages were high, Mn concentrations in soils and vegetation were very low. Four successions of TOC, Mn concentrations in soils and Mn concentrations in vegetation distribution patterns are recognized which could be translated to the four clusters obtained by multivariate analysis. Whereas the TOC values increased with increase in distance from south to north and from east to west of the study area, the Mn concentrations in soils and vegetation on the other hand, decreased for similar longitudinal and latitudinal distances. These patterns correspond to the four clusters obtained statistically: cluster one was dominantly Mn in leaves, cluster two had Mn in soils, and TOC in soils made up the fourth cluster. Cluster three was dominated by the three parameters but with negative t statistic. The results infer to high soil acidity, and soil clay fraction mineralogy to have played an influential role in determining this relationship of soil TOC with Mn concentrations in soils and leaves. REFERENCE
© 2006 Center for Environment and Energy Research and Studies (CEERS) |
