 |
| About Bioline | All Journals | Testimonials | Membership | News |
|
||||||
|
||||||
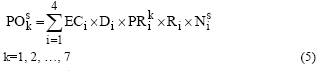
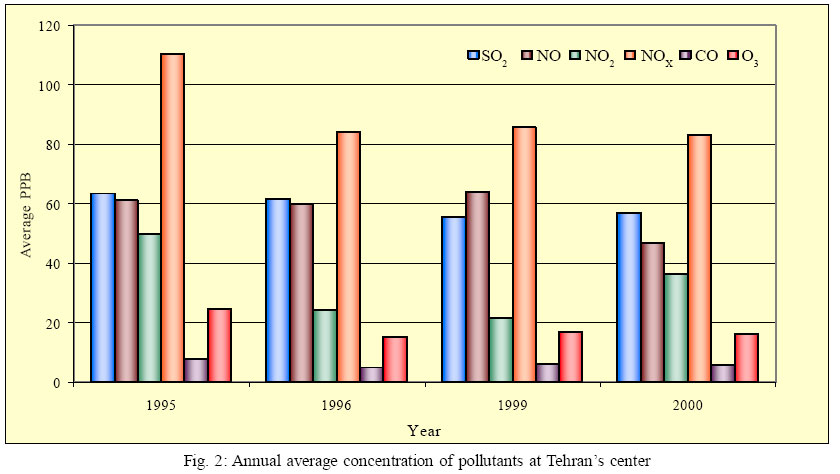
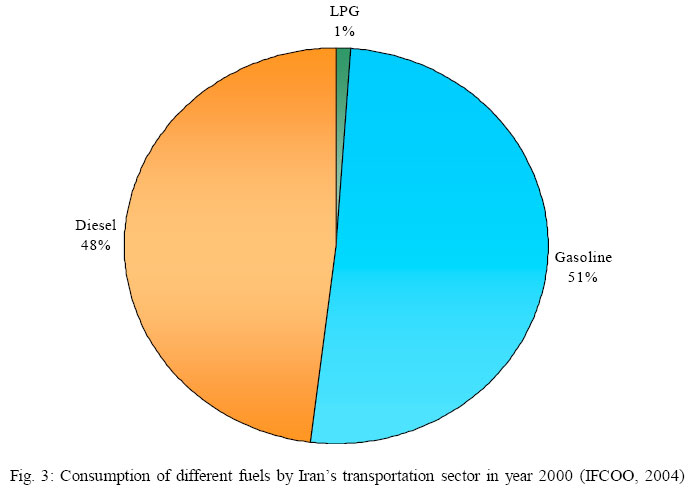
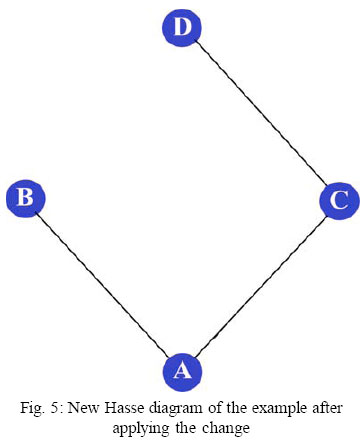
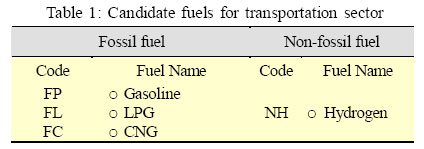
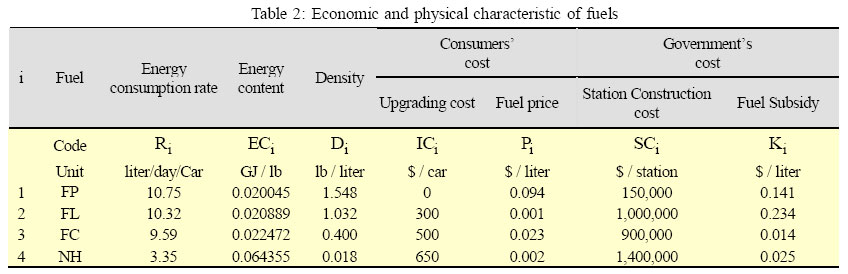
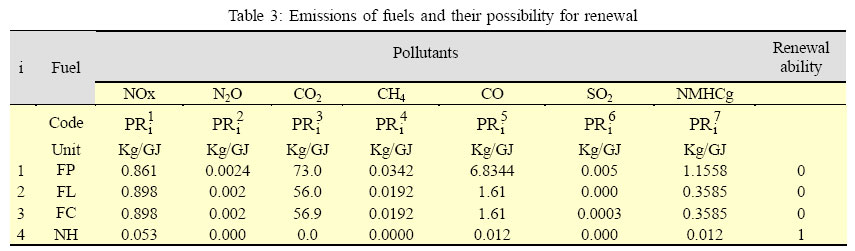
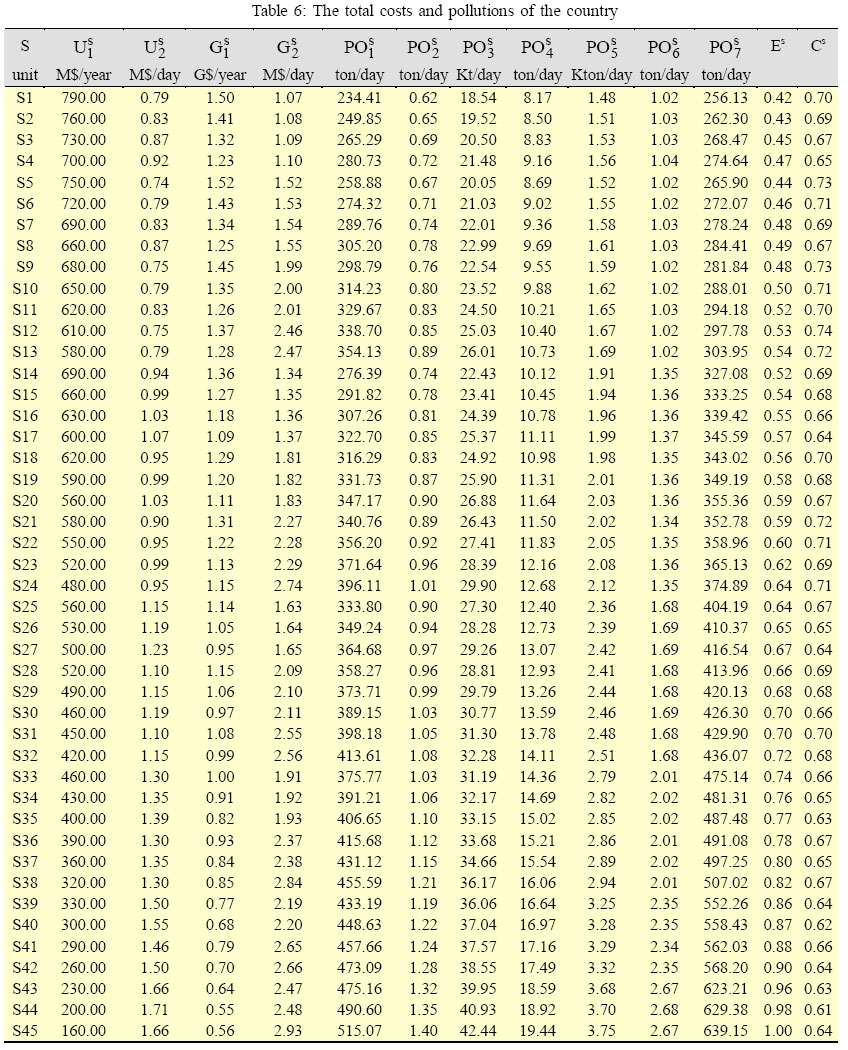
International Journal of Enviornmental Science and Technology, Vol. 3, No. 1, 2006, pp. 59-68 Strategies for utilizing alternative fuels by Iranian passenger cars 1*A. A. Rassafi, 2M. Vaziri and 1A. N. Azadani 1Department of Engineering, Imam Khomeini International University, Ghazvin, Iran *Corresponding Author, E-mail: info@rasafi.ir Received 28 August 2005; Code Number: st06008 ABSTRACT The current paper is an attempt to find a sustainable fuel strategy for passenger cars in Iran. Currently, most of Iran's passenger cars consume gasoline, a non-renewable fossil fuel. This fuel has well-known environmental impacts, including various kinds of pollutions, as well as the threat of quick running out. These general negative characteristics of gasoline are amplified by the high consumption rate of Iran's transportation sector, (e.g. about three times more than that of UK). The objective of this paper is firstly selecting possible alternative fuels for Iran's transportation sector, and then proposing the percent of cars consuming these alternative fuels (along with gasoline). The best strategies are proposed based on environmental and economic considerations, and hence are more sustainable decisions comparing with the other strategies. The best strategies are found using partial order theory and Hasse diagram technique, which is a multi-criteria decision analysis (MCDA) tool. Key words: Alternative fuels, passenger car, sustainable development, emission, MCDA INTRODUCTION Since the publication of “Our common future” (WCED, 1987) and the introduction of sustainable development, transportation has been on the center of the attention in many sustainability studies (Hardi and Zdan, 1997; Moffat, et al., 2001, Rassafi and Vaziri, 2005;Vaziri and Rassafi, 2001;Vaziriand Rassafi, 2003). It is because of the substantial impacts of transportation on both the environment and society. The environmental impacts of transportation are mainly categorized as air pollution, and non-renewable resource depletion. Both of these environmental impacts of transportation are directly related to the fuels it uses. Vehicles' engines use carbon and hydrogen from fuel, and oxygen and nitrogen from air during a combustion process to create energy. The unwelcome output of such burning process is the emission of dangerous gases into the environment. Fig. 1 shows the schematics of the combustion of a petroleum fuel. The pollutants of such a process have different environmental impacts. Some of these pollutants, including carbon dioxide, nitrous oxide, and methane, are called “Greenhouse Gases” which their impacts are global (APEA, 1995). The other pollutants with more local impact include carbon monoxide, sulfur dioxide, particulates, lead, and NMHC (Non-Methane Hydrocarbons). Fig. 2 shows the annual average concentration of pollutants and environmental standards at a central region of Tehran during 1995-2000 (Asadollah-Fardi, 2004). This variety of pollutants raises concerns about the negative consequences of transportation fuel usage. Despite of the above-mentioned disutility, fossil fuels are widely used by most of the transportation vehicles. At present, 100 percent of the Iran's demand for transportation is met by derivatives of the fossil fuel, petroleum. Fig. 3 illustrates the consumption of different fuels by Iran's transportation sector in year 2000 (IFCOO, 2004). Furthermore, these fuels are categorized as non-renewable resources, and soon or late, they will be finished. These two facts increases worries about the future status of the world in terms of sustainability issues, and imply that any decision regarding this kind of fuel is crucial to the human's future. The paper is an attempt to propose a more sustainable fuel strategy for Iran which may be both economically and environmentally better than the others. This is achieved by performing a multi-criteria decision-making tool, Hasse Diagram Technique (HDT), to propose the comparatively more sustainable fuel strategy. HDT is a tool that using partial order theory makes a comparison among the alternatives. The rest of the paper is organized as follows: First, the method, partial order theory and HDT are explained, and the resources which may be used as alternatives of ordinary fossil fuels are introduced, and their economical and environmental characteristics are discussed. Then, the more sustainable strategy for passenger car fuels is proposed after utilizing HDT. Finally. MATERIALS AND METHODSIn this section the method that is used for the study, and the information based on which the analysis is carried out are introduced. The research was made for Iran and the study year was 2005. However, the time and geographical scope of the study can be altered or be extended. Partial order theory and hasse diagram technique Partial order theory and Hasse diagrams appears to be a promising tool for decision-making particularly in environmental issues (Lerche and Sonersen, 2003). A partial order on a set P is a relation such as <( The ordered set can be visualized in a graph where each object is represented by a circle and the comparability of each pair of objects is shown by a link between those two objects. The higher ranked of the two is given a point with higher vertical position. Due to the transitive characteristic of the posets, the graph can be greatly simplified byonlydrawing next neighbor connections. This kind of graphical representation of posets is referred to as a Hasse diagram (Lerche and Sonersen, 2003). In the next sections this technique is used to evaluate the candidate fuels. As an illustrative example for Hasse diagram, consider a group of four persons P={A, B, C, D} as a ground set, and this technique is used for comparative evaluation of their physical size. Suppose that the taller and heavier the persons are, the bigger they are. The heights of four persons of the test are 65", 71", 75", and 78", respectively. Their respective weights are 132 lb, 180 lb, 155 lb, and 200 lb. Therefore, the relation '>' is partial ordering on P and (P, >) is a poset. A Hasse diagram of such example is shown in Fig. 4. As it can be seen in Fig. 4, 'A' is both the shortest and the thinnest member among the others and thus takes the lowest place. On the contrary, 'D' is the biggest one because he is the tallest and heaviest. Therefore, his position is at the top of the diagram. However, the same reasoning for 'B' and 'C' is not as simpleas that of 'A' and 'B'. 'B'is taller than 'C', while 'C' is heavier than 'B'. Thus, these people are not comparable with each other and take the same level in the diagram. The straight lines between each pair of people represent the existence of relation (i.e. >) between those two. For example if the height of 'B' is changed from 180 to 210 the Hasse diagram of such set would be changed as shown in Fig. 5. The missing line between 'D' and 'B' means that they are not comparable either. However, because 'D' is comparable with 'C' (and is located above it in the diagram), it is located in an upper level comparing with 'B' too. Candidate fuels and their characteristics There are three major fuels currently in use by different modes of Iran's transport. Gasoline and diesel are the customary fuels consumed by vehicles, and LPG is the other source which is recently used only by a small portion of taxis (IFCOO, 2004). Diesel is used mainly by heavy duty vehicles and is not the paper's focus. The paper considers gasoline and its alternatives in the analysis of finding the more sustainable strategy for passenger car fuel. The term 'alternative fuel' no longer refers to experimental wishful thinking, but a range of commerciallyviable, safematerials which couldfeasibly replace gasoline and diesel. The most notable alternative fuels are LPG, CNG, hydrogen, and Electricity. Each of these fuels produces less greenhouse gas emissions comparing with gasoline. The selected alternatives of gasoline are LPG, which is currently being used by a limited number of vehicles, CNG, which is gradually being introduced to the community, and hydrogen, which is the current paper's choice as a renewable and environmentally sound fuel. The other alternative fuels such as methanol, ethanol, ethers, petrohol, etc, are impracticable due to economic limitations as well as the problem of their publicity. The listed fuels in Table 1 are possible resources that can be considered for further assessments. The codes represent candidate fuels and will be used in the appraisal. Therefore, the study focuses on the economic and environmental characteristics of the 4 candidate fuels (gasoline and its 3 alternatives) in order to find a more sustainable decision. Economic aspects of fuels The costs considered in this paper for each fuel include several items which are paid by both consumers and government. Consumers' costs include payment of the fuel price, and the cost of changing the vehicle engines (or extra payment in case of purchasing an alternative fuel car) in order to be able to use alternative fuels. Government's costs include subsidies given to the fuel prices, and the expenditures of constructing new stations for alternative fuels. It should be noted that in addition to the direct costs of fuels, a wide range of issues are involved in developing a successful alternative fuels program including publicity of alternative fuels, comparison with conventional fuels, etc. These factors will not be considered in the analysis because of their difficulties in measuring and quantification. Table 2 has listed the economic as well as physical characteristics of the study fuels. Environmental aspects of fuels As stated earlier, the environmental impacts of fuels are categorized in two major groups: pollution and non-renewable resource depletion. The first group contains the materials which are emitted to the environment after combustion process. They are greenhouse gases (CO2 , NOx, and CH4), as well as CO, S, lead, particles, and NMHC. The weights of these emissions for each fuel have been listed in Table 3. The numbers in this table for each fuel reflect the polluting power of that fuel. The second group regards to the privilege of renewal of the fuel. In this paper a binary variable represents this characteristic(1: renewable, 0:non-renewable). This The total costs of each strategy The main objective of the study is finding the more
sustainable strategy for different car fuels. In other
words, the study is looking for a mixed fleet of Iranian
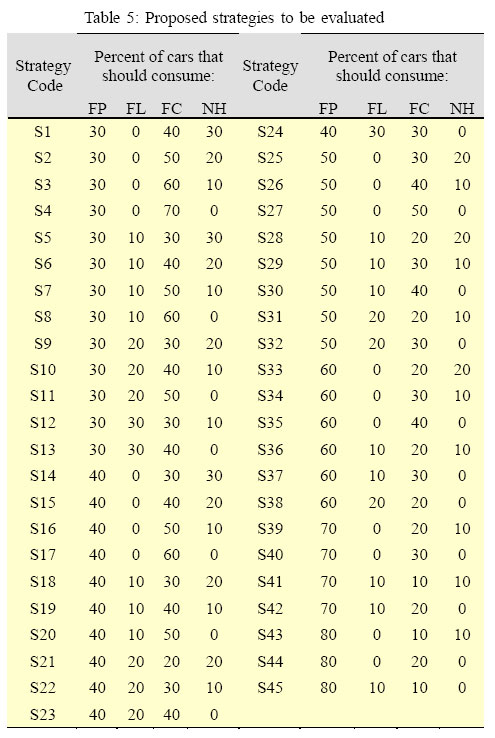
passenger cars consuming different fuels. Table 4 lists
a set of strategies which can be applied for Iran's passenger car fleet. To find comparable measures for
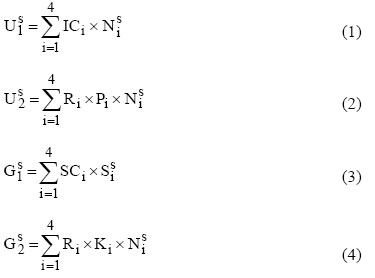
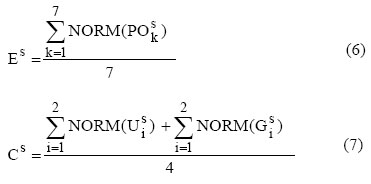
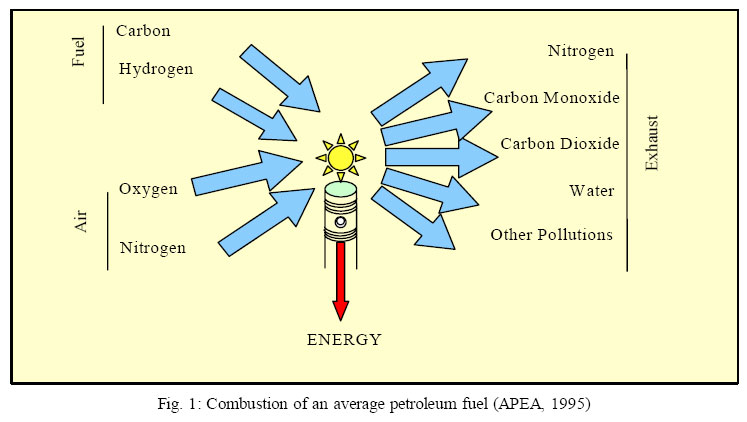
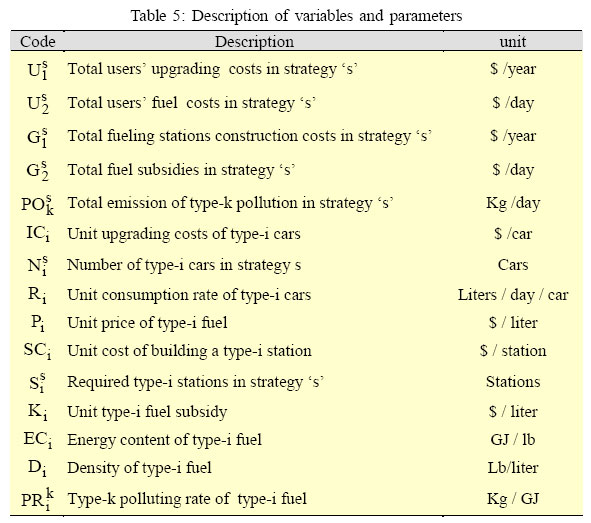
where U1s is total costs in each strategy 's' paid by users for either adapting their owned cars, or purchasing more expensive cars, which consume alternative fuels, ICi is the amount of such cost for each car that consumes fuel 'i', Nsi is the number of cars that use fuel 'i' in strategy 's'. Us2 is total costs in each strategy, s, paid by users for purchasing fuels, Ri is therate of consumption of fuel 'i' byeachcar, Pi is the unit price of fuel 'i'. G1s is total government costs in each strategy, s, for constructing new fueling stations, SCi is the cost of building a station for fuel 'i', Sis is the number of required stations for fuel 'i' in each strategy's'. Gs2 is total government costsineach strategy, s, for subsidizing fuels, and K is the amount iof subsidy for each unit of fuel 'i'. The environmental aspect of strategies in this study comprises total air pollutions emitting during a year. The different pollutions of fuels in each strategy are computed as follow:
where POsk is the total emission of pollution of type 'k' in strategy 's', EC is the energy content of fuel 'i', iDi is the density of fuel 'i', PRik is the polluting rate of type 'k' from fuel 'i'. Table 5 has listed the above parameters and variables and their units for a more convenient reference. The above equations are used for computations of total costs and pollutions of the country having the following assumptions:
Applying the previously-mentioned assumptions and equations will result in forming Table 6 which includes the total costs and pollutions of the country. It is worth noting that some of the columns have different unit base (per year and per day). Furthermore, there are two types of costs: U1s and G1s are capital costs that will be paid once for several years, while Us2 and Gs2 are operating costs. This will not affect on the final results, because the variables (columns of this table,) will not be added together before introducing to the HDT. Furthermore, they will be rescaled into a 0-1 interval, in order to assign equal weightings to the different aspects of fuels. The next step (after rescaling the values) is finding environmental and economic indices of each strategy. These are found by the following equations:
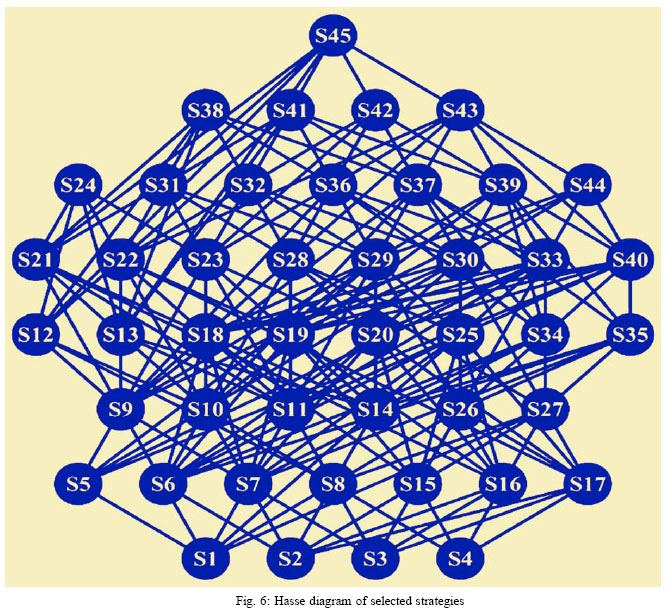
where (NORM) is the function that rescales the variables, Es isthe environmental index of strategy's', and Cs is the economic index of strategy 's'. These indices have been tabulated in two last columns of Table 6. Fig. 6 is the Hasse diagram of the 45 selected strategies. Because all of the indices (i.e. costs and pollutions) are undesirable, the relation for the poset is '<' and the lower strategies in this Fig. are better (i.e. more sustainable) than the others. DISCUSSION AND CONCLUSIONThe results confirm that 4 strategies at the lowest layer show better performance comparing with the others. They are S4, S3, S2 and S1. However, the strategies of the second layer also, show first layer and the 6 ones of the second layer, S4 and S3 acceptable results. The number of comparable elements are in better situation and 'second best' group include in the Fig. reveals that among the 4 strategies of the strategies S2, S1, S8, S7, S6, S5, S17 and S16. On the other hand, amongst the first 10 better strategies, fuels for Iran's transportation sector, and proposing those with lower percentage of gasoline are far from the strategies (the percent of cars consuming current situation of fuel status in the country (and alternative fuels along with gasoline), the best consequently more impractical). The result of ranking strategies were found using partial order theory and the 10 strategies with considering the pollution as the HDT. The Hasse diagram of the 45 selected strategies major criterion is S1, S2, S5, S3, S6, S4, S7, S8, S16 and revealed that 10 strategies showed better results than S17 and if the economic factors are of the major the others.They wereS4, S3, S2, S1, S8, S7, S6, S5, S17 importance, the result will be: S17, S4, S16, S3, S8, S2, and S16. The number of comparable elements in the S7, S1, S6, and S5. Finally as a conclusion, by Fig. and compatibility with the current situation of fuel considering both of the two mentioned factors (as consumption status in Iran reveals that among the 10 assumed in the partial order theory logic) and also strategies, S16 and S3 are the most sustainable compatibility with the current situation of fuel status decisions. Thus the proposed strategies of this study in Iran, the proposed strategies of this study are S16 are utilizing 40% (or 30%), 50% (or 60%), and 10% for and S3. To sum up, after selecting possible alternative gasoline, CNG, and hydrogen respectively. REFERENCES
© 2006 Center for Environment and Energy Research and Studies (CEERS) |
