 |
| About Bioline | All Journals | Testimonials | Membership | News |
|
||||||
|
||||||
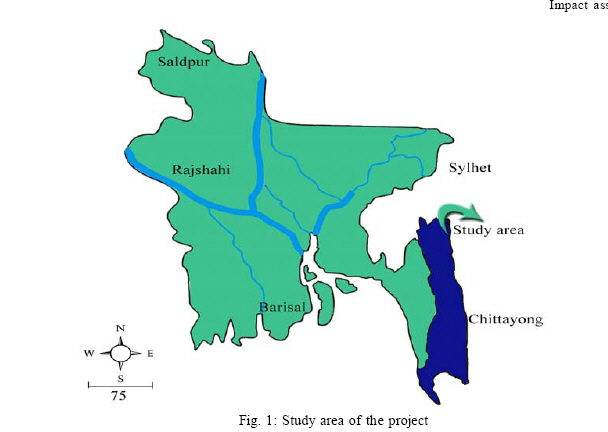
International Journal of Enviornmental Science and Technology, Vol. 3, No. 4, Autumn 2006, pp.391-402 Impact assessment due to rural electrification in hill tract of Bangladesh for sustainable development *1Dr. Md. J. B. Alam, 2M. R. Islam, 1R. Sharmin, 3Dr. M. Iqbal, 1M. S. H. Chowduray and 1G. M. Munna 1Department of Civil and Environmental Engineering, Shahjalal University of Science and Technology, Sylhet, Bangladesh Received 25 March 2006 Code Number: st06048 ABSTRACT: Environmental impact assessment (EIA) of any project is essential for understanding the sustainability of the project. For sustainable development of hill tracts, electricity is inseparable. Like other parts of Bangladesh hill tracts districts felt increasing demand of electricity. In this paper an attempt has been taken to present the existing environmental condition and analysis the future environmental condition after implementation of project. Electrification will extend the length of the active day. Electrification will improve security (people’s perception of safety and security) at the region. The elements of the project identified as components for analysis are chosen based on DOE’s guideline. The study showed that 87% people say that they feel safer at night since being electrified. Impacts are classified on the basis of EPA’s scaling and DOE, university’s teachers, NGOs expert’s opinions. Value more than 10 is classified significantly affected element of the project. In this paper advantages and disadvantages of the Electrification Project has been presented. Key words: Electrification, EIA, water pollution, air pollution, hill tracts INTRODUCTION The hill tracts is consisting of three districts, namely Rangamati, Khagrachari and Bandarban. It lies in the extreme southeast of Bangladesh between latitudes 21o 11´N and 23o 45´N and between longitude 91o 42´E and 91o 42´E. It is bordered in the southeast by Burma, in the east and north by the Asam and Tripura states of India in the west by the former Chittagong District of Bangladesh. The Hill Tract is divided into four valleys surrounded by the Feni, Karnaphuli, Sangu (Sankhu) and Matamuhuri rivers and their tributaries. Electricity is inseparable from modern urbanization and advanced life style. Like other parts of Bangladesh Chittagong Hill Tracts districts felt increasing demand of electricity. It is hoped that the rural electrification program in this region will carry out rapid change in all stages of life. For the development of this program, potential environmental impact assessment duringfeasibility study has been made in this report by the analysis of existing environmental condition with the recommendation of mitigation measures to be followed during implementation. This environmental assessment report has been prepared as per World Bank as well as local regulation guidelines published for the requirements of the DOE (Department of the Environment). EIA is an action forcing mechanism. For integrating sustainability and EIA of a project, EIA requirements as defined in EIA legislation, regulations and guidelines proposed by Lawrance (1997) and Byran (2005) has been followed by many researchers in a project (King, 1996 and DDC, 2004). The Environmental Impact Assessment report during feasibility study for rural electrification in Chittagong Hill Tracts has been prepared by considering some objectives. These objectives can be summarized as follow, 1) Exploring the existing environmental condition. MATERIALS AND METHODS The present environmental studies include multiple data collection from various primary as well as secondary sources for environmental analyses. Environmental parameters for the study were collected in three aspects; physical, ecological, physiochemical, and human interest related to these data. Site visit, literature review, observation, interviewing with key personnel and group discussion were the several methods followed. Interaction were made among DOE concerned government departments, non-government organization and local people in order to formulate views and suggestions for incorporating in environmental planning. Any large scale power plant installation is expected to cause environmental impact near the project site during construction and operation phases. The components of the environment vary with size, nature and geological location of the project. The EIA studies for the project site is divided into three phases. The 1st. phase identification of significant environmental parameters and assessing the existing status. 2nd. phase is prediction of impacts from proposed project and identified environmental parameters. 3rd. phases include the evaluation of total impacts. The EIA guidelines of Asian Development Bank (1998), DOE (1997) and United Nations Environment Program (UNEP), (2001) were followed in the assessment. EIA in a sustainable framework is applied in the study to get EIA requirements which is proposed by Lawrence (1997). Collected samples were analyzed for various water quality parameters as per standard methods (APHA-AWWA-WPCF, 1989). Collected air samples was measured followed by Rahman and Nag (2005). Description of existing environment Climate There are there main seasons, the dry season (November to March), which is relatively cool, sunny and dry, the pre-monsoon season (April and May), which is very hot and sunny with occasional shower, and the rainy season (June to October), which is warm, cloudy and wet. The region has tropical monsoon climate of hot and humid. Total annual average rainfall is second highest in Bangladesh (over 3500 mm). The monsoon rain starts in late May and continues till mid October. The depressions occur moving in from the Bay of Bengal and brings periods of heavy rainfall. The cool dry season lasts from November to February. According to the local metrological station, three hill districts are more or less uniform in rainfall, temperature and humidity (Khan, 2005). Temperature Mean monthly maximum temperatureranges between about 25-34 °C and the mean monthly minimal temperature between 12-25 °C. With clear skies in the dry season, there may be difference of 17 °C between night and day temperatures. But diurnal difference is much less during the rainy season. Maximum temperature is a few degrees lower and minimum temperature is a few degrees higher on the Shore of Kaptai Lake. Bangladesh Bureau of Metrological center, Rangamati recorded 30 years (from 1961 to 1990) monthly maximum, minimum and average temperature in Chittagong Hill Tracts Distracts, which is shown by Table 1. Rainfall The annual rainfall ranges from 80 inches (2000 mm) in the central north to 150 miles (3750 mm) south eastern border about 150 inches (3,750 mm) over 80% rainfall occurs between May and September pre-monsoon and monsoon rainfall typically in torrent downpours and flash of flood in the valleys. Table 1: Monthly maximum, minimum and average temperature in Chittagong Hill Tracts
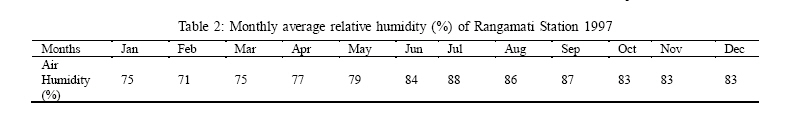
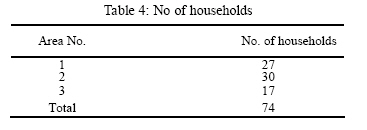
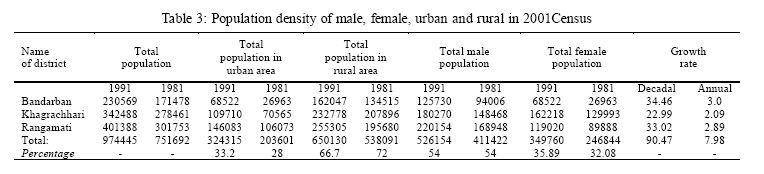
Khan (2005) The one day rainfall magnitude frequency relationship based on EVI distribution in Hill Tracts area is XT = 197.50- 60.18 in {T/ (T-1)} Where, XT = daily maximum rainfall magnitude T= return periods in year To establish an intensity-duration-frequency for the Hill Tracts regions of Bangladesh, the data was tabulated using Hershfield and Wilson diagram on the basis of available parameters and Bell equation. The parameters area means annual precipitation, mean annual number of days with rainfall greater than 0.01", mean annual maximum daily rainfall and mean annual number of thunderstorm days. Humidity Monthly mean relatively humidity figure range between 65 % in dry season and 90 % in monsoon season. But the humidity at night is almost same through out the year. The maximum and minimum moisture content in the air is found during July-September and January-March respectively. The monthly average relative humidity (%) of Rangamati Station 1997 is shown in the Table 2. Wind speed and direction This area include monsoon. In summer season (April to August) gusty wind blows over the area with speed of 60 to 80 km/h from south and south-west direction. It caries vapor from Bay of Bangle and causes heavy rainfall. At the end of spring (February to April), like other part of Bangladesh, cyclone strikes on this area from north and north-east direction. This stormy wind is obstructed by hill and blowing range fall gradually. Cyclone is a common phenomenon in the project area. It occurs in every year. Poor households are most affected by cyclone because of their houses are built by weak material. Geology and land forms The Chittagong Hill Tracts Districts area is geologically of recent origin comprising old Pleistocene sediment deposits. The general land feature comprises of a series of anticline ridge lying parallel to one another and trending in roughly NW-SE direction. They are composed largely of consolidated sandstone’s, sandy shale’s and shale’s of tertiary geological age. These have been subjected to considerable folding, faulting, tilting and dissection. The ridge crests reach heights of 100-3000 feet (300-1000 m) MSL. In the synclines between these main ridges, there are lower of hills below 250 m generally the height ranges between 42 m to 80 m and formed mainly over unconsolidated sandstone of late Tertiary age. Some of these hills are leveled or of rounded summits, but most of them are closely dissected and sharp ridge. All most everywhere in the Hill Tracts, slope is very steep. Soil Soil patterns often are complex due to rapid changes in the underlying lithology, differences in relief and the varying extent of soil erosion. The most extensive hill soils are brown, loamy and strongly acid, with rapid permeability and low moisture-holding capacity. Except over hard rocks, they are generally deep. Valleys soils include brown, loamy soils on well-drained terraces, Grey and clays on poor valley-bottom sites. Eleven soil series were identified .One extensive series was divided into deep and shallow phases. Gently, moderately and steeply sloping phases were also identified. Seismicity The greater Chittagong Hill Tracksdistrictsexperience tectonicmovementin previous years. Tectonic movement in 2002 was measured 5.5 in Racktor scale. As its intensity was mild no damage or human casualty was recorded during occurrence. Mild to moderate unperceived movement are frequently felt in greater hilly region of India and Barmes area. Vegetation and land use The entire hill districts have typical vegetation and tropical evergreen and deciduous forest. There are trees like Sal, Teak, Chapalish, Mehagoni, Kari, Chambal, etc. In addition, there are plantation of Pine and other foreign trees in the reserved forest. The tribal people traditionally practice Jhum cultivation by clearing the natural vegetation and burning it during the dry season. These practices destroy the existing natural vegetation pattern in reserved forest. By tradition, Village headman allocated land to Jhum cultivation. The Jhum cultivators do not have own land. Permanently settled cultivators have allotted land in which they have heritable rights but they cannot transfer the land outside their family without Government approval. When population density was lower, the successive cultivation periods were 12 years or longer. Now, with greater pressure on the land, especially following the creation of Kaptai Lake, which submerged most valuable floodplain in the reason, a period may be less than five years. As a result, the soil fertility is increasing and reversible degradation of the environment is taking place. River system The main rivers in the hill districts are: a) Karnafuli b) Halda c) Ichamoti d) Sangu e) Matamuhuri f) Kaselong and g) Franches Feni. In addition there are smaller streams and rivulets. They are tributaries to the main rivers. The Feni river originates in the northern part of Khagrachhari district and flows into the Bay of Bengal through the district of Feni. The Karnafuli River with its tributaries is the biggest and most important river. Hydro electric project was built on this river in 1962. As a result Kaptai Reservoir Lake has been formed during next monsoon. The Halda and Ichamoti rivers fall into the Karnafuli below the Kaptai Dam. The Karnafuli flows into the Bay of Bengal. The Chittagong Sea port has been established on the outfall area of Karnafuli river. The Sangu river originates in the high hills of the Bandarban district and after passing through several valleys it takes a westerly direction and flows into the coastal plain of Chittagong and ultimately debauch into the Bay of Bengal. The Matamuhuri originates in the southern most part of the high hills of Bandarban and after flowing in northerly direction takes westerly turn and fall in the Bay of Bengal near Cox’ Bazar. All the hillyrivers are subjected to flash flood during monsoon. Again during dry season tidal flow penetrates through the river outfall and proceeds up to considerable length of the channel upwards. In addition the rivers and Khals there a few springs of artesian and non-artesian native and water discharge hicuts from hills to plain called “Chara”. Biological environment The Hill Tracts District is very rich with diversified flora and fauna. Districts of Chittagong Hill Tracts region. The flora of this region shows a considerable admixture of Cachar and Khasia elements. The forests of Hill tract district may be broadly classified into tropical evergreen semi evergreen and deciduous types. Natural hazards Tectonic hazard Thegreater Chittagong Hill Tracksdistricts experience tectonic movement in previous years. Latest tectonic movement was in 2002. It was measured 5.5 in Racktor scale. As its intensity was mild no damage or human casualty was recorded during occurrence. Mild to moderate unperceived movements are frequently felt in greater hilly region of India and Barmes area. Land sliding Land sliding is a problem associated with hill cutting. Hill cutting is a common phenomenon in Hill Tracks due to increased population rise. High rainfall and improper handling of hills intensities in these areas lead to sudden collapse of hills. Social environment The area is hilly and very scanty of plane cultivate land. Most rural tribal dependant on traditional jhum cultivation for their livelihood. The area is backward in respect of education, financial ability transport and communication in regard to living standard. As per the methodology, sample respondents were selected for the survey work. The socioeconomic data were collected structured and non-structured questionnaires, researcher’s observation and PRA method. Subsequently these have been scrutinized and analyzed. The main objective of the study is to assess the technical, financial, economical, social and environmental feasibility for emboldening the CHT districts with a view to develop the area and sustain the development of infrastructure and human life of the locality. The socioeconomic component of CHT area comprised the major population characteristic, household composition, ethnic characteristics, land ownership pattern, income distribution, education, health and sanitation, economic participation, social stratification, land use pattern, livestock situation, agriculture production, housing condition, gender related information and so on. The objective of this component is to identify the basic socio-economic and demographic characteristic of CHT Districts and suggest option indicating the expected out put i.e. socio-economic benefit and project implementation and policies issues. This information may be useful as a guide for judging the relative viability of the project. Firstly, three areas of the Hill Tracks were selected in order to generalize the findings for whole study area. The area-wise distribution of house holdings was taken into account as the universe, which were 731 of which no. of government households are 36. Government households consist of govt. offices, schools etc. The area authority provided the household-list. It was maintained that the sampling error would remain to a certain limit so that in the future analysis the confidence level will be 95%. Then systematic sampling was done. Every 10th. household’s family chief in every ward was interviewed based on questionnaire. The distribution of the respondents was as follows by number of households (Table 4). Therefore, the randomness of the sample, which was 74 in size, was kept. In each unit, proportionate representation of social class was maintained in selection of the households. However, in order to present the actual picture of the existing condition of area, in terms of social categories samples were distributed as follows: poor 47, middle 20 and rich 7. Number of poor and middle class respondents was proportionately much higher like the universe and henceforth it can easily be assumed that the sample represents the population exactly. Using a face-to-face technique, empirical data were collected for the study by sample survey method where the universe contains all the area. Based on the information and the data, collected from the first visit, several meetings of the team members were held and an interim test informationchecklist was prepared. The information-checklist was pre tested in the non-sampled area through a pilot survey before finalization. The final informationchecklist contained both precoded and open ended questions (Table 3). The above two Tables are shown that the Integral population of the three districts gradually increased over the 30 years from1981 to 2001. Though an opposite figure found in preference of living area in favor of either rural or urban areas. Approximately 66.7 % of the whole population trends to reside in rural areas, despite are developed communication and lake of modern living facilities most tribal communities are well preferred to lead rustic natural life. However a distinguish variation is continue between male and female ratio. In 1991 about 54 % of total population was male whereas female occupied 35.89 %. This variation also appeared is 2001 that forecast number of male will dominate on total population also percentage of female increase 10% after1991 and reach 54% in2001. The vast majorityof the respondents 60.3% opined that the existing medical facilities in study area were not adequate. In case of illness, 50% of the household members were found treated by private practitioners holding MBBS degree or above followed by over 68.29 % by the govt. hospital. Only 9 % household members used to go to the private clinics. LMF doctors treated the rest of the household members when they got sick. About 36.2% of the household members were found to be attacked by several diseases during the last six months during the study. The prevalence of fever and cold seemed to be high among the study population. Majority of the household members (42.7%) suffered from fever followed by 10.5% cold and 7% eye diseases. While the remaining 40% suffered from other disease including diarrhea, jaundice and anemia. With regard to structure of the drains it was found structurally unsound. The numbers of dustbin (10 out of 25) in the locality were found insufficient. As a result, many people used to throw their solid wastes and other garbage into the street or street side drains. Most importantly, the area garbage collectors were hardly found during the time of data collection. Lack of awareness, lack of dustbin, improper maintenance of drainage and lack of drainage facilities are the mean reason of reporting of 78 % of respondents about the insufficient drainage facilities. Electrification will extend the length of the active day. In the most of the electrified households, people will work up layer at night than they didbefore electrification. Electrification will reduce wood consumption, deforestation, environmental degradation etc. Electrification will create very insignificant improvement in education because tribal people have less interest for reading and studying. It is difficult to measure the influence of electrification on health. A study by Wmukonya et al. (UNEP, 2001) showed that 54% households’ health was improved by electrification. So, it can be assumed electrification will cause positive influence on health at hilly region. Electrification will improve security (people’s perception of safety and security) at the region. A study by Wmukonya et al. (UNEP, 2001) showed that 87% people say that they feel safer at night since being electrified. Electrification will not create significant impact on nitrification, diversification in income generation activities within a short time. Environmental degradation due to project World economic and technological activities are contributing to rapid and potentially stressful changes in the global environment. These changes may profoundly affect generations to come. Technological activities are essential for the country to meet the needs of present and future generation. Any activities create pollution. To construct a double circuit 230 KV aerial power transmission line in Chittagong also have effects on components of environment -soil, air, and water. Water pollution The main rivers in the hill districts are: a) Karnafuli b) Halda c) Ichamoti d) Sangu e) Matamuhuri f) Kaselong and g) Franches Feni. In addition there are smaller streams and rivulets. The project area is nonindustrial area. There is no major specific source of surface water pollution. In rainy season rivers receive agrochemical, domestic wastes and sand mix pollutes this water is useless for domestic purposes. Physical appearance of river water, observed muddy during field survey. Due to the project zinc pollution is increased due to using the zinc coating on the surface of electric poles. Presence of zinc in nearby tube-well is a matter of concern. Air pollution Air quality depends on substance, which is present in atmosphere in such concentrations that they produce undesirable effects on human, animals and plants. These substances include CO2, CO, SOX, NOx and suspended particular matters (SPM). The combustion of hydrocarbon fuel in a motor vehicle products mainly carbon dioxide (CO2), water (H2O) and nitrogen (N2). Engine inefficiency means some fuel passes through the engine un-burnt or partially burnt. These results in the additional presence in exhaust emissions of the hydrocarbons (HC) and other organic components, together with carbon dioxide and carbon. At the high temperatures and pressures some nitrogen is oxidized to form various oxides of nitrogen, hydrocarbon, carbon dioxide and nitrogen dioxide have implications for human health and plant life and regarded as pollutants. The project location is non-industrial area. There are no mentionable sources of air pollution were found in project area. Though some local brick fields, motor transport and military vehicle available here. The emission level of those transport and brick fields very allowable according to Bangladeshi standard. Beside this area is naturally very tranquil. Particulate Matter is emitted from the majority of road vehicles, with diesel vehicles known to produce many higher particulates concentrations than petrol engines, notably PM10 and PM25 are thought to be linked to health impacts. In Bangladesh PM10 is referred to as Total Suspended Particulates. Lead compounds in vehicles exhausts are toxic and readily absorbed into the body. CO2 is also now considered to be a pollutant because of its contribution to the possible warming of the earth’s atmosphere. However all the main pollutants emitted from vehicle exhausts disperse widely into the atmosphere and their concentration reduces rapidly with the distance from the road. The concentration emissions are also related. The highest concentrations of CO, CO2 and HC are encountered in congested slow moving traffic. This kind of pollution is not going to affect the project site as the transmission line project does not add any kind of such pollution. Noise pollution Noise pollution survey was not conducted in the project during its operation will not create any kind of noise. During the construction period, there is no possibility of production of any kind of noise, which may excite the permissible limit. The values of noise meter were found (mean 56 dB, highest 65 dB, and lowest 43 dB) within the permissible limit. Soil pollution Loss of land is a problem for the people of the project area. It may arise social problem. The collection of soil from thesurrounding areastofill the project maycreate impacts on agriculture Surface water The Bay of Bengal lies in the Southwest directions from thee hill tracks districts. Bandar ban district closes to Bay of Bengal. Other two districts remote from Bay ofBengal. The other two districts are littleawayBay of Bengal. Monsoon rain is the chief source of surface water, which flows through the rivers in the form of excess run off. During the monsoon the rivers level remain high but during the dry period the level drops low. The difference between high and law level may be 25-30 ft (7.5-9 m). Being hilly streams the velocity of flow is considerable high and estimated as 2.50 m to 3.50 m/sec. In the Kaptai Lake the difference of high and low level is 113 m. The highest depth near the dam is about 50 m. During the winter months, temperature remain almost constant at depths. In the pre-monsoon, the upper layer s gradually warm op and a temperature difference develops which may go up to 6 °C between the highest and the lowest. Oxygen constant of the lake water varies between 5 ppm to 6 ppm from to bottom. As the water surfaces warm up a density gradient develop oxygen depletion occur in the deeper layer, which move up to a stage of 25 to 50 ft. From mid May cooling effect is created on the surface due to rainfall. By the end of the May mixing of water oxygenates the whole depths of water again but the lowers layers remain mostly deoxygenated. It is probable that the frequent rainfall and inflow of river water in the lake maintain a move uniform condition during the monsoon. But after the monsoon a time comes when the deeper layer of the lake water again become anaerobic. In winter water pH was 7-7.5 at all depth. As stratification occurs there was shift to more alkalis condition at the surface (pH = 7.5-8) and more acid condition at depth 40 ft with constant neutrality at around 20 ft (6 m). The surface water reaches pH = 9 in the pre monsoon season. This may have been due to presence of a particular phytoplankton (Alam, 1993). All human activities are centered on availability of water. Habitation settlements grow near to the river, lakes and spring, the reason is easy access to surface water stream, lakes and spring water are used for domestic and potable purposes during the dry periods. The monsoon water remains turbid and full of organic and inorganic material as such their use in restricted. Sources of pollution The project area is non-industrial area. There is no major specific source of surface water pollution. In rainy season rivers receive agrochemical, domestic wastes and sand mix pollutes this water is useless for domestic purposes. Physical appearance of river water, observed muddy during field survey (Alam, 1993). Ground water The Chittagong Hill Tracts in southeastern Bangladesh. The geology of the area is complex and is characterized by a series of folded tertiary formations .The area is considered unfavorable for extensive ground water development. The aquifer have low transmissivites and intensive development would therefore incur large draw down. However, wells can be developed successfully on an individual basis. Electric power transmission lines are linear facilities. That will affect natural and socio-cultural resources. The effect of short transmission lines can be localized. Long transmission line can have regional effect. In general, the environmental impact of transmission line occurs to natural, social and cultural resources increase withincreasing linelength. As linearfacilities, the impact of transmission lines occurs primarily within or in the immediate vicinity of ROW. Magnitude and significant of impact increase voltage of the line increased, requiring larger supporting structure and Rows. Operational impact also increases. For example, electromagnetic field (EMF) effect is significantly greater for 1000 kilo volt lines than for 69 kilo volt lines. Negative environmental impacts of transmission line are caused by construction, operational and maintenance of transmission line involves chemical or mechanical control in the ROW, and occasional line repair and maintenance. These plus the physical presence of the line itself can be a source of environmental impact. On the positive side, power line ROWs when properly managed can be beneficial to wild life. Cleared areas can be providing feeding and nesting site for birds and mammas. The edge effect documented in biological increasing habitat diversity resulting contact between the ROW and existing vegetation. Special issues Effects on lands in project area
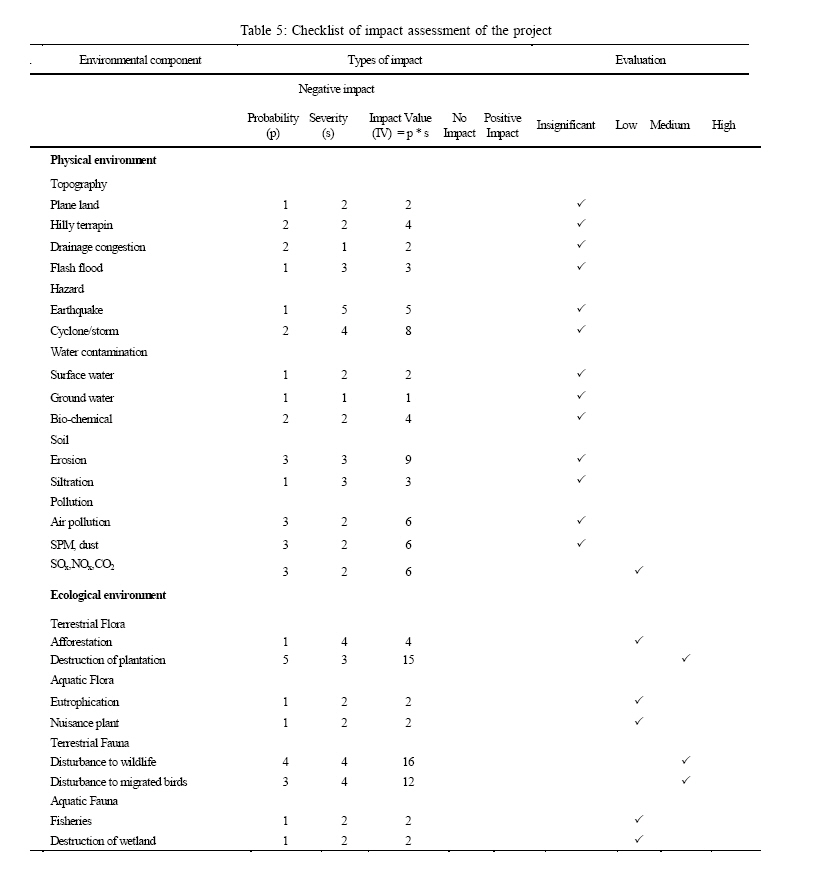
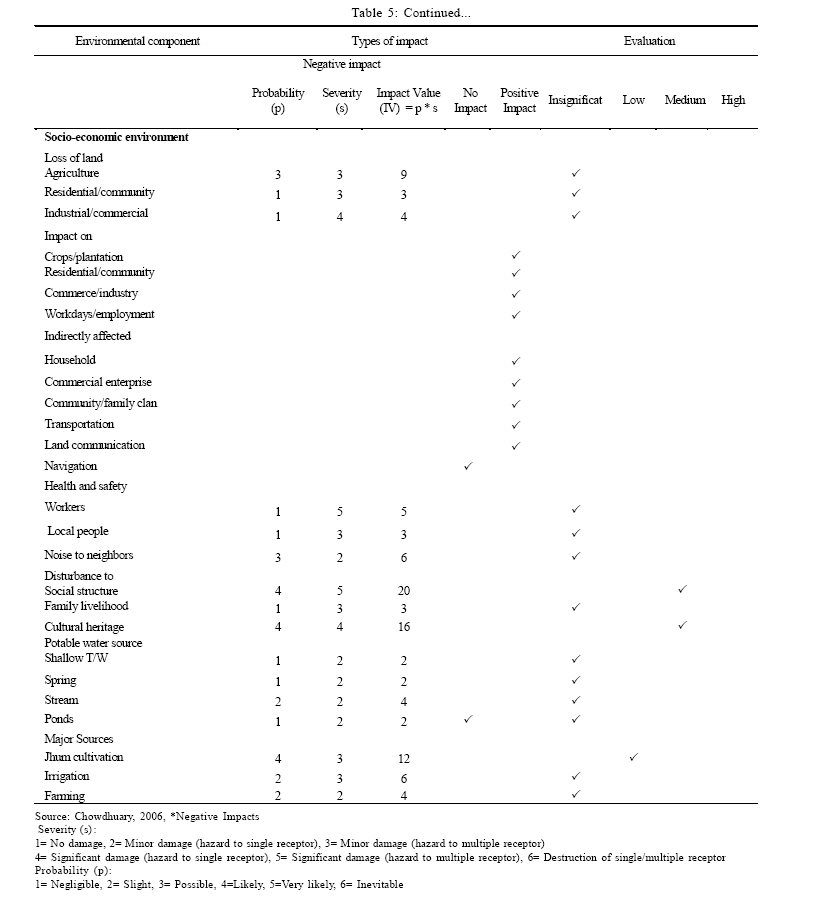
RESULTS Depending on the location, transmission line may induce development in or bordering on ROW or lands made accessible which is turned to develop infrastructure or public service. An environmental baseline survey was conducted in the project areas to identify the environmental parameters likely to be affected by the project intervention. All the major environmental parameters covering ecological, physiochemical and human interest related aspects were considered in identifying the affected areas at different stages of the project cycle. A checklist of the screened environmental parameters is prepared as shown in Table 5aand b. Anticipated environmental impacts due to project implementation have been identified and shown in the Table 4. This Table of comprehensive list of environmental parameters, their consequence and impacts are very useful in designing various activities of proposed project in an environmental friendly manner. The magnitudes of environmental impacts are classified as none, minor, moderate and major in the checklist. Socioeconomic environment is considered to affect positively as the project activities will creates job opportunity for the local people and the area will be more developed and commercial activities will be increased in the local community. Mitigation measures of the adversely affected parameters will be discussed in the subsequent section. Table 5a and b shows the overall impact assessment checklist for analysis of the sustainability of project. DISCUSSION AND CONCLUSION It is clear from the analysis that loss of land is a problem for the people of the project area. The collection of soil from the surrounding areas to fill the project may create impacts on agriculture. Electric power transmission line may have greatest impact on land resources. So dedicated electric power transmission line (ROW) is required. There is insignificant impact on health and safety sector, water resources sectors, socio-economic sector etc. There is low impact on air pollution, agriculture and aquatic flora. Impact on terrestrial fauna is medium risky. It is clear from the overall analysis; the project has positive impact on the sustainable development and lifestyle of people. Air pollution is not going to affect the project site as the transmission line project does not add any kind of air pollution. But during construction phase, for prediction of SPM, NOx and SO2, Gaussian plume dispersion model has been used. During summer season the predominant wind direction is from NW, SW and W direction. Predicted results have been superimposed over baseline data for 1 to 10 km and for 24 h in 16 directions. Results shows that the maximum concentration of SPM, NOx and SO2, are 451.64, 44.43 and 24.27 µg/m3 respectively in NE direction about 3 km from the construction site. The sound pressure generated by a noise sources decreases with increasing distances from the sources due to wave divergence. In predicted noise level wave divergence model have been used. The noise level inside the plant is measured at a distance of 2 m from the source and then the noise level (in dBA) due to proposed plant have been calculated at a distance of 500 m to 1000 m at a interval of 500 m. Inside the plant it was assumed 92 dBa based on study of other power plant (MEF, 1989). Before the conclusion, some brief description of the impacts on society and environment is presented. Due to the project implementation, zinc pollution is increased due to using the zinc coating on the surface of electric poles. Presence of zinc in nearby tube-well isa matter ofconcern. In winterwater pHwas 7-7.5 at all depth. As stratification occurs there was shift to more alkalis condition at the surface (pH = 7.5-8) and moreacid condition at depth 40 ftwith constant neutrality at around 20 ft (6m). The surface water reaches pH 9 in the pre monsoon season. This may have been due to presence of a particular phytoplankton (Alam, 1993). Loss of land is a problem for the people of the project area. It may arise social problem. The collection of soil from the surrounding areas to fill the project may create impacts on agriculture. During the construction period, there is nopossibility ofproduction of any kind ofnoise, which may excite the permissible limit. The values of noise meter were found (mean 56 dB, highest 65 dB, and lowest 43 dB) within the permissible limit. Considering the whole projects, the positive and negative impacts are classified on the basis of EPA’s scaling and DOE, university’s teachers, NGOs expert’s opinions. Those are Jhum Cultivation (scale value 12), Cultural heritage (scale value 16), Disturbance to wildlife, Disturbance to migrated birds, destruction of plantation and social structure (Scale value 20). But it would appear that project should have much more positive impacts as regards their environmental and social benefits relative to before the project implementation. Environmental management plan for the proposed project includes (i) road within the plant should be properly maintained and water spraying should be done weekly. (ii) All the leakage points should be plugged (iii) noise attenuating devices like ear plugs, ear muffs should be provided during operation and construction and (iv) Machinery and equipments should be checked properly. REFERENCES
© 2006 Center for Environment and Energy Research and Studies (CEERS) The following images related to this document are available:Photo images[st06048t2.jpg] [st06048f1.jpg] [st06048t4.jpg] [st06048t1.jpg] [st06048t5b.jpg] [st06048t5a.jpg] [st06048t3.jpg] |
| |||||||||
