 |
| About Bioline | All Journals | Testimonials | Membership | News |
|
||||||
|
||||||
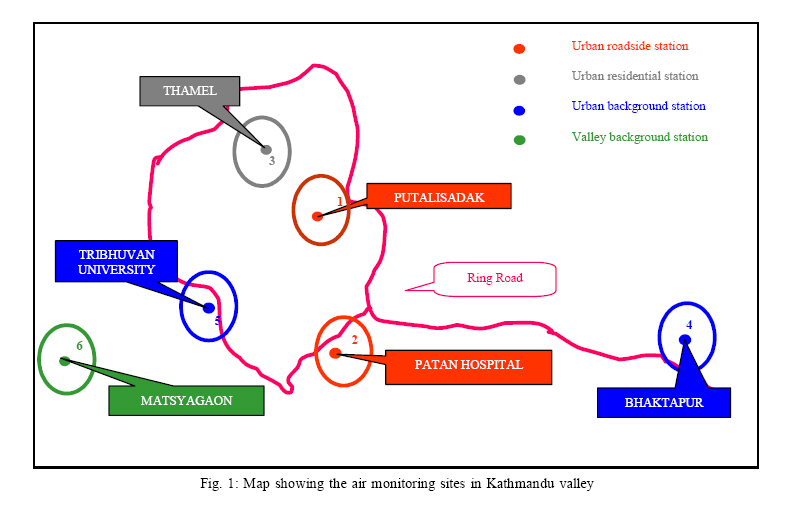
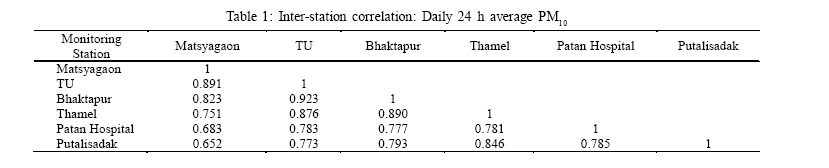
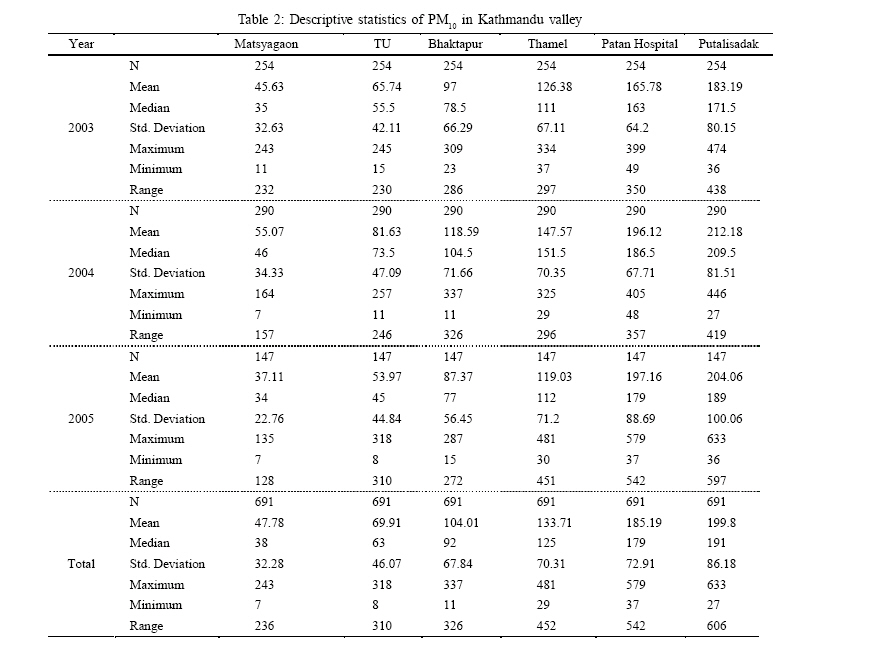
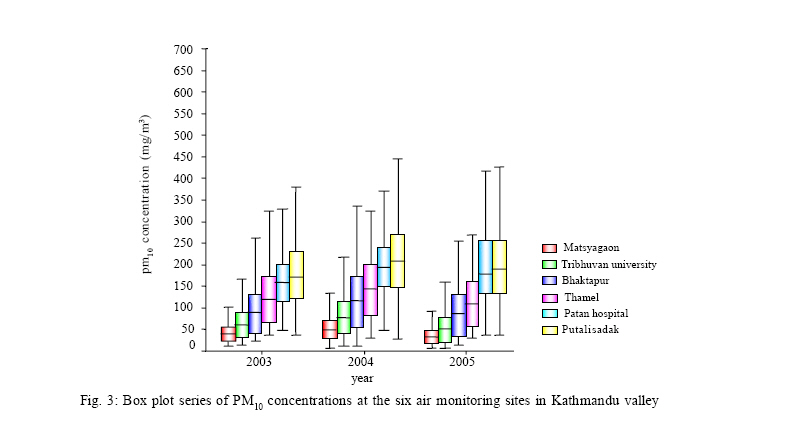
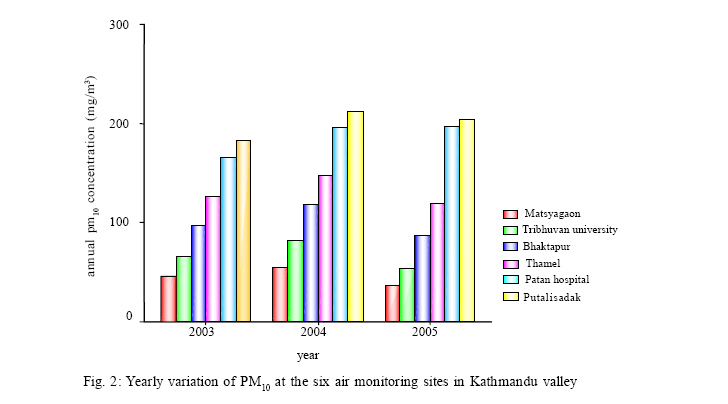
International Journal of Enviornmental Science and Technology, Vol. 3, No. 4, Autumn 2006, pp.403-410 Ambient air quality of Kathmandu valley as reflected by atmospheric particulate matter concentrations (PM10) 1D. Giri, 2* K. Murthy V., 3P. R. Adhikary, 4S. N. Khanal 1Department of Mathematical Sciences,Kathmandu University, Dhulikhel, Kavre, Kathmandu, Nepal Received 3 July 2006 Code Number: st06049 ABSTRACT: This paper presents the analysis and interpretation of ambient particulate matter concentrations measured as PM10 at a network of six air monitoring stations in Kathmandu valley during the years, 2003 through 2005. The purpose was to understand the pollution trends associated with different areas considering levels particulate matter concentrations representing the ambient air quality of Kathmandu valley. The study indicate that particulate concentrations (PM10) measured are persistently higher at air sampling sites representing roadside areas compared to the background sites. The inter-station network variability with respect the particulate pollution suggests optimizing resources. The comparison of annual average PM10 concentration observed at six air-monitoring sites in Kathmandu Valley with standard annual average concentration prescribed by World Health Organization as well as Europe Union indicates serious PM10 pollution in Kathmandu valley. Key words: PM10, air monitoring network, particulate pollution and annual averages INTRODUCTION Rapid unplanned urbanization, high influx of population, ever increasing automobiles and industrialization amidst urban areas are among the chief sources to result increased air pollution. Smaller size particulate is most likely to cause adverse health effects. Particulate matter with aerodynamic size less than 10 micrometers called PM10 can be inhaled into the thoracic and move to lower regions of the respiratory tract and possesses inherent potential to induce harm. Epidemiological studies indicate that adverse health impacts can result from exposure to PM10 at concentrations commonly experienced in many urban areas. Health impacts include aggravation of existing respiratory disease and decline in lung function. Studies in a number of cities have shown increases in morbidity and even mortality rates are positively related high PM10 levels (Bates, 1990; Burnett, 1995; Dockery, 1992; Thurston, 1992; Pope, 1995; Schwartz, 1993; Ostro, 1991; Roemer, 1993). Kathamandu Valley city, capital of Nepal has recorded sharp increase in these sources of air pollution. A previous study reports suggest that the total suspended particles (TSP) and PM10 values observed at different sample sites in the valley were found to be higher than the WHO guideline values at all except residential and control sites (URBAIR, 1997; WHO, 1999). Atmospheric visibility measurements can serve as a surrogate for optical air quality in general and for the smaller size fraction of particulates in particular. Studies of air pollution climatology of Kathmandu valley reports that deterioration in visibility in Kathmandu due to increasing number of vehicles. The main objective of this paper is to analyze and interpret the PM10 measurements in Kathmandu valley and to understand the pollution trends associated with different areas. MATERIALS AND METHODS Study area Nepal is relatively a small country with 147,181 sq. km area has 22 million people. The capital city Kathmandu valley (KV)comprisesofthree major urban places namely Kathmandu, Patan and Bhaktapur. Besides, highly urbanized, congested, central city parts as well as large, sparsely populated, limited vehicular traffic, agricultural lands with village municipalities. The KV is located between 27° 37’30" N and 27° 45’0" N latitude and 85° 15´0″ E and 85° 22´30″ E longitude (Fig. 1 ). It is about 1300 m above mean sea level and has a typical bowl like structure surrounded by high hill range whose altitude from the valley floor varies from 500m to 1400m. The valley floor area is about 340 sq. km and has current population of 16,45,091 (CBS, 2001). The valley possesses sub tropical, temperate climate. The year is divisible into four distinct seasons: pre-monsoon, monsoon post-monsoon and winter with annual mean rainfall of 1400 mm. The ambient air temperature may increase up to 35 °C during summer days and maydecrease up to -1°Cduring winter months. The relative humidity reaches more than 80 % during rainy season but decreases to about 50 % during dry season. Major part of the winds blowing over the valley is southwesterly and northwesterly. Wind speed lies in the range of 0.5-7.5 m/s. Air monitoring network Daily average PM10 concentrations were determined using samplers installed by Government of Nepal, Ministry of Population and Environment (MOPE) conducted at six sampling sites, within the Kathmandu valley area. Daily 24 h continuous air monitoring is carried out at in, urban traffic place (Putalisadak), urban hospital place (Patan Hospital), city core residential place (Thamel), urban background place (Tribhuvan University, TU and Bhaktapur) and valley background location (Matsyagaon). The air monitoring stations were located in all directions and represented predominant urban areas associated with high, medium and low human activities. This was done with an intention to get better spatial representation of the valley. The Putalisadak air-monitoring station located almost in the central region of the city represents city core urban area. The approximate distance of other air monitoring stations from Putalisadak was Thamel at about 2 kms (West), Patan Hospital at 5 kms (South), Tribhuvan University at 6 kms (South-West), Matysagaon at about 7.5 kms. (South-West) and Bhaktapur located at about 13 kms (East). Matsyagaon falls under village development category and hence provides background information. Putalisadak, Patan Hospital and Thamel are in the core city area. They have emerged as growing commercial centers of Kathmandu valley. The area with large commercial buildings and heavy vehicular traffic characterize this place. TU, at Kirtipur is close to the urban center in Kathmandu but located in outskirts. Bhaktapur is a different city about 13 km towards east from Kathmandu, however within the valley precincts. Bhaktapur area is having brick manufacturing plants in the 4 Sq. Km. areas around the air monitoring station. Air monitoring instrument and method In Kathmandu valley particulate matter concentration is monitored by standard method on daily basis. A Low Volume Sampler (LVS) for PM10 and PM2.5 without pneumatic movement of filters was used in order to select the most robust and simple instrumentation. The PM10/ PM2.5 sampler was type Instrumatic Model 85-02, designed according to the EN12341 standard. The PM10/PM2.5 sampler was designed specificallyfor use in the Kathmandu AQM programme, e.g. the sampler was equipped with 24 Volt pump in order to operate with a battery back up during electricity power breaks. Electricity supply disruptions are quite frequent in Nepal and can last from a few seconds up to 12 h. Instrument is capable of taking 24 h continuous ambient air sample, automatic, unattended operation and weekly shift of samples. The monitoring stations automatically collect 24 h samples through the eight filters mounted three meter above ground. The samples are collected once a week and analyzed in a local lab (Gautam, 2004). RESULTS This study presents the result of PM10 measurement conducted at six sampling sites, within the Kathmandu valley area during the year 2003 to 2005. As to get a better representation of PM10 concentration in the Kathmandu valleyand to delineateAmbient air quality of Kathmandu valley as reflected by atmospheric particulate matter concentrations (PM10), only those days were considered in which PM10 data were available in all six stations during the study period March 2003 to December 2005. A first qualitative analysis was conducted in order to observe the behavior of the PM10 concentration trying to point out possible common trends and particular event. The first step in this direction was the studies of simple linear inter air monitoring station correlation analysis, temporarily omitting the combined effects of other variables influencing PM10 concentration in the valley. Pearson coefficients of correlation for PM10 concentration, as calculated between the monitoring sites, are displayed on Table 1. All correlations were found significant (at the 0.05 level). Although the concentration levels exhibit significant spatial variability, the strength of Pearson’s coefficient correlation between Bhaktapur and Tribhuvan University (TU) was higher than other air monitoring station. The reason was that they are located out side the ring road area. The strength of correlation of Putalisadak with Thamel was found to be higher than other air monitoring station. The reason was that they are located within the city core area and their aerial distance is very close to each other. The strength of relation of Matsyagaon with TU was found to be higher than other air monitoring station. The reason was that they are located at the outskirt of the cityand that they are mutually close by aerial distance. Similarly the strength of relation of Patan Hospital with Putalisadak air monitoring station was higher than other air monitoring stations. Both of them are at the urban areas of the valley.Table 2 depicts descriptive statistics of PM10 concentration in different air monitoring stations during the study period. Although the concentration levels exhibit significant monitoring stations. Both of them are at the urban areas spatial variability, the strength of Pearson’s coefficient of the valley. Table 2 depicts descriptive statistics of correlation between Bhaktapur and Tribhuvan PM10concentration in different air monitoring stations University (TU) was higher than other air monitoring during the study period. The highest daily average station. The reason was that they are located out side PM10 mass concentration (633 µg/m3) for the study the ring road area. The strength of correlation of period was recorded at Putalisadak air monitoring Putalisadak with Thamel was found to be higher than station in the year 2005. Within the Kathmandu valley other air monitoringstation. The reason wasthat they daily 24-h average PM10 ranged from 7 µg/m3 are located within the city core area and their aerial (Matsyagaon in the year 2004 and 2005) to 633µg/m3 distance is very close to each other. The strength of (Putalisadak in the year 2005). The lowest and highest relation of Matsyagaon with TU was found to be higher average annual concentration during the study period than other air monitoring station. The reason was that was found 47.78 g/m3 and 199.80 µg/m3 respectively at they are located at the outskirt of the city and that they Matsyagaon and Putalisadak air-monitoring sites. are mutually close by aerial distance. Similarly the According to annual average PM10 concentration, strength of relation of Patan Hospital with Putalisadak ranked second, third and fourth are Patan Hospital, air monitoring station was higher than other air Thamel and Bhaktapur, respectively. The annual average concentrations in urban background site (TU) were 1.46 times higher than that observed in Matsyagaon where as the annual average concentrations in urban parts namely Thamel, Patan Hospital and Putalisadak were 2.80, 3.87 and 4.18 times higher than that observed in Matsyagaon. As there is no national ambient air quality standard for annual average concentration regulated by the Government of Nepal, the primary PM10 standards established by the US-EPA was used (annual average concentration 50 µg/ m3) for the purpose of comparison. A similar exercise has been done at a study conducted in Macau. Except Matsyagaon air monitoring station, regardless of the year, the annual average concentration at TU, Bhaktapur, Thamel, Patan Hospital and Putalisadak were found to be higher than standard 50 µg/m3. Using oneway ANOVA and Tukey HSD procedure on daily average PM10 values, the concentrations were found to differ significantly (at 0.05 level) between the years of air monitoring and also between the sites. Test of homogeneity of variance Levene test the variation on concentrations of PM10 values, were found to differ significantly between the years at Matsyagaon, TU, Bhaktapur and Patan hospital stations whereas in Thamel and Putalisadak air monitoring stations, PM10 values did not differ significantly (at 0.05 level). As the arithmetic means are not to close to each other, to compare the amount of variation in PM10 at different sites the coefficient of variation (CV) is used. During the study period the CV in Patan Hosplital (0.39) and Matsyagaon (0.67) were found to be least and highest respectively indicating that the PM10 values were more uniform in Patan Hospital site and highly dispersed in Matsyagaon site. Government of Nepal has set national ambient air quality standards; the maximum daily 24 h average PM10 concentration in ambient air is 120 g/m3. An ‘exceedance’ is in one when the pollutant measurement surpasses Nepal national ambient air quality standard for a specific averaging time. For depicting exceedances, the totals of 691 observations were considered. Concerning the 24 h limit value 120 µg/m3 as purposed by Government of Nepal, it was found that 31 exceedances in Matsyagaon (4.5%), 97 exceedances in TU (14.0 %), 239 exceedances in Bhaktapur (34.6 %), 358 exceedances in Thamel (51.8 %), 551 exceedances in Patan Hospital (79.7 %) and 569 exceedances out of 691 observations in Putalisadak (82.3 %). In Nepal, Ministry of Population and Environment (MOPE), has categorized five different types of air quality categories based on levels of PM10. The categories prescribed are range 0-60 µg/m3 as “Good”, 60-120 µg/m3 as “Moderate”, 121-350 µg/m3 as “Unhealthy”, 351-425 µg/m3 as “Very Unhealthy” and >425 µg/m3 as “Hazardous”. The same categories have been maintained for the purposes of interpretation following statistical analysis. The number of occasions on which the particulate concentration values have exceeded these prescribed cut off points is considered as a measure of pollution level. In Matsyagaon most of the observations were under good category (< 60 µg/ m3) and the PM10 level only occasionally exceeded the national standard. Percentage of observations falling under unhealthy category (121-350 µg/m3) were high in Thamel (51.5 %), Patan Hospital (77.1 %) and Putalisadak (77.7 %). In these monitoring stations a few observations even exceeded very unhealthy category (351-425 µg/m3). The box plots in Fig. 3 describe several prominent features of the PM10 concentrations recorded during the study period of different years. Regardless of the year, the length of whisker is longer towards the higher values of the PM10 concentration and shorter towards the lower values of the PM10 concentration and upper half of box is bigger than the lower half. The box plot revealed the distribution of PM10 concentration at different air monitoring sites in Kathmandu valley has positively skewed. The box plot further suggests the wide dispersion of the particulate concentration within the valley. 24 h PM10 data typically exhibit a strongly skewed distribution dominated by a large number of low values. PM10 concentrations also typically exhibit variation on a number of temporal scales: diurnal, hebdomadal (day of week), seasonal and annual. DISCUSSION AND CONCLUSION The fixture of air monitoring sites had considerations of representing predominantly associated activities characteristic to the places and areas. The sites represented very high motor vehicular traffic and commercial urban pocket (Putalisadak), urban area with hospital in place (Patan Hospital) an urban area with an educational university background (Tribhuvan University), urban residential pocket (Thamel) and two stations located far away from busy urban area, one at Bhaktapur representing semi-urban area and one representing predominantly village environment (Matsyagaon). A similar establishment of air monitoring sites and PM10 were considered only of those days in which PM10 monitoring conducted between years 1994 and 1999 data were available in all six stations. The reason to from the network of air sampling stations in Taiwan is resort to this was to get a better spatial representation reported (Kuang, 2002). However, for the analysis and of PM10 levels of the valley. The exercise of inter-site interpretation, the data of PM10 concentration values correlation was carried out to understand spatial variation of pollution concentration. This knowledge would facilitate efficiency of the urban air-monitoring network and also to effect modification of the network to improve the efficiency (Morawska, 2002). The correlation obtained with this perspective in the present circumstance indicate that very high correlation (0.923) between Tribhuvan University and Bhaktapur air monitoring stations suggesting that any one station is enough to represent urban background. Doing away with the other could facilitate identification of better background area and saving or other resources like finance, human resource not compromising with quality of information obtained. Test of homogeneity of variance Levene test, the variation on concentrations of PM10 values, were found to differ significantly between the sites. However, it can be observed that all the air-monitoring stations are inter-correlated but retain individual area characteristics due to the local topographical and particulate emission considerations. Regarding level of uniformity with respect to particulate pollution, during the study period more uniformity was observed in Patan Hosplital whereas at Matsyagaon uniformity was least indicating that the PM10 values were more uniform in Patan Hospital site and highly dispersed in Matsyagaon site. The Patan Hospital area thus is saturated with urban activities and hence pollution level is high and static. The picture at Matsyagaon is that it is village area associated with sparse human activities and therefore disperse nature of pollution was observed. Similar conclusion could be drawn with respect to noting of the difference on the average PM10 in Matsyagaon which was least and Putalisadak where the episodes of high exceedance to ambient standards was noted attributable to high vehicular traffic and dense population. It was found that values recorded at the urban background and sub-urban stations during the study period have exceeded the standard by about 1.40 and 2.08 times respectively whereas at the urban stations namely Thamel, Patan Hospital and Putalisadak have exceeded the standard by about 2.67, 3.70 and 4.0 times respectively. Annual average concentrations at all air monitoring stations in Kathmandu valleywere found significantly higher than the annual limit value of 40 µg/m3, which is proposed by EU (Grivas, 2004) The comparison of annual average PM10 concentration observed at six air-monitoring sites in Kathmandu valley with standard annual average concentration prescribed by WHO as well as EU indicates serious PM10 pollution in Kathmandu valley. A pollutant measurement surpassing Nepal national ambient air quality standard for a specific averaging time is referred to as exceedance. The annual average values indicate the nature of areas in a limited manner. But, to understand particulate pollution trends, depiction of number of episodes of exceedance and a comparison to the prescribed categories would be a better approach. Generally, exceedances are episodic and their frequency of occurrence reflects pollution level and air quality. The proportion of exceedances associated with air monitoring sites indicated that the stations located away from the inner city and outside the ring road; such as Matsyagaon, TU and Bhaktapur tend to have lower concentration regardless of the monitoring period. In contrast, the stations located at inner-city experience larger variations in daily concentrations due to varied land use, activities and consequent sources of emissions. From the analysis of data it was found that the quality of air in Matsyagaon was under ‘good’ category.The quality of air in TU and Bhaktapur was under the ‘moderate’ category whereas the quality of air in Thamel, Patan Hospital and Putalisadak were under Unhealthy category. The location and surroundings of these sites are quite similar therefore it can be assumed that the difference in the observed concentrations can mostly be attributed to the traffic. Due to the rapid growth of industrial activities, population and traffic density, people in Kathmandu are facing serious air pollution problems. The impact of air pollution related to traffic permanently increases due to augmentation of traffic intensity. Enhancement of the traffic component is particularly serious in urban areas and zones directly adjoining roads. Regarding dispersion of particulate pollution, the finding was that there was a wide dispersion of the particulate concentration within the valley region. The causes of these variations are multi-faceted and are related both to emission variability and to possible variations in geophysical variables such as mixed layer depth, wind speed and humidity levels. ACKNOWLEDGEMENT Sincere thanks to Mr. Chiranjibi Gautam and other officials of Ministry of Population and Environment, Government of Nepal for providing information needed for the study, analysis and interpretation of data. Authors are grateful to Prof. Suresh Raj Sharma, Vice Chancellor and Prof. Sitaram Adhikary, Registrar of Kathmandu University for their encouragement to continue research in air pollution. REFERENCES
© 2006 Center for Environment and Energy Research and Studies (CEERS)
The following images related to this document are available:Photo images[st06049f3.jpg] [st06049t2.jpg] [st06049t1.jpg] [st06049f2.jpg] [st06049f1.jpg] |
| |||||||||
