 |
| About Bioline | All Journals | Testimonials | Membership | News |
|
||||||
|
||||||
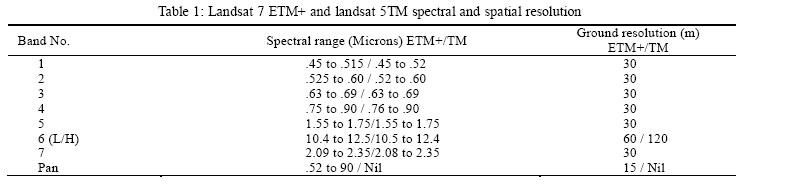
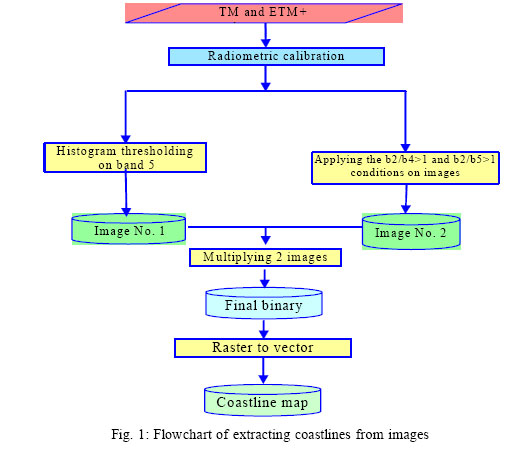
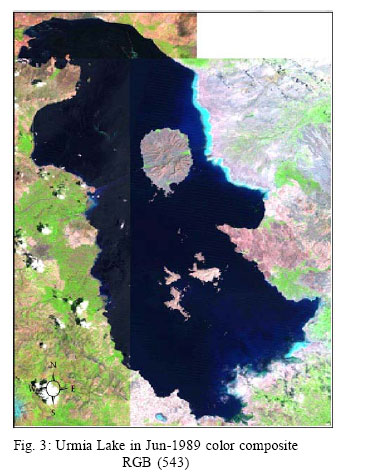
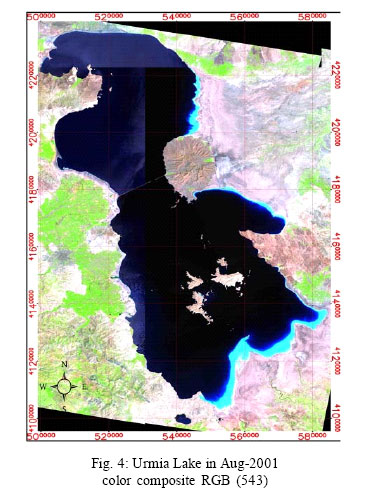
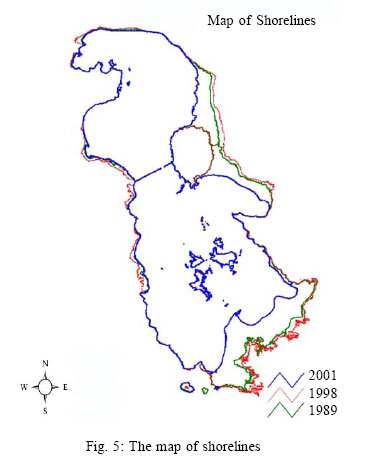
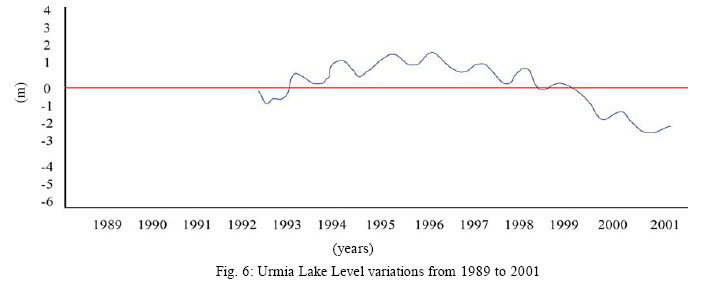
International Journal of Enviornmental Science and Technology, Vol. 4, No. 1, Winter 2007, pp. 61-66 Coastline change detection using remote sensing 1Alesheikh, A.A.; 2Ghorbanali, A.; 3Nouri, N.1Department of GIS Engineering, Khaje Nasir Toosi University of Technology, Tehran, Iran Received 1 October 2006; Code Number: st07008 ABSTRACT: Coast is a unique environment in which atmosphere, hydrosphere and lithosphere contact each other. Coastline is one of the most important linear features on the earth’s surface, which display a dynamic nature. Coastal zone, and its environmental management requires the information about coastlines and their changes. This paper examines the current methods of coastline change detection using satellite images. Based on the advantages and drawbacks of the methods, a new procedure has been developed. The proposed procedure is based on a combination of histogram thresholding and band ratio techniques. The study area of the project is Urmia Lake; the 20th. largest, and the second hyper saline lake in the world. In order to assess the accuracy of the results, they have been compared with ground truth observations. The accuracy of the extracted coastline has been estimated as 1.3 pixels (pixel size=30 m). Based on this investigation, the area of the lake has been decreased approximately 1040 square kilometers from August 1998 to August 2001. This result has been verified through TOPEX/Posidon satellite information that indicates a height variation of three meters. Key words: Coastline extraction, TM & ETM+ sensors, histogram thresholding, band ratios, remote sensing INTRODUCTIONCoastal zone monitoring is an important task in sustainable development and environmental protection. For coastal zone monitoring, coastline extraction in various times is a fundamental work. Coastline is defined as the line of contact between land and the water body. Coastline is one of the most important linear features on the earth’s surface, which has a dynamic nature (Winarso, et al., 2001). Remote sensing plays an important role for spatial data acquisition from economical perspective (Alesheikh, et al., 2003). Optical images are simple to interpret and easily obtainable. Furthermore, absorption of infrared wavelength region by water and its strong reflectance by vegetation and soil make such images an ideal combination for mapping the spatial distribution of land and water. These characteristics of water, vegetation and soil make the use of the images that contain visible and infrared bands widely used for coastline mapping (DeWitt, et al., 2002). Examples of such images are: TM (Thematic Mapper) and ETM+ (Enhanced Thematic Mapper) imagery (Moore, 2000). Coastline change mapping for Urmia Lake by TMand ETM+ imagery is the main aim of this paper. Furthermore, a new semiautomatic approach for coastline extraction from TM and ETM+ imageryhasbeen developed and presented. History From 1807 to 1927, all coastline maps have been generated through ground surveying. In 1927 the full potential of aerial photography to complement the coastline maps was recognized. From 1927 to 1980, aerial photographs were known as the sole source for coastal mapping. However, the number of aerial photographs required for coastline mapping, even at a regional scale, is large (Lillesand, et al., 2004). Collecting, rectifying, analyzing and transferring the information from photographs to map are costly and time consuming. In addition to cost, using black and white photographs creates several other problems. First, the contrast between the land and water in the spectral range of panchromatic photographs is minimal, particularly for the turbid or muddy water of coastal region, and the interpretation of the coastline is difficult (De Jong and Van Der Meer, 2004). Second, the photographs and the resultant maps are in a non-digital format, reducing the versatility of the data set. Labor intensive digitization is required to transfer the information to a digital format, and this process introduces additional costs and errors. The geometric complexity and fragmented patterns of coastlines compounds these problems. In addition to the above, other possible limitations are: (1) the lack of timely coverage, (2) the lack of geometrical accuracy unless ortho-rectified, (3) the expense of the analytical equipment, (4) the intensive nature of the procedure (Miao and Clements, 2002), and (5) the need for skilled personnel. In addition to high costs and difficulties, generation of coastline maps has fallen sadly out of date. From 1972 the Landsat and other remote sensing satellites provide digital imagery in infrared spectral bands where the land-water interface is well defined. Hence remote sensing imagery and image processing techniques provide a possible solution to some of the problems of generating and updating the coastline maps (Winarsoet, et al., 2001). MATERIALS AND METHODSStudy Area The study site of this investigation is Urmia Lake. The lake is located between latitude 37°N to 38.5°N and longitude 45°E to 46°E. Urmia Lake is the 20th largest and the second hypersaline lake in the world. The Urmia Lake covers an average area of 5,100 square kilometers. The maximum and average depth of this lake are 16 and 5 meters, respectively. Urmia Lake is listed as a biosphere reserve by UNESCO (United Nation Education, Scientific and Cultural Organization) (Birkett, et al., 1995). Also, it is recognized as a national park. The digital images used in this research are: three Landsat 7 ETM+ images; three Landsat 5 TM images; three Landsat 4 TM images. Table 1 shows the spectral and spatial characteristics of Landsat 7 ETM+ and Landsat 5 TM sensors. For this experimentENVI V3.5 and ERMapper software are used for all the image processing needs. Methodology Various methods for coastline extraction from optical imagery have been developed. Coastline can even be extracted from a single band image, since the reflectance of water is nearly equal to zero in reflective infrared bands, and reflectance of absolute majority of landcovers is greater than water. This can be achieved, for example, by histogram thresholding on one of the infrared bands of TM or ETM+ imagery. Experience has shown that of the six reflective TM bands, midinfrared band 5 is the best for extracting the land-water interface (Kelley, et al., 1998). Band 5 exhibits a strong contrast between land and water features due to the high degree of absorption of mid-infrared energy by water (even turbid water) and strong reflectance of midinfrared by vegetation and natural features in this range. Of the three TM infrared bands, band 5 consistently comprises the best spectral balance of land to water. The dynamic and complex land-water interaction in coastal Urmia Lake wetlands makes the discrimination of land-water features less certain, especially in marsh environments (Ghorbanali, 2004). The histogram of TM band 5 ordinarily displays a sharp double peaked curve, due to tiny reflectance of water and high reflectance of vegetation (Chen, 2003). The transition zone between land and water resides between the peaks. The transition zone is the effect of mixed pixels and moisture regimes between land and water. If the reflectance values are sliced to two discrete zones, they can be depicted water (low values) and land (higher values). But the difficulty of this method is to find the exact value, as any threshold value will be exact on some area, not all. Another method is to use the band ratio between band 4 and 2 and also, between band 5 and 2. With this method water and land can be separated directly. The ratio b2/b5 is greater than one for water and less than one for land in large areas of coastal zone. ERMapper software uses this ratio as an algorithm for separating water from land from TM or ETM+ imagery. This law is exact in coastal zones covered by soil, but not in land with vegetative cover. Actually, this law mistakenly assigns some of the vegetative lands to water. To solve this problem, the two ratios are combined in this investigation. Applying this method, the coastline can be extracted with higher accuracy. But the problem occurs in some of the coastal zones (i.e. in some areas, the coastline moves toward water). If the aim is rapid coastline extraction, then it is a supreme method. But when the aim is accurate coastline extraction, then it is not a fine method. To solve this problem, two techniques exist. In the first technique, a color composite can be used for editing the coastline map. The best color composite for this technique is RGB (Red Green Blue) 543. This color composite nicely depicts water-land interface. Furthermore, it is very similar to the true-color composite of earth’s surface. Moreover, it includes the bands that have low correlation coefficient, and therefore, it contains higher information in comparison to other color composites (Moore, 2000). However, this technique is time consuming and needs a lot of editing. In the second technique, histogram thresholding method is used on band 5 for separating land from water. The threshold values have been chosen such that all water pixels are classified as water, and most of land pixels have been classified as land. In this case, few land pixels mistakenly have been assigned to water pixels but not vice versa. Water pixels are then assigned to one and land pixels to zero. Therefore, a binary image has been achieved. This image is named “image No. 1”. The image obtained from band ratio technique, also labels water pixels to one and land pixels to zero. This second image is named “image No. 2”. Then the two images are multiplied. The final obtained binary image represents the coastline accurately. Fig. 1 illustrates the steps of the developed technique. RESULTSTo evaluate the accuracy of this approach, it is required to compare the extracted coastline with the extracted coastline from a ground truth map. Because of the lack of a reliable ground truth map, an imagedriven reference data is utilized (Alesheikh, et al., 1999). The ground truth image was provided via fusing the ETM+ multispectral bands with ETM+ panchromatic band. Then, the coastline from the ground truth image is extracted via visual interpretation. Next the two mentioned coastline data are compared, and the accuracy of the extracted coastline was estimated as 1.3 pixels (pixel size=30meters). Figs. 1, 3 and 4 illustrate mosaicked images of Urmia Lake in the years 1989, 1998 and 2001 respectively. These images are color composite RGB 543. Fig. 5 illustrates the coastline change map for Urmia Lake. Fig. 5 shows that the area of Urmia Lake in 1998 and 2001 equaled to 5650 and 4610 square kilometers respectively. Therefore, the area of this lake has been decreased approximately 1040 square kilometers from August 1998 to August 2001. DISCUSION AND CONCLUSIONTo compare the coastline map to Urmia Lake level variations, the obtained information from TOPEX/ POSEIDON satellite has been used. This satellite is in orbit at a height of 1330 km, and sends back information that measures the average ocean height very accurately (Jupp, 1988). Fig. 6 illustrates the relative lake height variations computed from TOPEX/ POSEIDON satellite data. Because of the lack of TOPEX/POSEIDON data from 1989 to 1993, four points have been drawn in these years. These four points represent the height of water that has been measured by dipstick (Fig. 6). Fig. 6 illustrates that the lake level variation equals 0.2 meters, from Junuary 1989 to August 1998, which is small in comparison to seasonal level variations of this lake. But the lake level variation equals to 3 meters from August 1998 to August 2001, approximately. It is necessary to mention that the tide-range in Urmia Lake is inconsiderable. Therefore, the lake level variations and coastline changes are not affected by tide. In fact, these changes derive from water balance of Urmia Lake. Several methods have been devised to detect the coastline changes. Among them, remote sensing appears to be a cost effective way. Histogram thresholding is inadequate in depicting the real changes especially in marsh area, as any threshold value will be exact only on some area. Using the band ratio between band 4 and 2, and also, between band 5 and 2 can result in water-land discrimination. However, the method mistakenly assigns some of the vegetative lands to water. Based on the evaluation, and the dynamic and complex land-water interaction in coastal Urmia Lake, a new procedure has been developed and presented in this paper. In the new approach, histogram thresholding and band ratio techniques are used together. The results have been evaluated using ground truth image-driven data and showed superior accuracy, namely; 1.3 pixels (pixel size=30 m). Topex/Posidon satellite information can be used to determine water level variations. Using such data for Urmia Lake showed three meters decrease in the lake level from August 1998 to August 2001. It has caused approximately 1000 square kilometers decrease in the area of Urmia Lake. The lake level variations and coastline changes are not affected by tide, as tide-range in Urmia Lake is inconsiderable. In this research, Urmia Lake coastlines have been extracted from ETM+ and TM imagery. The coastline map illustrates that the shoreline has small changes from 1989 to 1998 year,and great changesfromAugust 1998toAugust 2001.The small changes in Urmia Lake coastline are perpetual. The great changes have happened as the result of 3 m decrease in the height of water of Urmia Lake. REFERENCES
© 2007 Center for Environment and Energy Research and Studies (CEERS) The following images related to this document are available:Photo images[st07008t1.jpg] [st07008f7.jpg] [st07008f3.jpg] [st07008f6.jpg] [st07008f5.jpg] [st07008f4.jpg] [st07008f2.jpg] [st07008f1.jpg] |
| |||||||||
