 |
| About Bioline | All Journals | Testimonials | Membership | News |
|
||||||
|
||||||
International Journal of Enviornmental Science and Technology, Vol. 4, No. 1, Winter 2007, pp. 75-83 Impacts of barrage flushing and flooding in operations on upstream total suspended solids 1*Law, P. L.; 1Law, I. N.; 2Lau, H. H. & 1Kho, F. W. L. 1Department of Civil Engineering, University of Malaysia
Sarawak (UNIMAS), Kota Samarahan, Sarawak, Malaysia 2School
of Engineering and Science, Curtin University of Technology (Sarawak Campus),
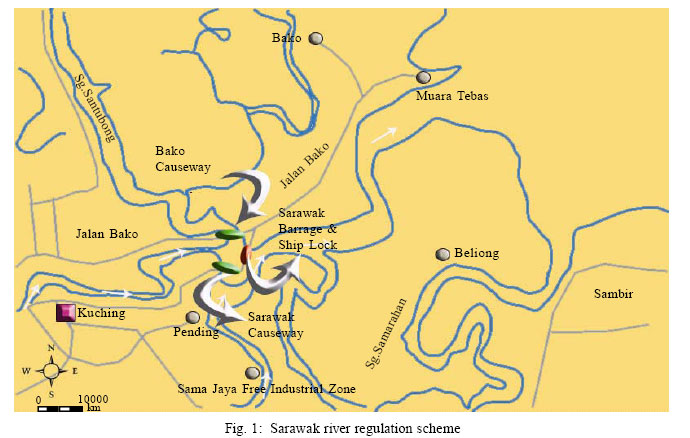
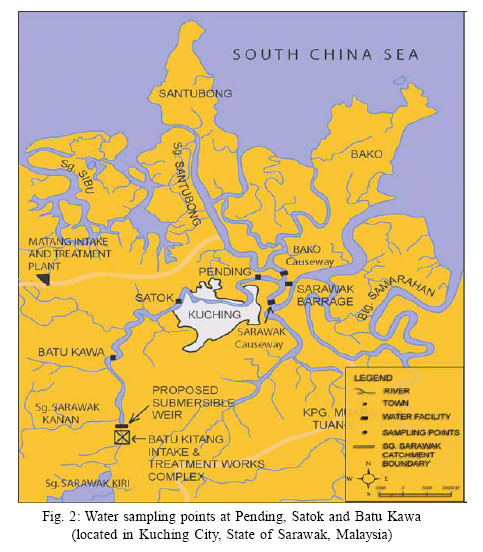
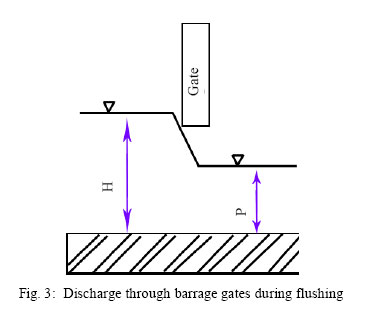
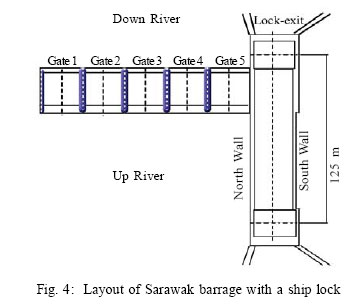
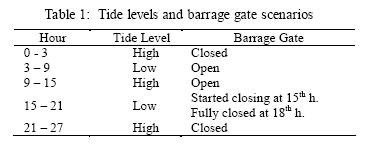
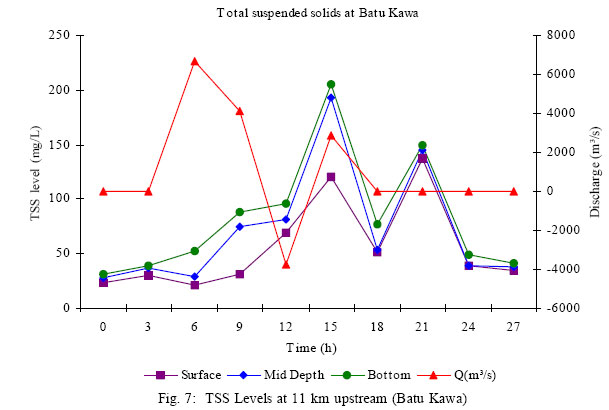
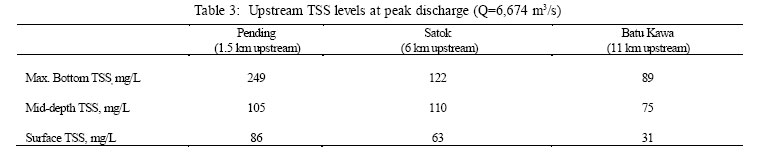
Sarawak, Malaysia Received 22 March 2006; Code Number: st07010 ABSTRACT: This study looks into the impacts of Sarawak Barrage (located in Kuching City, State of Sarawak, Malaysia) flushing and flooding-in operations on upstream total suspended solids (TSS). Water samples were collected from three upstream stations on 17th, 18th and 19th of August 2000. During flushing, it was observed that TSS levels increased over a distance of 11 km upstream. Maximum TSS recorded 250 mg/L at 1.5 km, 120 mg/L at 6 km, and 85 mg/L at 11 km upstream. During flushing, TSS levels increased with depth, and upstream turbulence intensities were indirectly proportional to distance from barrage. During flooding-in operation, TSS decreased from 249 to 155 mg/L at 1.5 km near the bottom, while surface TSS decreased from 86 to 58 mg/L. Generally, during flooding-in operation, TSS increased from 90 to 116 mg/L between 6 and 11 km. During flooding-in operation, maximum bottom TSS recorded 216 mg/L at 6 km upstream. Differences between bottom and mid-depth TSS levels were relatively minimal ranging from 19 to 45 mg/L, whilst the maximum difference between mid-depth and surface TSS was as high as 78 mg/L. After 9 hours of gate closure, a well-mixed regime prevailed from 6 to 11 km upstream with TSS ranged from 35 to 47 mg/L at all the monitoring points regardless of depths. Key words: Impact,barrage, flushing, flooding-in, upstream, total suspended solids INTRODUCTIONA barrage is a relatively low dam with controlling gates constructed across a river to raise the river level sufficiently to divert the flow in full, or in part, into a supply canal or conduit for the purposes of irrigation, power generation, domestic, and industrial uses, tidal control and so on (Novak, et al., 1990; Sharp and Lim 2000). Sarawak River (Sg. Sarawak) flows through the City of Kuching dividing it approximately intotwo equal halves (Fig. 1). Kuching City is located in tidal influence zone with a tidal range of approximately 6 meters (DID 2001; Sharp and Lim 2000). To control upstream water level in Sarawak River, a barrage was constructed in 1988, i.e., Sarawak Barrage to regulate river water from draining out and to prevent seawater from flooding-in (Law, 2001). Thus, two causeways were constructed over Sg. Santubong and Sg. Sarawak (Figs. 1 and 2) (Law, 2001). The barrage structure consists of 5 radial gates (25 meters in width each) to prevent saline intrusion and to regulate water levels upstream of Sarawak River (Law, 2001). The general arrangement of Sarawak Barrage and discharge characteristics through barrage gatesare illustrated in Figs.3 and 4. A ship lock was constructed alongside of the barrage, which is exclusively reserved for river traffic (Fig. 4). During draining-out (flushing) and flooding-in operations, all the five gates are mechanically lifted up by 1.0 meter providing a total cross-sectional opening of 125 m2 (125 m in width and 1 m in height (JKR 1994). The barrage serves as a "mini dam or weir"by holding additional amount of fresh water behind it during low tide, thus maintaining sufficient water volume for Batu Kitang Water Treatment Plant, located approximately 15 km from barrage (JKR 1994). Additionally, the construction of barrage was intended to enhance the aesthetic value of Kuching Water Front along Sarawak River, immediately upstream. A feasibility study favoured barrage construction over construction a dam upstream of Kuching City (LAK, Vol. I, 1996). The catchment of Sarawak River is the drinking water supply source for more than half a million of residents in Kuching City (LAK,Vol. II, 1996). Sarawak River Barrage Management (SSBM) commenced the operation of Sarawak Barrage in August 1998 by carrying out daily flushing operation during low tide and alternate weekdays flooding-in operation during high tide (SSBM 2000). Flooding-in operation was carried out on every Monday, Wednesday and Friday to specially provide the required water levels for shipyard maintenance activities located at the immediate upstream of the barrage. Flooding-in operation was stopped when river water level equated with seawater level. Generally, the duration of flooding-in operation was less than 1 h to prevent excessive saline intrusion that could reach the major water treatment plant at Batu Kitang located at about 15 km upstream of Sarawak Barrage (Law, et al., 2002; 2003). Before the construction of the barrage, saline intrusion went as far upstream as to the headwork at Batu Kitang Water Treatment Plant. Thus, saline contamination in the treated water had been a major problem during dry season that supplies drinking water to major parts of Kuching City (LAK, 2000). However, the effect of barrage operation had significant impact on the water quality upstream despite the fact that this region experiences high annual rainfall, and the effect of barrage operation on water quality is most significant during dry season (Law, et Bako al., 2003). The locations of water sampling points were 1) Pending at 1.5 km, 2) Satok at 6 km, and 3) Batu Kawa at 11 km upstream of Sarawak Barrage (Fig. 2). MATERIALS AND METHODSWater samples were collected at 3-hour interval over a period of 27 h, i.e., from 17th to 19th August 2000 in order to determine the levels of total suspended solids (TSS) at individual monitoring stations during flushing and flooding-in operations (Table 1). Water samples were collected from three water levels; surface (1.0 meter below water), mid-depth, and bottom (1.0 meter from the bottom of riverbed) at three sampling points at Pending, Satok and Batu Kawa (Fig. 2). Generally, barrage gates are opened for flushing operation to take place during low tide, and the gates are closed during high tide to prevent saline intrusion to the upstream. Water samples were taken at 3-hour interval during flushing and flooding-in operations over a period of 27 hours regardless of tide levels. During sampling period, a series of synchronized timing sequence for the opening and closure of barrage gates was devised with focus on tide levels, timing of flushing and flooding-in operations (Table 1). During sampling period, the barrage gates were opened throughout flushing and flooding-in operations; opened during low tide for flushing operation to take place from 3rd to 9th h and during flooding-in operation from 9 to 15 h. Barrage gates were closed from 18 to 27 h. During normal barrage operation, gates are closed during flooding-in to prevent saline intrusion and opened for flushing operation. Flow measurements were recorded at the barrage during flushing and flooding-in operations and the discharge values were compared to or correlated with changes inwaterqualities upstream. Auxiliaryoutputs from these measurements were volumes discharges versus water levels at those monitoring points. Volumetric discharges were then correlated with total suspended solids (TSS) upstream. Volumetric discharges during flushing or flooding-in operation through the horizontally crested weir were determined using the following expression (Brater, et al., 1996):
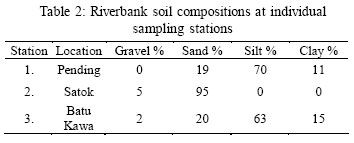
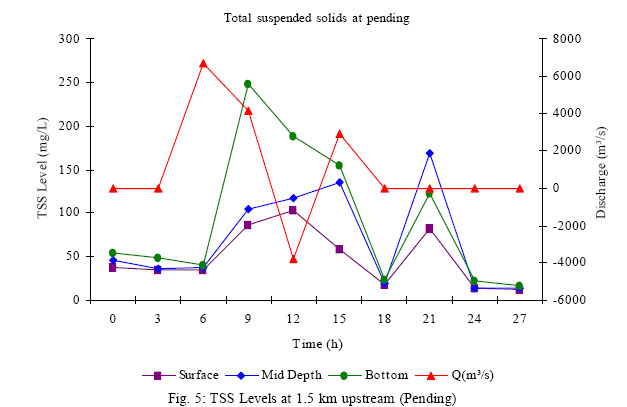
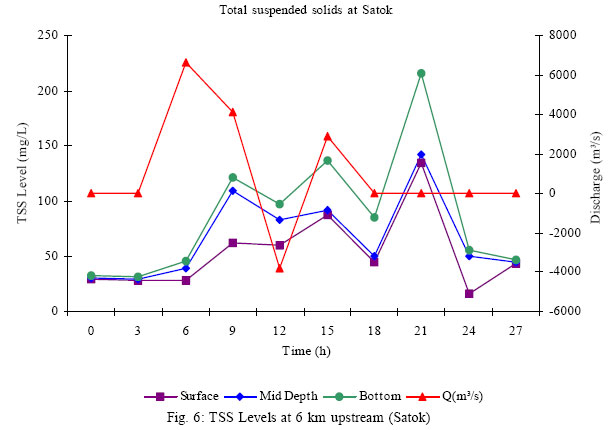
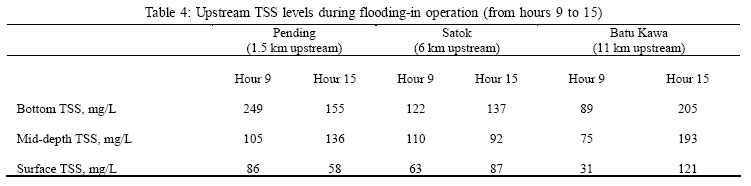
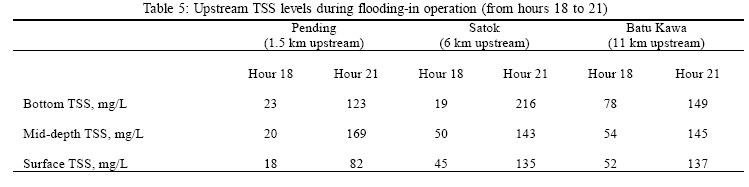
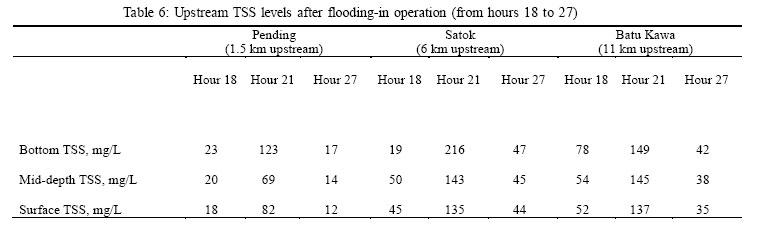
Where Q = Discharge, m3/sec Volumetric discharge changes with respect to water levels at the individual water sampling stations. In this case, when "Height of Water Level"or H is reduced to the same level as "Sill Height"or P, then either flooding-in or flushing operation would cease. Total length of gate (L) is dependent on the number of gates opened from bottom by 1.0 m during flushing or flooding-in operations. The barrage structure consists of five mechanically controlled radial gates measuring 25 m in width each, and a ship lock for passage of river traffic (Fig. 4). This research attempted to correlate discharge versus turbulence during flushing and flooding-in operations by determining the intensity of turbulences on riverbed loads and riverbank materials against known volumetric discharges. The intensities of turbulence were represented by the amount of total suspended solids (TSS) contained in a water samples; the higher the TSS value, the higher was the intensity of turbulence. Generally, relatively smaller and lighter materials such as silt, clay and organic matters would break away from riverbanks and riverbed by water current during flushing and flooding-in operations. However, it was noted that riverbank soil compositions in terms of percentage of gravel, sand, silt and clay at the individual locations were different. Characteristics of riverbank and riverbed materials could be one of the prime determining factors for turbulences created during flushing or flooding-in operations (Law, 2001). Table 2 shows the distribution of soil compositions gathered from riverbanks at the individual stations. RESULTSSarawak Barrage flushing and flooding-in operations created certain degree of turbulences at both downstream and upstream of the structure. Plots of TSS versus discharge over time through the barrage are illustrated in Figs. 5, 6, and 7. Positive discharges occurred during flushing operation, negative discharges occurred during flooding-in operation, and zero discharge occurred when all the five barrage gates were closed during sampling time. Plots of TSS levels (mg/L) at bottom, mid-depth and surface against discharge (m3/s) over time (h) over a period of 27 h, i.e., from zero to 27 h (Fig. 5, 6 and 7). During water sampling period, it was noted that zero to 3 hour experienced a regime of high tide whereby barrage gates were closed to prevent or minimize saline intrusion. Total suspended solids (TSS) levels at all the three stations showed an array of fairly uniform distribution ranging from 29 to 54 mg/L regardless of depth from water surface and distance upstream of barrage. From hours 3 to 9, the tide was low and barrage gates opened for flushing to take place. Discharge volume through barrage gates accelerated from Q=0 m3/s at hour 3 to Q=6,674 m3/s (peak flow) at 6 h. At hour 6, peak discharge occurred and bottom TSS recorded 42 mg/L at Pending, 43 mg/L at Satok, and 40 mg/L at Batu Kawa. Maximum bottom TSS recorded 250 mg/L for Pending at hour 9, 120 mg/L for Satok at hour 9, and 85 mg/L for Batu Kawa at hour 9. Thus, highest value bottom TSS could be interpreted as an indicator of highest intensity of turbulence that occurred at 11 km upstream, with a lag period of 6 h after barrage gates were opened. Flushing occurred between hours 3 and 9. During this period, bottom TSS at any particular time and monitoring location showed relatively higher than mid-depth and surface indicating that turbulence intensities were comparatively greater at the bottom of the river, and TSS levels increased with depth (Table 3). A detailed analysis of all TSS data showed that bottom TSS levels were 15 to 170 mg/L higher than mid-depth TSS, while mid-depth TSS were 50 to 65 mg/ L higher than surface TSS. A comparison of maximum bottom TSS recorded at all three sampling locations demonstrated that Pending TSS showed a highest value of 250 mg/L, whilst Satok and Batu Kawa recorded 125 mg/L and 90 mg/L, respectively. Sampling data recorded at different depths and points were crossreferenced, there was a clear indication that upstream turbulence intensities were indirectly proportional to upstream distance from barrage during flushing. In this study, first peak discharge was at 6 hour, i.e., at peak discharge of 6,674 m3/s through barrage gates, and was followed by a dramatic increase in bottom TSS that attained peak level at 9 h at all three sampling locations. Thus, time lag between peak discharge and peak bottom TSS levels was approximately 3 h. However, it is a fact that whenever there is a change in flow rate at a particular point in the channel carrying a sub-critical flow, the backwater effects to changes in flow rate would always propagate upstream. However, it was noted that mid-depth TSS at Satok (6 km upstream of barrage) was 25 to 30 mg/L higher than Pending (1.5 upstream), and Batu Kawa (11 km upstream). Surface TSS at Satok was 40 mg/L higher than Pending or Batu Kawa. Generally, relatively higher turbulences at bottom, mid-depth and surface would occur at for locations closer to barrage than locations further upstream. However, this phenomenon did not apply in the case of mid-depth and surface TSS at Pending and Satok. Satok is located 6 km upstream of barrage and was experiencing 30 to 40 mg/L higher TSS levels than Pending (1.5 km upstream of the barrage). Such occurrence could be attributed to differences in the riverbank soil compositions in terms of percentage of gravel, sand, silt, clay and organic matters between Satok and Pending. It was noted that riverbank materials at Satok contained as high as 95% of loose sand particles as compared to relatively highly adhesive 81% silt and clay content at Pending. Differences in the composition of riverbank materials could be one of the determining factors for the intensity of turbulence created during flushing and flooding-in operations. During flushing operation, water flows smoothly from upstream through the barrage gates to downstream without generating visual noticeable turbulence. However, upstream noticeable turbulences were observed immediately after closure of barrage gates. During flushing, waters flowed from upstream to downstream imparting a trust against the barrage gates creating surges or waves in the upper stretch of the barrage. The waves travelled upstream, and the surge energy increased when flushing was immediately followed by flooding-in operation without closing the gates. However, TSS levels recorded at the individual points were not solely due to turbulences created during flushing or flooding-in operation, but also constituted materials from upstream riverbanks, riverbed and drainage effluents. From hours 9 to 15, it was a regime of high tide and barrage gates remained open for flooding-in operation to take place. Noticeable flooding-in or flow-to-upstream through barrage gates occurred at 11 hour. Bottom TSS decreased from 249 to 155 mg/L at Pending, increased from 122 to 137 mg/L at Satok, and increased from 89 to 205 mg/L at Batu Kawa (Table 4). Mid-depth TSS increased from 105 to 136 mg/L at Pending, decreased from 110 to 92 mg/L at Satok, and increased from 75 to 193 mg/L at Batu Kawa. Surface TSS decreased from 86 to 58 mg/L at Pending, increased from 63 to 87 mg/L at Satok, and increased from 31 to 121 mg/L at Batu Kawa. During flooding-in operation, there was a slight increase in both bottom and mid-depth TSS levels at Satok, and dramatic increased in TSS levels for all points at all depths at Batu Kawa. Relatively higher levels of TSS at Batu Kawa located 11 km upstream of barrage could be due to the effects of the suspended loosened riverbanks and riverbed materials carried in the water (created during flushing) that were being pushed upstream by flooding-in surging waves from hours 9 to 15. Hour 15 marked the end of high tide regime when flooding-in operation stopped and flushing began. From hours 9 to 15, it was noted that differences between bottom and mid-depth TSS levels were relatively minimal ranging from 19 to 45 mg/L. However, the differences between mid-depth and surface TSS during this regime were as much as 78 mg/L. During sampling period, flushing operation occurred during low tide regime between hours 15 and 21. However, in this study an attempt was made to find out the effects of upstream TSS levels by stopping flushing operation during midway of low tide. Thus, at hour 18, barrage gates were closed. A comparison of upstream TSS levels amongst the 3 sampling stations at hour 18 (immediately after gate closure) and 3 h after gate closure are illustrated in Table 5. It was found that upstream bottom TSS levels increased from 71 to197 mg/L, mid-depth TSS increased from 91 to 149 mg/L, and surface TSS increased from 64 to 90 mg/L. It was also shown that the effects of gate closure (after 3 hours into flushing) on upstream TSS levels were directly proportional to upstream distance from barrage. During sampling, hours 21 to 27 was a regime of high tide and the barrage gates remained closed. Generally, flushing operation lasts for 6 hours encompassing the entire regime of low tide. However, one of the objectives of this research work focused on the effects of upstream TSS levels by stopping flushing operation during midway of low tide, i.e. barrage gates were closed at hour 18. Thus, barrage gates were closed (at hour 18) during the last 3 hours of low tide, which was supposedly undergoing flushing. From hours 18 to 27, TSS levels at all the three monitoring stations at individual depths increased from hour 18 when the gates were initially closed. TSS levels attained their peaks at hour 21, and then decreased sharply at hour 27 (Table 6). Such trend could be attributed to the fact that when barrage gates were closed at hour 18, TSS that were continuously supplied from upstream of sampling stations, for a short period of time would superimpose on existing suspended materials created during previous hours of flushing. Thus, TSS levels are indirectly proportional to upstream distances, and attained the peak at hour 21. Hour 27 experienced a regime of well-mixed situation whereby TSS levels were rather uniformly distributed that stretches from Pending to Batu Kawa covering a distance of approximately 5 km. As shown in Table 6, bottom, mid-depth and surface TSS levels at Satok and Batu Kawa were well distributed ranging from 35 to 47 mg/L. DISCUSSION AND CONCLUSIONDuring flushing, maximum bottom TSS occurred within an upstream distance of 11 km with a lag period of 6 hours after peak discharge (6,674 m3/s). Maximum upstream bottom TSS recorded 250 mg/L at 1.5 km, 120 mg/L at 6 km, and 85 mg/L at 11 km. Flushing operation during low tide regime would result in upstream bottom TSS levels relatively higher than mid-depth and surface TSS levels. It is concluded that TSS levels increased with depth, upstream TSS levels were indirectly proportional to distance from barrage, and differences in the composition of riverbank materials upstream could be one of the primary factors in determining upstream TSS. At 1.5 upstream (during flooding-in operation) bottom TSS decrease from 249 to 155 mg/L and surface TSS decreased from 86 to 58 mg/L. From 6 to 11 km upstream, a record of 90 to 116 mg/L increase in TSS levels were observed all bottom, mid-depth, and surface TSS. During flooding-in operation, maximum bottom TSS level measured 216 mg/L at 6 km upstream. It was found that the differences between bottom and mid-depth TSS levels were relatively minimal ranging from 19 to 45 mg/L while the difference between middepth and surface TSS was as high as 78 mg/L. After 9 hours of gate closure and followed by flooding-in operation, a well-mixed regime prevailed whereby upstream TSS levels ranged from 35 to 47 mg/L all the monitoring points regardless of depths, stretching a distanceof approximately5 km from 6 to 11 km. REFERENCES
© 2007 Center for Environment and Energy Research and Studies (CEERS) The following images related to this document are available:Photo images[st07010f8.jpg] [st07010f6.jpg] [st07010f7.jpg] [st07010f2.jpg] [st07010t5.jpg] [st07010t4.jpg] [st07010f3.jpg] [st07010t2.jpg] [st07010t1.jpg] [st07010t6.jpg] [st07010t3.jpg] [st07010f1.jpg] [st07010f5.jpg] [st07010f4.jpg] |
| |||||||||
