 |
| About Bioline | All Journals | Testimonials | Membership | News |
|
||||||
|
||||||
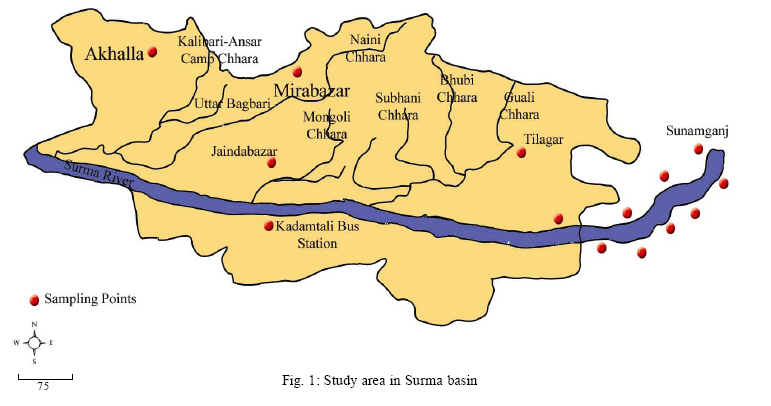
International Journal of Enviornmental Science and Technology, Vol. 4, No. 1, Winter 2007, pp. 159-167 Water quality parameters along rivers 1Alam, Md. J. B.; 3 Islam, M. R.; 1Muyen, Z.; 1Mamun, M. & 2Islam, S. 1Department of Civil and Environmental Engineering, Shahjalal
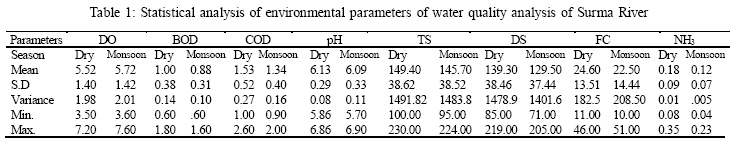
University of Science and Technology, Sylhet, Bangladesh Received 31 August 2006; Code Number: st07020 ABSTRACT: Water samples have been collected from a part of Surma River along different points and analyzed for various water quality parameters during dry and monsoon periods. Effects of industrial wastes, municipal sewage, and agricultural runoff on river water quality have been investigated. The study was conducted within the Chattak to Sunamganj portion of Surma River, which is significant due to the presence of two major industries-a paper mill and a cement factory. The other significant feature is the conveyors that travel from India to Chattak. This study involves determination of physical, biological and chemical parameters of surface water at different points. The river was found to be highly turbid in the monsoon season. But BOD and fecal coliform concentration was found higher in the dry season. The water was found slightly acidic. The mean values of parameters were Conductivity 84-805µs; DO: dry 5.52 mg/L, monsoon-5.72 mg/L; BOD: dry-1 mg/L, monsoon-0.878 mg/L; Total Solid: dry-149.4 mg/L, monsoon 145.7 mg/L. A model study was also conducted and values of different model parameters were estimated. Key words: Conductivity, BOD, total solids, Surma River, DO, dry season, monsoon season INTRODUCTIONThe Surma Basin, covering the eastern parts of the Bangladesh, contains at least
8 million people making it a populous river basin in Bangladesh. All these
peoples depend on Surma Basin for their household, industrial and other purposes.
However, the water quality of the Surma River is deteriorating day by day due
to human activities and industrial effluents, which are built up on its bank.
So it is of vital importance to monitor and simulate the water quality parameters
of the Surma River to ascertain whether the water is still suitable for various
uses. In a study, it was found that Texas has approximately 191,228 miles of
streams and rivers. Overall rivers and stream water quality improved slightly
between 1996 and 2002, as the number of miles not meeting their designated
water quality uses fell from 4,290 to 3,568 miles. Of the 3,568 miles
of rivers and streams that did not fully meet their designated use in the 2002
report, about 2,215 miles did not meet safe swimming (contact recreation) conditions,
455 miles did not meet standards for aquatic life, some 285 miles had fish
consumption bans or advisories, and some 825 miles did not meet general uses
due to high amounts of total dissolved solids and/or choride. It is important
to note, however, that many miles of
streams and rivers did not have sufficient data to determine if they met state
water quality standards, and in fact, Texas Water QualityAuthority identified
hundreds of miles of streams and rivers with water quality concerns but with
insufficient data to meet their methodology for calling a stream or river "impaired".
Between 1994 and 2002, overall use support in reservoirs declined from 98 to
70 percent,
indicating a substantial decline in reservoir water quality. The decline in
overall use support was caused by mercury deposition in reservoirs from atmospheric
deposition, higher levels of dissolved oxygen, higher levels of metals and
organic substances, and either high or low levels of pH, elevated levels of
chloride and high levels of total dissolved solids (Texas Environmental Profiles,
2006). In another study, the Songhua river was found polluted. The river is
considered as mother river of China as it provides water for industries, agriculture
and human consumption. The river is polluted by both conventional pollutants
(heavy metals, nitrate, phosphate, pesticides) and micro pollutants (ADB, 2006).
Several studies (DOE 1993; Hossain, 2001) showed that surface water quality
of the rivers of the
country especially Surma River is moderately polluted in different locations.
Hossain (2001) discussed a study to determine the organic and inorganic pollutant
loads of the selected industrial effluent of Chattak Pulp and Paper Mill on
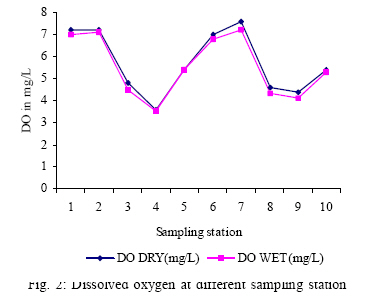
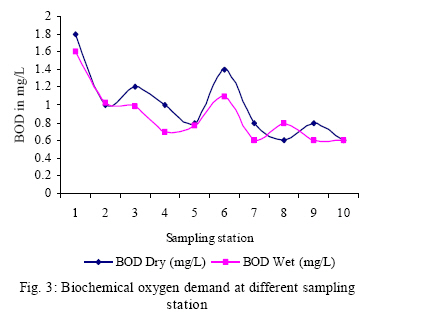
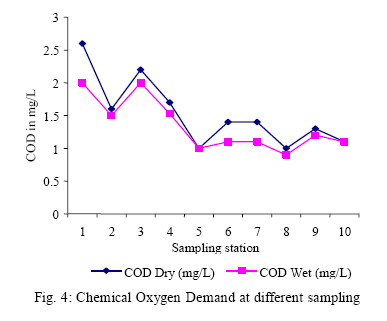
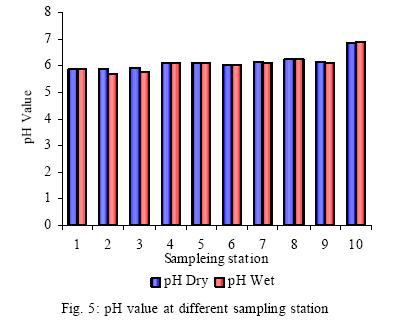
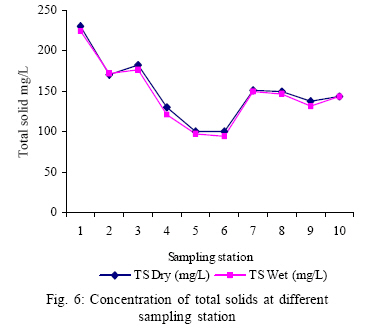
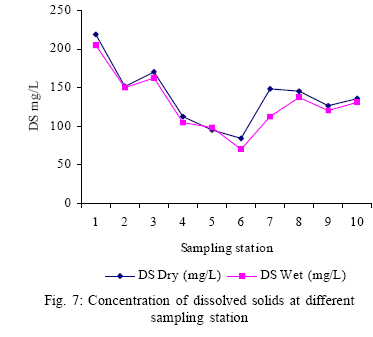
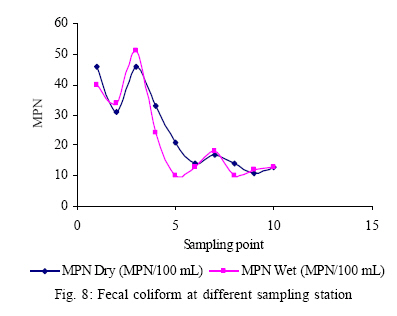
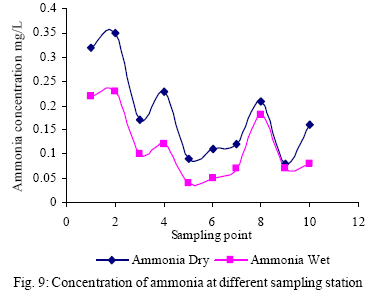
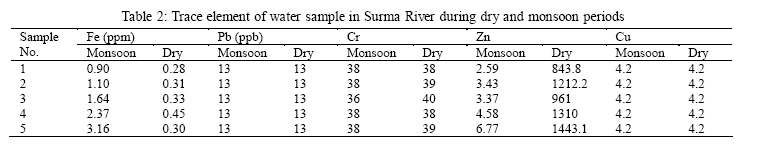
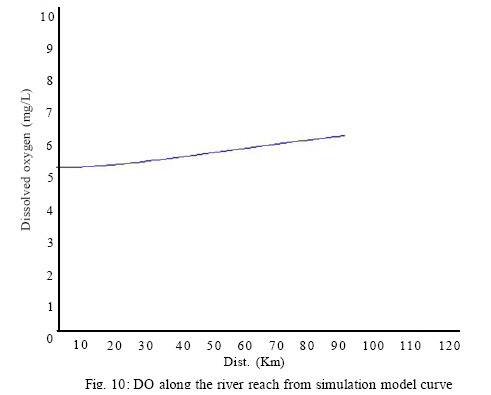
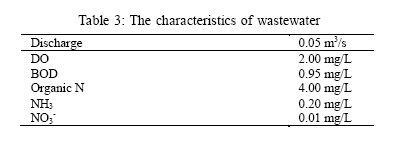
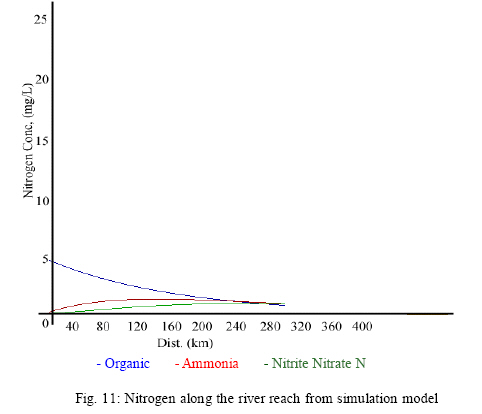
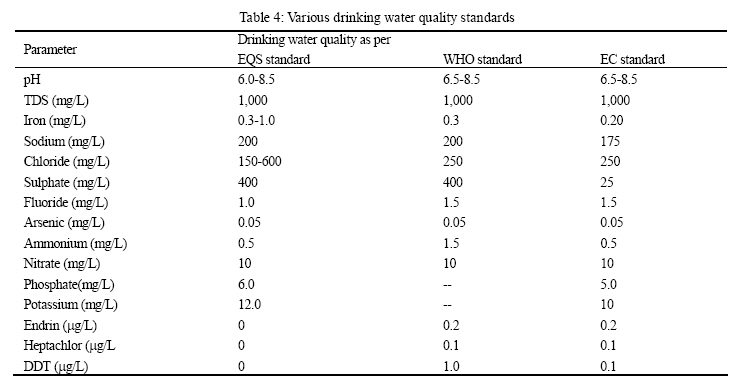
the water quality of Surma River. Standard methods were adapted for the analysis of various water quality parameters APHA-AWWA-WPCF (1989). 1 liter polypropylene bottles were used for water quality parameter analysis and 1 L glass bottles were used for pesticide analysis. Prior to sample collection, all bottles were washed with dilute acid followed by distilled water and were dried in an oven. At each sampling location, water samples were collected in two polypropylene and one-glass bottles. Before taking final water samples, the bottles were rinsed three times with the water to be collected. The sample bottles were labeled with date and sampling source. Information was also gathered about the types of pesticides and fertilizers being used near sampling points. Samples were collected from September 2001 to July 2003. The study was conducted by a group of students. An interactive river water quality model has been developed to simulate the fate and transport of pollutants through a river system using "C"language. At present, it helps a user to predict the variation of BOD, DO, Nitrogen, Phosphorus and Heavy Metal as these move through a river system. The sub-models have been validated with the data readily available during the field experiment. RESULTSPhysical environmental parameters Water samples were collected from the Surma River during two seasons-dry and monsoon and tested for physical qualities, chemical contents, and microbiological counts. Ten sampling points, each 250 m apart were selected. The important water quality parameters, such as Conductance, Hardness, DO, BOD, COD, pH, TS, DS, Fecal Coliform and NH3 were analyzed. concentration of iron, lead, sodium, magnesium, calcium, chromium, copper and zinc were also analyzed at five points. In the case of dissolve oxygen, standard for sustaining aquatic life is 4 mg/L, whereas for drinking purposes it is 6 mg/L. DO value for Surma river, along our particular reach lies in between 5.52 mg/L (dry) to 5.72 mg/L (monsoon) as shown in Table 1. Following Fig. 2 graphically shows the DO data of ten sampling points, while in the case of biochemical oxygen demand (BOD), standard for drinking purpose is 0.2mg/L, which is exceeded to a great extent as shown by the mean values (dry-1 mg/L, monsoon-0.878 mg/L) in Table 1. But for other purposes where the value is quite higher than 0.2 mg/L, the Surma river water is quite satisfactory. Fig. 3 graphically shows the BOD data of ten sampling points. Chemical oxygen demand (COD) is other important parameter of water quality assessment. A standard for drinking purposes is 4 mg/L, which are acceptable in-terms of our analyzed value as stated in Table 1. Fig. 4 graphically shows the COD data of ten sampling points. pH is the indicator of acidic or alkaline condition of water status. The standard for any purpose in-terms of pH is 6.5-8.5, in that respect; the mean value (dry-6.126, monsoon-6.093) in Table 1 indicates slightly acidic water. Following Fig. 5 graphically shows the pH data of ten sampling points. Total solids concentrations in dry season are 149.4 mg/L whereasin monsoon season it is 145.7 mg/L, as shown in Table 5. This variation is due to the fact that waste assimilation capacity increases in the monsoon season. Higher values of total solids are mainly due to the presence of silt and clay particles in the river water. Following Fig. 6 graphically shows the TS data of ten sampling points. Standard for DS in terms of drinking water is 1000 mg/L the maximum we get in the dry season is 219 mg/L and in the monsoon season it is 205 mg/L as stated in Table 1. So in this respect we can conclude that the Surma river water is acceptable from the drinking water perspective. Following Fig. 7 graphically shows the DS data of ten sampling points. The mean values (dry-24.6 MPN/100 mL, monsoon-22.5 MPN/100 mL) as shown in Table 1 are clearly unacceptable as far as drinking purposes are concerned. For other activities relating to surfacewater qualitythe values are quite acceptable. The source of organic and microbial pollutants present in the water can be accounted for the presence of trollers used for conveying stones, as mentioned earlier. Following Fig. 8 graphically shows the fecal coliform data of ten sampling points. Bangladesh standard for ammonia in surface water for drinking purposes is 0.5 mg/L the maximum value yielded from test result shows a much lower value of 0.35 mg/L (dry) and 0.23 mg/L(Monsoon) as shown in Table 1, which means it is quite safe in terms of ammonia pollution. Following Fig. 9 graphically shows the Ammonia data of ten sampling points (Muyeen and Mamun, 2003). The mean value of conductance of river Surma is 84-805µs (Shiddiky, 2002). Conductance increases along the downstream of the river. Conductance values for the dry season are higher than that for the monsoon. Conductance depends on the number of ions present in water. In the dry season, the total volume of water decreases, as a result the conductivity increases. The electrical conductances of five points were found during monsoon 100 µs, 105 µs, 108 µs, 110 µs and 120 µs respectively towards downstream. The electrical conductances of five points were found during dry season 800 µs, 830 µs, 759 µs, 810 µs and 850 µs respectively towards downstream. Total hardness of the Surma River increases along the downstream. Hardness values of water samples varied from 30.20 to 70.20 ppm as CaCO3, which is fit for drinking use. Hardness values for the dry season are higher than that for the monsoon (DOE, 1993). The maximum concentration of iron for the present study was found to be 3.16 ppm; minimum concentration found to be 0.26ppm at Chattak Cement Factory effluent (Sunamaganj)-discharge point. These values were less than the values of iron in the Meuse and the Rhine River water. The concentration of Surma River exceeds the permissible limit of iron recommended by EU (Claes, et. al., 1997) and BD (Bangladesh Gazzet, 1997). During monsoon, it was found to be higher than the permissible level of iron; whereas in the dry season, it was within the permissible limit. The lead concentration was found within the 13 ppb in our present study. Majid and Sharma (1999) found lead concentration of Kernofully River was 0.04 ppb. The level of lead is much below the permissible limit for irrigation and livestock drinking recommended by EU (Claes, et. al., 1997) and BD (Bangladesh Gazzet, 1997). The standard limit of lead for domestic and irrigation water is 50 ppb. In the respect, the level of lead causes no matter of concern. The concentration of chromium was found within the 38.2 ppb in our present study. Shiddiky (2002) reported that concentration of chromium of Buriganga and Shitallahkha River was 20.6 ppb. The level of chromium is much below the permissible limit for irrigation and livestock drinking recommended by EU (Claes, et. al., 1997) and BD (Bangladesh Gazzet, 1997). The standard limit of lead for domestic and irrigation water is 50 ppb. In the respect, the river of Surma is not polluted in terms of Cr. The concentration of zinc is higher in the dry season than the value of monsoon. Zinc concentration was found maximum at downstream during dry season (1.48 ppm) and zinc concentration was minimum at upstream during monsoon (0.0022 ppm). The effluent discharge from industries, various domestic and household sources enhance the concentration of zinc during dry season. The concentration of copper was found within the 4.2 ppb in our present study. Shiddiky (2002) reported that concentration of copper of Indus river of Pakistan was within 91ppb. The level of copper is much below the permissible limit for irrigation and livestock drinking recommended by EU (Claes, et. al., 1997) and BD (Bangladesh Gazzet, 1997). The standard limit of copper for domestic and irrigation water is 1ppm. In the respect, the river of Surma is not polluted in terms of copper Table 2 shows the concentration of trace elements in water of Surma River. River modeling Formulation BOD-DO sub model The net equation for DO deficit is dD/dt = K1 Lt -K2 D + 4.57 K23 N2 (1) The solution for the differential equation is D = [ K1L0(exp(-K1t)-exp(-K2t)/(K2-K1)- D0 exp(-K1t)) +4.57 {K12K23(((1-e-k 11t)/K11)-((1-e-k 22t)/K22)/ (K22-K11)N01) +K23/K22(1-e-k 22t)N02}] (2) Where D is oxygen deficit, Cs is oxygen concentration at saturation level, C is oxygen concentration at any time t, L is amount of carbonaceous at any time t, K1 is rate of BOD exertion, K2 is the rate of re-aeration, N1 is concentration of organic N, N2 is concentration of NH3 N, N3 is concentration of NO2-, NO3--N, K12 is rate of decomposition of organic N to NH3, K11 is rate of decomposition of organic N to NH3 and its settling, K23 is rate of oxidation of NH3 to NO2-, NO3-, K22 is rate of oxidation of NH3 and the rate of uptake of NH3 by aquatic plants. When CBOD of the waste is very high, then DO would approach complete depletion and anaerobic conditions would result. The end of anaerobic reach is given by xf = xi + U(K1Li-K2Cs)/K1K2Cs (3) From the end of the anaerobic reach, the original equation of oxygen deficit can be used with L0- ultimate BOD at the end of anaerobic reach (Lf) and initial deficit, D0 = D s (Muyan, and Mamun, 2003). Nitrification sub model The nitrogen concentration in the river at various points along the flow direction is to be monitored. The conditions of nitrification include the presence of nitrifying bacteria, optimum PH in the alkaline range (pH=8), DO concentration is more than 1 mg/L. If N1 is concentration of organic N, N2 is concentration of NH3-N, N3 is concentration of NO2- and NO3- N, K12 is rate of decomposition of organic N to NH3, K11 is overall loss co-efficient of organic N due to settling of particulate forms and hydrolysis and bacterial decomposition of NH3, K23 is rate of oxidation of NH3 to NO2-, NO3-, K22 is tare of oxidation of NH3 and rate of uptake of NH3 by aquatic plants, K33 is rate at which NO2-, NO3 is lost due to uptake by aquatic plants or through denitrification, then nitrification kinetics can be described by following equations: dN1/dt = -K11N1 (4) dN2/dt = K12N1- K22N2 (5) dN3/dt = K23N2- K33N3 (6) Solution for the above differential equations is N1=N01ek11t (7) N2={K12N01(e-k11t-e-k22t)/(K22-K11)}.. N02ek22t (8) N3=K12K23 N01{(e-k11t -e-k33t)/(K33- K11) -(e-k22t- e-k33t)/ (K33- K22)}/(K22- K11)+ K23N02(e-k22t -e-k33t)/(K33- K22) + N03 e-k33t (9) Where N01, N02, N03 are initial concentration of organic N, NH3-N and NO2-, NO3--N respectively (Thomann and Mueller, 1987; Himesh, et al., 2000). Case study-1 Case study-2 Stream discharge 0.3 m3 /s, Organic N concentration 5 mg/l, NH3-N concentration 0.15 mg/L and NO2, NO3 N concentration 0.03 mg/L. Constant K11, K12, K22, K23, and K33 are respectively 0.11, 0.09, 0.14,0.13 and 0.16 (Hossain, 2001). Waste water characteristics are as follows Organic N concentration 4 mg/l, NH3-N concentration 0.2 mg/L and NO2, NO3-N concentration 0.01 mg/L. And the model output is shown in the following Fig. 11 for a distance of 300 km. DISCUSSION AND CONCLUSIONThe results from data analysis show that, the water is certainly unfit for drinking purposes without any form of treatment, but for various other surface water usage purposes, it still could be considered quite acceptable. But as we know, once a trend in pollution sets in, it generally accelerates to cause greater deterioration. So few years from now, serious water quality deterioration could take place. However, there could be gross differences in the test results of some samples at different laboratories in the country, which could limit the use of these data for sensitive policy issues. The differences might be attributed to the approach adopted by laboratories in sample preservation, quality of chemicals used, testing method applied or qualification or expertise of the technicians or test performers. This study involves determination of physical, biological and chemical parameters of surface water at different points. The river was found to be highly turbid in the monsoon season. But BOD and fecal coliform concentration was found higher in the dry season. The water was found slightly acidic. The mean values of parameters were Conductivity 84805 µs; DO: dry-5.52 mg/L, monsoon-5.72 mg/L; BOD: dry-1mg/L, monsoon-0.878 mg/L; Total solid: dry-149.4 mg/L, monsoon-145.7 mg/L. The model also predicts the parameter very well. Moreover, it is clear from the analysis that industries have negative impact on ground water resources near the industrial area. It is clear from the analysis compared with Table 4 that the maximum concentration of iron for the present study was found to be 3.16 ppm; minimum concentration found to be 0.26 ppm at Chattak Cement Factory effluent (Sunamaganj) discharge point. Moreover it was found that total hardness of the Surma River increases along the downstream. Hardness values of water samples varied from 30.20 to 70.20 ppm as CaCO3, which is fit for drinking use (Table 4). REFERENCES
© 2007 Center for Environment and Energy Research and Studies (CEERS) The following images related to this document are available:Photo images[st07020f2.jpg] [st07020f8.jpg] [st07020f10.jpg] [st07020t4.jpg] [st07020f4.jpg] [st07020f5.jpg] [st07020f1.jpg] [st07020f12.jpg] [st07020f7.jpg] [st07020f11.jpg] [st07020f6.jpg] [st07020t2.jpg] [st07020f3.jpg] [st07020f9.jpg] [st07020t1.jpg] [st07020t3.jpg] |
| |||||||||
