 |
| About Bioline | All Journals | Testimonials | Membership | News |
|
||||||
|
||||||
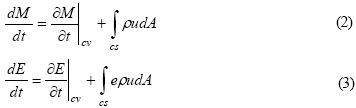
International Journal of Enviornmental Science and Technology, Vol. 4, No. 2, Spring 2007, pp.189-196 Evaluation of the optimal performance of passenger vehicle by integrated energy-environment-economic modeling 1*H. Farzaneh, 2Y. Saboohi 1Department of Energy Engineering, Graduate School of Environment and Energy, Science and Research Campus, Islamic Azad University, Tehran, Iran Received 10 January 2007; Code Number: st07024 ABSTRACT: Analysis of multi dimensional interactions of flow of energy in passenger vehicle is a complex task that necessitates development and utilization of analytical tools. Development of analytical tools with high complexity is usually based on conclusions of many concepts and theories from different scientific disciplines. In this approach, Passenger vehicle is supposed to be organized in the form of a firm and appears in the market that oriented towards establishing an effective energy supply system which may be identified as delivering the product (person kilometer or tone kilometer) with minimum operation costs. To this end, an optimization model named power software founded on theory of firm of microeconomics has been developed using technique of mathematical programming. Base on this theory, the car owner tries to minimize the total cost of the system subject to the satisfaction of the required transport services and technological, economical, environmental and institutional constraints. The approach and the application of the model shall be demonstrated with the help of a case study. The result of this study shows the extent of optimal energy usage subject to meeting the required certain urban transport service. Key words: Passenger vehicle, energy flow optimization, mathematical programming INTRODUCTIONUrban passenger transport is a major energy consuming sector and it has tremendous impact on the environmental pollution. The effect of urban passenger transport on the energy consumption and environmental pollution is more acute in developing countries than in industrialized countries, which may be due to the lack of reliable and effective mass transport infrastructure in these countries. Contribution of private passenger vehicles to the transport services is, therefore, considerable. Improvement of energy efficiency and regulation of emission of pollutants from passenger vehicles could provide effective means of easing the negative economical and environmental impact of urban transport systems. Technology assessment and efficiency evaluation of passenger vehicles have been pursued with the help of analytical tools that have been developed and implemented in the last two decades (DOE Report, 2005), (Hoffman and McInnis, 2004) and (MAP Engineering, 1993). Many of the available analytical tools are based on the heuristics and experimental data (Markel, et al., 2002). But there has been little effort on concluding the theoretical background of analysis and developing respective energy models according to the optimal behavior of the system. Based on this conclusion, integrated energy-environment-economic modeling approach is developed to study of the performance of passenger vehicle as major component of the urban passenger transport. In this investigation, passenger vehicle is supposed to be organized in the form of a firm and appears in the market as a supplier of goods and commodities. Activity of a producer is usually oriented towards establishing an effective supply system which may be identified as delivering the product with minimum costs. To this end, power software is designed and development for energy flow optimization in passenger vehicle that created in Fortran/Visual Basic programming. Fortran codes provide matrix-base programming environment for performing calculation based on concept of model while Visual Basic code is used to represent user friendly interface for a usual user. Power uses graphical user interface screens to guide the users through the modeling process. With the interface section, the user can iteratively evaluate the impacts of vehicle parameters and drive cycle requirements on the vehicle performance, economy, environment, traffic and institutional conditions. This research has been done in Islamic Azad University, Science and Research Campus during 2002-2005. MATERIALS AND METHODSApproach of the model In this approach, the vehicle is composed of various sub-systems and control volumes provide basis of structural development of the system of vehicle. Development of the vehicle system may be studied through analysis of functions of control volumes and the interactions between them. It is therefore necessary to define the dimensions and functions of the control volumes and relationships between them. Conversion processing depicts the flow of material/energy through an open system and its behavior is conditioned by the basic laws of physics and thermodynamics. In addition, development and operation of vehicle undergo various technical, economical and institutional constraints. Control volumes are open system and thus energy and material flows through them. Three main categories of open control volumes are defined in the software structure. They represent processing/conversion components (Engine, Gearbox, Differential, Radiator, Air filter, Intake manifold, injector or carburetor, outlet manifold and wheels), header (fuel linkage, electric network and lubrication system) and storage (fuel storage and battery). When the actual vehicle is composed of a collection of boundary, environment, technologies and input to plant data, it can be stored in the database of the model. The collection data can be inserted into the model to connection of the defined control volumes to establish of energy flow from one component to the next. The model library approach allows the same component model to be reused in multiple vehicle configurations. It also allows the impacts of different models to be evaluated within single vehicle architecture. After processing of data, the library linked to Fortran codes (Matrix generator and optimizer) and then optimal results will be observed through the output reports as mass and energy balances in different control volumes, supply and demand match, optimal energyflow and capacity profile of each control volume, storage profile in each load zone, energy flow networking and distribution in total site of vehicle total system and marginal cost of vehicle movement, energy intensities and effectivities and pollution in different scenarios. Theoretical concept of the model The economic rationality of a producer and activity of a firm has extensively been developed as a branch of micro economics and it has been utilized for explaining the development of production technology. It is clearly stated that a firm strives towards establishing a system of production and delivery with minimum costs subject to satisfying the demand and other technical, economical and institutional constraints. This concept may be formulated as below (Henderson and Quandt, 1985): Minimized Z = f (X1, X2, X3,..., Xn) (1) Subjectto : gi(X1, X 2, X 3,..., Xn) ≤bi Xj ≥0 i, j =1,2,3,...., n Present value total costs of the vehicle operation including fuel price , maintenance and the cost of time of the traveler is depicted by Z as objective function of system. X is multiple product of price and consumption of production factor at operation time point with consideration of discount rate. bi is demand for product that in this model is the passenger-kilometer on tone kilometer. The application of this concept to design and operation ofavehiclemay provide a useful concept for developing analytical tool. It is therefore intended to segregate the whole passenger vehicle system into sub systems and elements in order to substitute the production function (which would be the transport service in this case) and replace it with a set of simultaneous equations. Such a formulation would enable to solve the behavioral model of the production firm explicitly. Level of segregation is usually determined by the ability to introduce the basic laws of physics, engineering and economics. Changes in the state of the control volume is of general form and basic laws of physics and technical rules may be formulated accordingly and include them in the set of constraints of the system. Therefore, set of simultaneous equations would be developed that represent the laws governing the flow of material and energy through different equipments and devices at different stages of total passenger vehicle system. Energy flow through a control volume is subject to the 1st. law of thermodynamics. Equation of energy conservation for each control volume in passenger vehicle is, therefore, included as a constraint of the model. Equations 2 to 3 reflect the general feature of the constraint:
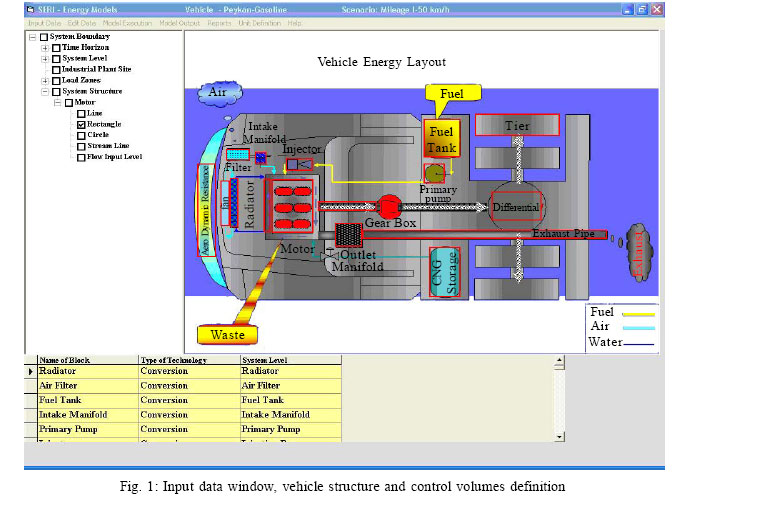
Where: M: Flow of material through a control volume. Operation of a control volume might change from time to time. This phenomenon may take place due to changes is state of flow or its composition. A flow of energy through components of passenger vehicle is usually associated with costs and they may also be supposed of cost carriers. The state variable may be multiplied with the unit costs of each technology and the product would indicate the costs of flow through the control volume. The model using a backward facing approach answers the question “assuming the vehicle met the required person per mileage mobility, how must each component conform and how mush energy will be required”. Institutional externalities are summarized into traffic and admissible speed limitation of passenger vehicle in the urban or highway cycles. Passenger vehicle ability to transfer of passenger per defined mileage as demand of transport service is affected by traffic as institutional externality and also resistance forces. Therefore, the amount of transport service,bi, is limited based on admissible speed trace of the vehicle in the different condition. Consideration of effect of institutional externalities on the operation of the passenger vehicle, therefore, can be possible by definition of demand of transport service as function of vehicle speed trace and movement resistance forces. For this purpose, the meaning of traction energy is introduced in this model and demand of transport service is equaled to required traction energy to movement of passenger vehicle. The speed trace limitation is identified by help of analytical tools for urban traffic simulation. In this case, the theory of fundamental diagram is developed to determine the admissible range of vehicle speed based on different traffic condition described by (Wu, 2002) and (Zhang,1999). Tractive behavior of a passenger vehicle is affected by traction force that justifies necessary force for vehicle movement in different condition. Therefore, traction force is a complex function of some factor such as: weight, aerodynamic resistance, rolling resistance, physical properties of road and also demand of passenger per mileage removable. Traction force is extracted from solving of system of equations of dynamic behavior of the passenger vehicle movement. FT =Fa +FD +Ff +FW +FG (4) Where, FT,Ff, FD, FG, Fw, Fa are defined sequentially as Total resistance force or traction force, friction force, drag force, ground resistance according to road condition, weight resistance according to gradient angle of road and acceleration force based on defined speed trace. The force required to accelerate the vehicle through the time step is calculated directly from the required speed trace. The required force then translated into a torque that must be provided by the component upstream, and the vehicle’s linear speed is likewise translated into required rotational speed and generated engine power. Component by component, this calculation approach energy carriers backward through the drive train, against the traction power flow direction, until the optimal fuel and electrical energy use that would be necessary to meet the demand through theoptimization algorithm iscomputed. Engine power is generated according to transmission of traction force through differential and gearbox with backward-facing approach. Engine power generated is affected by engine performance, kinetic of combustion reaction and heat loss from cylinder and exhaust pipe. Engine performance shows mechanical operation of the vehicle in 4 stages: intake, compression, combustion and exhaust. The energy flow storage calculates in each of these four strokes by transient mode in the model. Software structure Power software is an analytical tool for energy flow optimization in passenger vehicle that created in Fortran/Visual Basic programming. The interface facilitates interaction with the raw input and output data that is present in the Fortran codes and the vehicle energy model is depicted graphically to define the connections between components. The model reads the input data from prepared powerful database during the modeling and optimization and outputs the results to the workspace to be viewed in the output repots window. In the Power input data windows shown in Fig. 1, the user builds the vehicle boundary conditions. Vehicle boundary is divided into 5 sections as following description:
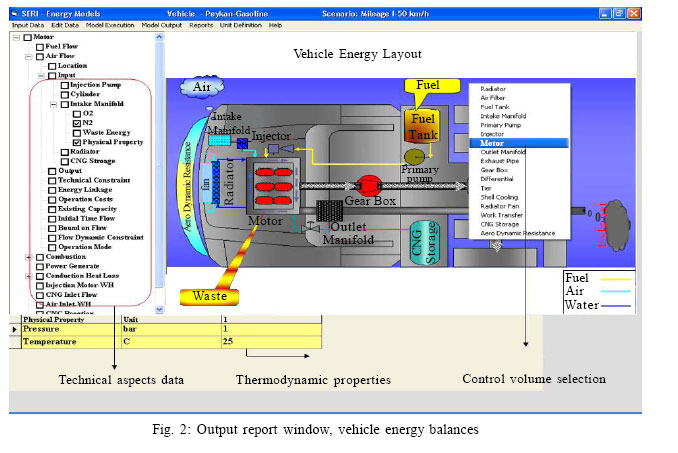
Demand and output request of the model is defined in the system environment section. As described in previous, person per mileage defines as the expected output request of the model based on optimization procedure in the software. Specific technical constraints such as pollutions and traffic limitation are indispensable part of the vehicle system. Limit on the quality of material at each level and combination of elements of a flow and the costs associated with the limits are the main data required for detailed and comprehensive analysis of development of energy flow in the vehicle. Technical aspects and system function are defined in vehicle system technologies sub-window of input data window. Conversion processing depicts the flow of material/energy through an open system and its behavior is conditioned by the basic laws of physics and thermodynamics. List of inputs is defined as the energy/material carriers in the last system level in the section of system boundary. Type of fuel and its price is defined in this section. In addition, special limitation on the fuel supply such as institutional conditions can be considered in input to plant sub-window. When the actual vehicle is composed of a collection of boundary, environment, technologies and input to plant data, it can be stored in the database of the model. The collection data can be inserted into the model to connection of the defined control volumes to establish of energy flow from one component to the next. The model library approach allows the same component model to be reused in multiple vehicle configurations. It also allows the impacts of different models to be evaluated within single vehicle architecture. After processing of data, the library linked to Fortran codes (Matrix generator and optimizer) and then optimal results will be observed through the output report window depicted in Fig. 2. Output results of the model are categorized in below 8 parts:
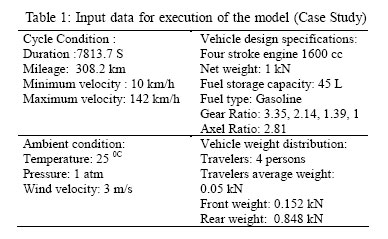
Initial data required to construct boundary conditions of the model for a case study, contains of following groups which is depicted in Table 1:
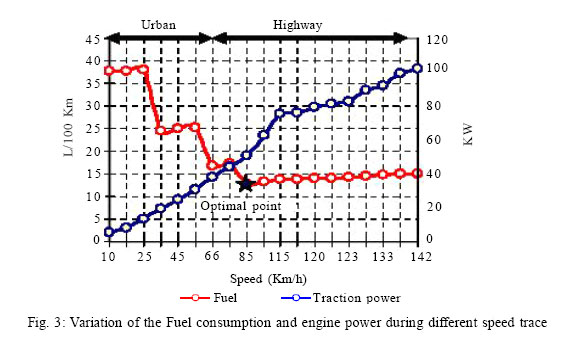
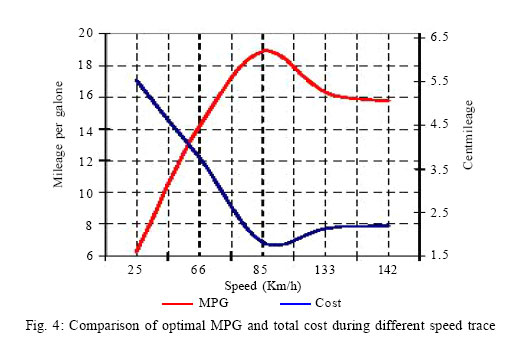
Model is applied to analysis of energy consumption in a case study with design specification that described in Table 1. Required power for the vehicle movement is the function of the traction force at the various range of speed trace. As we know, the traction force is a function of physical properties of road and whether and also, dimensions of the vehicle. The chosen cycle is divided into urban and highway sections. Because of traffic and institutional limitation, the vehicle moves through urban section with 1st. to 2nd. gear middling and through the highway with 3rd. to 4th. gear. Optimal fuel consumption is calculated by the model in different speed duration along mileage of the chosen cycle. It is viewed in Fig. 3, the fuel consumption decreased from the urban condition to the highway because of change of gear ratio. This can justify that the effect of gear ratio is more than increased resistance force in high speed. Trend of fuel consumption has descent growth until observed circle mark that will be the beginning point of movement with 4th gear at 85 km/h.This finding is consistence with the results obtained in (Test Number 120-44-XJ, 2005) and (VCA, 2003). Fig. 4 shows the comparison of the traversed mileage per consumed gallon of gasoline (MPG) with unit cost of travel in different defined scenarios. The maximum point of the MPG is obtained at 85 km/h speed trace. Maximum point ofMPGis coincided on the minimum point of unit cost that depicted excellent allegiance of the economic behavior from technical operation in the passenger vehicle. It is viewed in figure 4; fuel intensity is decreased from the urban condition to the highway because of decreasing of traffic intensity as institutional externality until the effect of resistance forces is appeared. Also resistance forces have tremendous effect on increasing of unit cost of operation in the highway cycle same as effect of traffic in the urban cycle. DISCUSSION AND CONCLUSIONAccording to the results of model, operation of the passenger vehicle with stated economic objective, would reflect the most effective use of energy strive towards optimal efficiency determines the technical operation of the passenger vehicle. Hence, minimization of total cost of the passenger vehicle provides a sound criterion for determining the optimal development path of operation of the vehicle performance and stability condition of the vehicle operation will be established in the minimum total cost that the firm of passenger vehicle will be at the economic equilibrium. Institutional externalities such as traffic hastremendous effecton energyconsumption in the aforementioned passenger vehicle during urban cycle and the effect of resistance forces is most important to increasing the energy demand through the highway cycle. REFERENCES
© 2007 Center for Environment and Energy Research and Studies (CEERS) The following images related to this document are available:Photo images[st07024f2.jpg] [st07024t1.jpg] [st07024f4.jpg] [st07024f3.jpg] [st07024f1.jpg] |
| |||||||||
