 |
| About Bioline | All Journals | Testimonials | Membership | News |
|
||||||
|
||||||
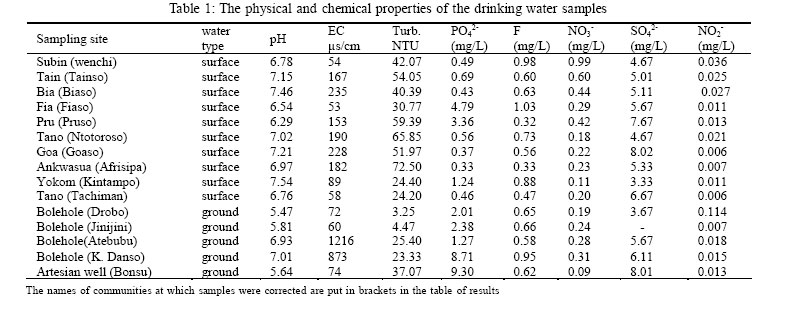
International Journal of Enviornmental Science and Technology, Vol. 4, No. 2, Spring 2007, pp.211-214 Chemical analysis of drinking water from some communities in the Brong Ahafo region 1*O. Akoto, 2J. Adiyiah 1Department of Chemistry, Kwame Nkrumah University of Science and Technology Kumasi, Ghana Received 21 November 2006; Code Number: st07027 ABSTRACT: This study consisted of the determination of the trace metals and some physiochemical properties in drinking water samples from the Brong Ahafo region of the Republic of Ghana, where drinking water samples are not treated before it is consumed. The purpose was to ascertain the quality of water from these sources. Samples were taken from fifteen sampling points and analyzed for the following parameters Fe, Cu, Mn, Zn, Al, NO3-, NO2-, SO42, PO42-, and F- using the procedure outline in the Palintest Photometer Method. The data showed the variation of the investigated parameters in samples as follows: pH 5.57-7.54, conductivity (EC) 35-1216 µs/cm, turbidity 3.25-72.50 NTU, PO42-1 0.32-9.30 mg/L, F- 0.32-1.05 mg/L, NO3- 0.09-0.99 mg/L, NO2- 0.006-0.114 mg/L, SO42- 3.33-8.02 mg/L, Cu 1.19-2.75 mg/L Fe 0.05-0.85mg/L, Zn 0.04-0.15 mg/L, Mn 0.003-0.011 mg/L and Al 0.05-0.15 mg/L. The concentrations of most of the investigated parameters in the drinking water samples from Brong Ahafo region were within the permissible limits of the World Health Organization drinking water quality guidelines. There were no correlations between metal concentrations in the drinking water samples. Key words: Trace metals, drinking water, Brong Ahafo, WHO, Physiochemical INTRODUCTIONGood drinking water quality is essential for the well being of all people. Unfortunately in many countries around the world, including Ghana, some drinking water supplies have become contaminated, which has impacted on the health and economic status of the populations (Anonymous, 1992). Contaminants such as bacteria, viruses, heavymetals, nitrates and salthave found their way into water supplies as a result of inadequate treatment and disposal of waste (human and livestock), industrial discharges, and over-use of limited water resources (Singh and Mosley, 2003). Even if no sources of anthropogenic contamination exist there is potential for natural levels of metals and other chemicals to be harmful to human health. This was highlighted recently in Bangladesh where natural levels of arsenic in groundwater were found to be causing harmful effects on the population (e.g. Anawara, et al., 2002). Unfortunately, this problem arose because the groundwater was extracted for drinking without a detailed chemical investigation. The natural water analyses for physical and chemical properties including trace element contents are very important for public health studies. These studies are also a main part of pollution studies in the environment (Kot., et al,. 2000 and Soylak. et al., 2002a).According to our literature review, there has been no published report concerning the trace metals and other possible contaminants in drinking water sources in these communities. In this work, concentrations of Fe3+,Cu2+, Mn2+, Zn2+ and Al3+ ions in drinking water samples from water sources in these communities were determined. Some physical and chemical properties of the samples were also determined by using standard analytical methods. Correlations between the metal concentrations were investigated. MATERIALS AND METHODSSample collection The drinking water samples were collected in prewashed (with detergent, diluted HNO3 and doubly de-ionized distilled water, respectively) polyethylene bottles. pH and conductivity of the samples were measured while collecting the samples. Each water sample was taken four times at four different sampling periods approximately three month apart. Samples were collected in February, May, August and November; 2005.The determinations of the major ions, physical and other chemical properties of the water samples were performed on the same day of sampling. For surface water sampling, the bottles and caps were rinsed three times with water to be sampled during sampling and for ground water, the samples were obtained directly from the water pump after allowing the water to run for at least five minutes and each sample bottle and its cap rinsed three times. These samples were subsequently stored at 4 °C for as short a time as possible before analysis to minimize physicochemical changes (Anonymous, 1996). Because very little particulate matter was present in the sample, filtration was not considered necessary. Methodology Analytical water test tablets (photometer grade) reagents for specific test were used for the preparation of all solutions. Each sample was analysis for Fe, Cu, Mn, Zn, Al, NO3-, NO2-, SO42-, PO42- and F- using procedures outline in the Palintest Photometer Method (Palintest Photometer 5000) for the examination of water and wastewater. RESULTSThe average physical and chemical properties of the drinking water samples including pH, electrical conductivity, turbidity, phosphate, fluoride, nitrate, sulphate and nitrite from these sample points were given in Table 1. The pH values were in the range of 5.47 to 7.54. Minimum pH (5.74) was observed from an artesian well at Bonsu village and a maximum of (7.54) was observedfrom theYokom stream at Kintampo. The pH levels were lower than permissible limit (6.5-8.5) in 21% villages, the rest were within optimum limit. The recommended permissible limit for electrical conductivity (EC) is 300 µs/cm. By analyzing the results 96% villages showed EC lower than permissible limit. The value for EC ranged from 53 to 253 µs/cm, except that of the groundwater samples from Kwame Danso and Atebubu which recorded 873 µs/cm and 1216 µs/ cm respectively. Turbidity is a measure of the cloudiness of water. It has no health effects. However, turbidity can interfere with disinfection and provide a medium for microbial growth. Turbidity may indicate the presence of disease causing organisms. These organisms include bacteria, viruses, and parasites that can cause symptoms such as nausea, cramps, diarrhea, and associated headaches (US EPA 2003). All the samples have turbidity values greater than the WHO permissible value of 5 NTU except that of the groundwater sample from Jinijini and Drobo villages which recorded values of 4.47 NTU and 3.25 NTU respectively. Phosphate (PO42-) ranged from 0.33 to 9.30 mg/L. Fluoride (F-) varied from 0.32 to 1.03 mg/L. Minimum (0.32 mg/L) and maximum (1.03 mg/L) concentration of F- was observed from Pruso and Fiaso villages respectively (Table 1). Permissible limit for F-concentration is 1-1.5 mg/L according to WHO (2003). The data revealed that all the villages had lower F-values. Nitrate and nitrite (measured as nitrogen) in the investigated samples were found to be in a range of0.09 to 0.99 mg/L and 0.006 to 0.114 respectively. The range of sulphate (SO42-) in the samples was 3.33 to 8.2 mg/L but was negligible at Jinijini throughout the sampling periods. Nitrate, nitrite and sulphate concentrations were all below the WHO permissible limits. The concentrations of the major ions were below the permissible limits given by the WHO. The concentrations of trace metals (Cu, Fe, Zn, Al and Mn) ions in the drinking water samples are presented in Table 2. The lowest and the highest levels of trace metals detected ranged between 0.003 mg/L for manganese in the sample from Atebubu and 2.75 mg/L for copper from the Subin stream at Wenchi villages. The highest level of total trace metals ions were found in the water sample from Subin. Average copper concentrations in the drinking water samples were in the range of 1.19 to 2.75 mg/L. The levels in all the stations were above the limit of 1.0 mg/L permitted byWHOin drinking water.This indicates that the local mineral deposit in the catchment area studied mayhave high levels of copper. Copper is an essential nutrient, but at high doses it has been shown to cause stomach and intestinal distress, liver and kidney damage, and anemia (US EPA, 2003). The highest iron level was found in the sample from Subin as 0.85 mg/L and the lowest in Pru as 0.05 mg/L, almost all the samples contain higher amount of iron except in Pru where it was below the acceptance limit of iron which is 0.1 mg/L permitted by the WHO. The levels of zinc in the samples wereinthe rangeof 0.04mg/Lto 0.15 mg/L(minimumin Bia stream and maximum in the groundwater sample from Brobo). None of the drinking water samples analyzed for zinc exceeded the limit permitted by WHO. Average manganese levels were found to be in the range of0.003 mg/L to 0.011 mg/L.Manganesecontent in all the water samples were below the WHO permitted limit which is 0.05 mg/L. Aluminum concentration in the drinking water samples were in the range from a minimum of 0.05 mg/L from Goa stream at Goaso to a maximum of 0.15mg/L from the river Tano at Ntotoroso. Aluminum was considerable below the limit of 0.5 mg/L permitted byWHO in drinking water. A linear regression correlation test was performed to investigate correlations between metal concentrations. The whole data were subjected to statistical analysis and correlation matrices were produced to examine the interrelationships between the investigated metal concentrations. Correlations between metal concentrations in water samples have been widely studied by a number of authors (Mohmood, et al, 1998 and Asubiojo, et al, 1997). The correlations between Cu-Zn, Cu-Fe, Cu-Mn, Cu-Al, Zn-Al, and Al-Zn were found as-0.937, -0.797, -0.846, -0.963, -0.963 and -0.937 respectively. According to the data given by literature (Miller and Miller 1998, and Soylak, etal, 2002 b), these correlations were not significant. DISCUSSION AND COLCLUSIONIn conclusion, the concentrations of the investigated major ions and trace metal ions in the drinking water samples from these communities in the Brong Ahafo region, Ghana were found below the guidelines for drinking waters given by the World Health Organization (WHO). Further research on other communities in this region for drinking water analyses is required as levels of contaminants may vary due to different soil types, water chemistry and different human activities. No correlations were found between metal concentrations in the drinking water samples. Table 2: The concentration of trace metals ion in the drinking water samples
ACKNOWLEDGEMENT The authors are grateful for the financial support of the Environmental protection Agency, Ghana, Government of Ghana and the Head, Brong Ahafo Regional EPA. for providing the necessary facilities. REFERENCES
© 2007 Center for Environment and Energy Research and Studies (CEERS) The following images related to this document are available:Photo images[st07027t2.jpg] [st07027t1.jpg] |
| |||||||||
