 |
| About Bioline | All Journals | Testimonials | Membership | News |
|
||||||
|
||||||
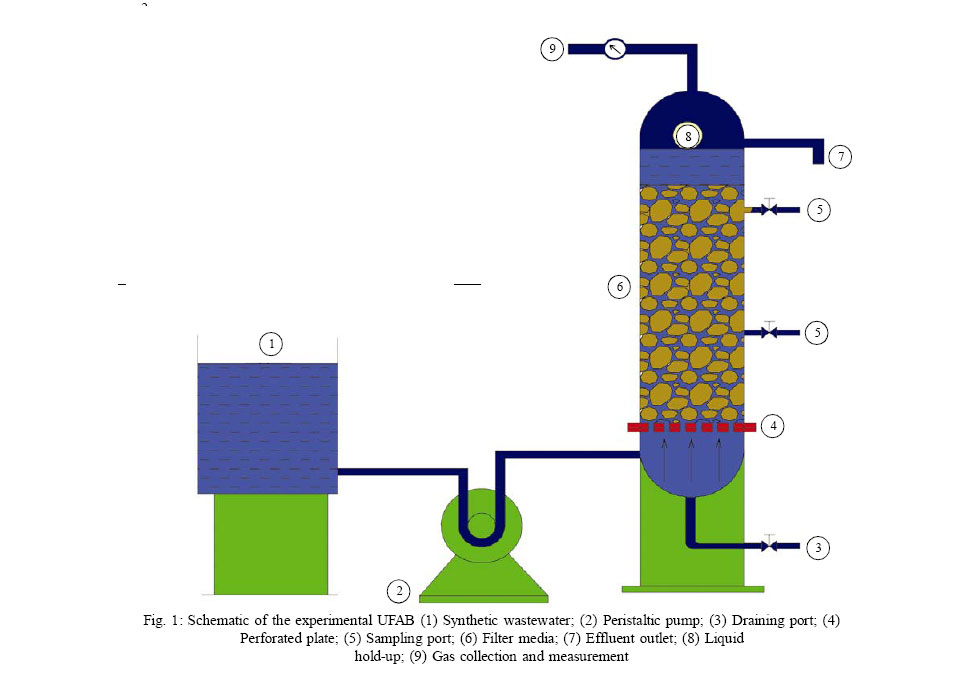
International Journal of Enviornmental Science and Technology, Vol. 4, No. 2, Spring 2007, pp.247-252 Performance of upflow anoxic bioreactor for wastewater treatment 1*S. K. Behera, 2E. R. Rene, 3D. V. S. Murthy 1Department of Civil and Environmental Engineering, University of Ulsan, South Korea Received 13 November 2006; Code Number: st07032 ABSTRACT: Laboratory scale studies were conducted in an up-flow anoxic bioreactor (UFAB) using synthetic fertilizer wastewater for ascertaining the denitrification efficiency. The performance of the reactor was compared using ethanol and topioca starch as the carbon source. The initial NO3-N concentrations (50-250 mg/L) and hydraulic retention time (HRT, 12-24 h) were varied to evaluate the COD and NO3-N removal. The results from this study shows that ethanol gave very good denitrification efficiency (78-98%) compared to topioca starch (68-96%). Key words: Denitrification, topioca wastewater, up-flow anoxic bioreactor, HRT INTRODUCTIONNitrogen is one of the principal nutrients of concern in treated wastewater discharges. The increased use of nitrate (NO3-N) fertilizers and discharge of partially treated industrial wastes to rivers leads to exceedingly high NO3-N levels in rivers and groundwater. High levels of NO3-N are a major contributing factor in the problem of eutrophication of water bodies. The drinking water standard set by the European Economic Community (EEC)for NO3-N is 50 mg/L, while 44 mg/L was set by the U.S. Environmental Protection Agency (USEPA). Nitrogen removal can be effectively accomplished by biological processes involving the nitrification and denitrification steps. Abu-Ghararah, 1996 investigated the influence of type of carbon source and NO3-N loading on the denitrification process of NO3-N contaminated drinking water in an anoxic static bed column. NO3-N loading in the range 0.240 -1.30 Kg NO3-N/m3.day was investigated. The results of the study have shown that the system should be operated at a maximum NO3-N loading of 0.45 Kg NO3-N/m3.day to treat waters having a NO3-N concentration of 500 mg/l to the allowable effluent NO3-N and NO2-N concentrations. Bilanovic, et al., 1999 studied denitrification under high nitrite concentration in fed-batch mode. Methanol, sodium acetate and effluent from anaerobic digesters were compared as carbon sources. A maximum nitrite removal rate was found to be 0.486 g NO3-N/ g VSS.day. Nitrite accumulated initially but its concentration decreased with time and reached zero when acetate or other effluents were used as carbon source. Up-flow anoxic bioreactors (UFAB) are biological systems that have proved to achieve high denitrification rates under controlled operating conditions. The main objective of the present study is to evaluate the COD and NO3-N removal efficiency using HRT and influent NO3-N concentration as the independent variables. MATERIALS AND METHODSExperimental The laboratory scale anoxic up-flow bioreactor used in this study is shown in Fig. 1. It was made of acrylic cylinder (100 mm ID*1100 mm height) having 8 lit capacity. Polyurethane foams in the form of 30 mm cubes were used as packing material which serves as supporting media for the micro-organisms in the reactor. The packed bed height was 64.5 cm. The reactor had perforated plates to hold the packing firmly. The perforations in the plate also ensured uniform distribution of influent wastewater through the reactor bed. The influent synthetic wastewater moved upward through the packed bed with different velocities based on hydraulic retention time (HRT). Along the reactor length, two taps were provided at heights of 23 cm and 44.5 cm from the base which served as sampling ports. The final effluent was collected after the substrate had moved through the complete packed height of 64.5 cm. The CO2 and CH4 gases were collected through outlet tap in tubes by the downward displacement of water. The substrate was fed into the reactor continuously by a variable speed peristaltic pump. Media composition The synthetic fertilizer wastewater compositions as shown in Tables 1 and 2 were used in this study, Menoud, et al., 1999. Tapioca starch slurry and ethanol were used as carbon sources. Table 1: Synthetic fertilizer wastewater composition
Table 2: Composition of nutrient solution
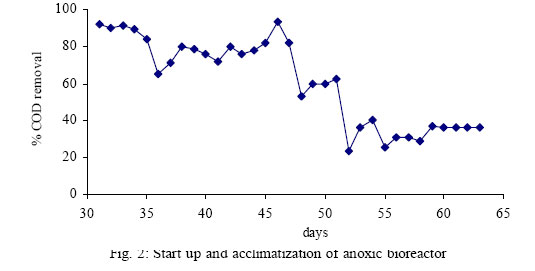
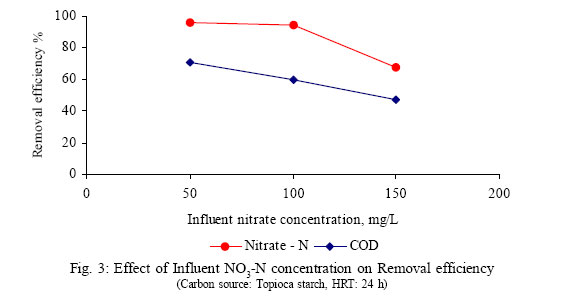
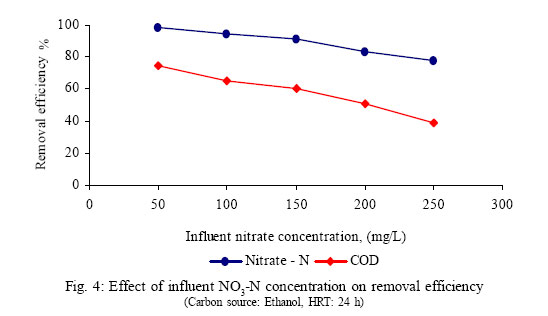
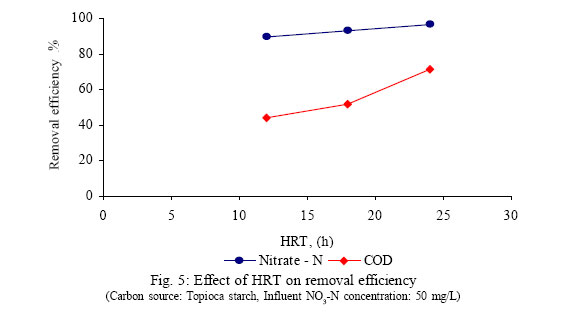
Start up and acclimatization Cow dung slurry of 8 L was fed regularly into the reactor with 24 h HRT for a period of about 4 weeks. Additionally, 500 mL of a mixture of sludge from a previously operated bioreactor and domestic sewage in equal proportion were also seeded for fast biofilm development. The pH of the cow dung slurry and sludge mixture was adjusted to 7.5 using sodium bicarbonate. After 4 weeks the cow dung slurry mixture was replaced by synthetic fertilizer wastewater at a rate of 10 % by volume in every 48 h till the cow dung slurry mixture was reduced to zero volume. The acclimatization step took 33 days for obtaining steady state removal of COD (40%) and biofilm development. Experimental procedure The required composition of synthetic fertilizer wastewater was prepared to a volume of 8 L and passed into the bioreactor at the required flow rate (0.66, 0.44, 0.33 L/h) with the help of a peristaltic pump. After acclimatization, during continuous experiments the influent NO3-N concentration was gradually increased in steps of 50 mg/L. 16 gm of topioca starch powder was added to 8 litres of synthetic fertilizer wastewater. Similarly when carbon source was changed to ethanol, 6.25 mL of ethanol was added to 8 litres of synthetic fertilizer wastewater. These amounts were taken by determining the COD values of topioca starch and ethanol. The dissolved oxygen values were maintained in the range of 0.6 to 1 mg/L. The HRT was varied between 12-24 h, while the NO3-N concentrations were between 50-250 mg/L depending on the carbon source. COD and NO3-N analysis were performed according to the procedure outlined in Standard Methods (APHA, 1992). RESULTS To understand the denitrification performance in UFAB using two different carbon sources, a synthetic wastewater of a known composition was fed to the bioreactor. During the start-up period the pH of the influent and effluent was monitored and was found to be fluctuating in a normal way (7-7.8). 33 days of acclimation was considered sufficient for the bioreactor based on the results. During this period, glucose was used as the carbon source. A near steady state was observed in % COD removal for about five days (Fig. 2) following which regular experiments were performed to monitor the effect of HRT and influent NO3-N concentration on COD and NO3-N removal. Fig. 3 shows the percentage NO3-N nitrogen and COD removal efficiency variation with influent NO3-N concentration when topioca starch was used as carbon source and HRT was 24 hours. As the influent concentration of NO3-N nitrogen increases (50 to 150 mg/L) the NO3-N nitrogen and COD removal efficiencies decreased. Fig. 4 shows the NO3-N and COD removal efficiency variation with influent NO3-N concentration when ethanol was used as carbon source and HRT was 24 h. As the influent concentration of NO3-N nitrogen increases (50 to 250 mg/L) the NO3-N nitrogen and COD removal efficiency decreased. Rajapakse and Scutt, 1999 investigated the treatment of synthetic wastewater (by dissolving NaNO3 in tap water) using methanol as the carbon source. Their results reveal that, as influent NO3-N nitrogen concentration increased, denitrification efficiency decreased. This tendency is similar to the present results of the synthetic fertilizer wastewater investigation carried out. From these figures, it is evident that ethanol yields better denitrification efficiency compared to tapioca starch. When topioca starch was used as carbon source and influent concentration increased from 100 to 150 mg/L, NO3-N nitrogen removal efficiency drastically reduced by 26.6 %, whereas when ethanol was used as the carbon source NO3-N nitrogen removal efficiency is just reduced by 3.35 %.In the case of topioca starch as carbon source, it has to undergo hydrolysis as well as acid production stages before it becomes an alcoholic compound. But ethanol being a direct alcohol acts quickly and serves as a ready carbon source. Probably this is the reason for the enhanced efficiency in the case of ethanol as carbon source. The NO3-N nitrogen and COD removal efficiency variation with HRT when topioca starch and ethanol were used as carbon source and influent NO3-N concentration was 50 mg/L is shown in Figs. 5 and 6 respectively. It can be seen that the denitrification efficiency and % COD removal efficiency increased with increase in HRT. DISCUSSION AND CONCLUSION An increase in NO3-N concentration in the influent (50 to250 mg/L) decreases the NO3-N removal efficiency in UFAB. When topioca starch was used as the carbon source, denitrification efficiency reduced from 96.4 to 68 % while the denitrification efficiency reduced from 98.2 to 78 % when influent NO3-N nitrogen concentration increased from 50 to 250 mg/L for ethanol. With increase in HRT, denitrification efficiency increases irrespective of type of carbon sources. But at minimum HRT of 12 h (taken in this study) ethanol yields better denitrification efficiency of 92.4 % compared to topioca starch of 89.5 % at same influent NO3-N concentration of 50 mg/L. The results from this study can be applicable for treating topioca and ethanol laden wastewater in field applications. ACKNOWLEDGEMENTSThe authors would like to gratefully acknowledge their thanks to IIT Madras for funding this research work. REFERENCES
© 2007 Center for Environment and Energy Research and Studies (CEERS) The following images related to this document are available:Photo images[st07032t2.jpg] [st07032f5.jpg] [st07032f4.jpg] [st07032f2.jpg] [st07032f1.jpg] [st07032t1.jpg] [st07032f3.jpg] |
| |||||||||
