 |
| About Bioline | All Journals | Testimonials | Membership | News |
|
||||||
|
||||||
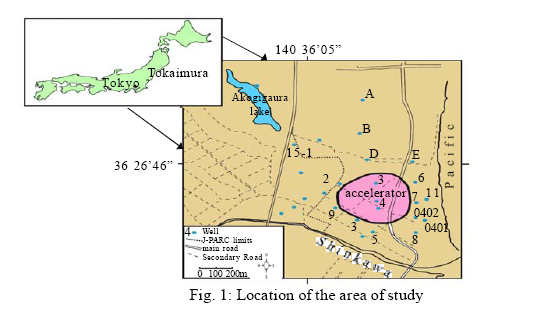
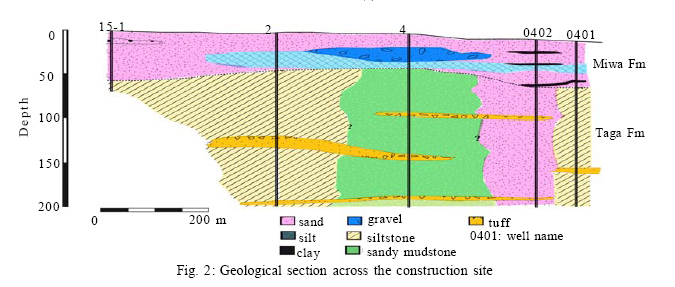
International Journal of Enviornmental Science and Technology, Vol. 4, No. 3, Summer 2007, pp. 285-294 Modeling the dynamics of the freshwater-saltwater interface in response to construction activities at a coastal site *A. H. Gallardo; A. Marui AIST, Geological Survey of Japan Higashi 1-1-1, Central 7, Tsukuba 305-8567, Japan *Corresponding Author Email: ad.gallardo@aist.go.jp Tel./Fax:+8129 861 3684 Received 9 February 2007; Code Number: st07037 ABSTRACT A numerical model was developed to evaluate the response of groundwater flow and the fresh-saltwater interface in relation to the construction of a particle accelerator at the coastal plain of Tokaimura, Japan. Undisturbed conditions were initially simulated and validated against field observations as a prerequisite for the analysis of predictive scenarios. Groundwater heads and the shape of the saltwater interface were appropriately described by the model, although it tended to underestimate salinity concentrations. Saltwater penetrated up to 250 m inland during predevelopment conditions, reaching more than 400 m at the dewatering phase. Flushing of entrapped saline groundwater might occur in addition to seawater intrusion. In depth, multiple saltwater fronts develop in response to the hydraulic properties of the sediments. Groundwater discharges offshore through the sandy aquifers, but salinity fronts prevail in the relatively impermeable layers. Routes for freshwater outflow turned into pathways of seawater intrusion during the pumping phase. The equilibrium would be reestablished within 2 years from the end of the stress, with no evidence of a permanent deterioration of neighbor residential wells. Nonetheless, after construction the accelerator forms a barrier that leads to a sharp rise in piezometric levels and creates a new and long-term disequilibrium in the saltwater wedge. Despite further work is still necessary to test many of the ideas proposed, the present study makes a new contribution to enhance the understanding of the processes occurring in coastal aquifers subjected to anthropogenic influence. Key words: Freshwater-saltwater interface, numerical modeling, groundwater, salinity, construction INTRODUCTIONNear the shoreline, fresh and saltwater maintain a delicate balance reached after thousands or million of years. The construction of a particle accelerator at the coasts of Tokaimura is one of the most important projects currently carried out in Japan. However, there are still a number of uncertainties regarding the impact of the engineering works, and the disturbance the new facilities will introduce into the long-established water regime. A potentiometric depression was generated at the center of the site for excavation purposes. The disequilibrium is expected to be temporary but there are no quantitative estimations to evaluate the persistence of the cone of depression and its possible impact on the neighbor residential wells. Another factor that needs great attention is the possible interference of the development on the salinity patterns of the coastal zone. Prolonged pumping of groundwater can lead to salt contamination of freshwater aquifers and soils (Bear, et al., 1999). In addition, the accelerator can intersect the seepage of groundwater into the sea altering the conditions at the fresh-saltwater interface. Therefore, understanding the changes in groundwater flow and the response of the saltwater wedge to anthropogenic modifications becomes of paramount importance in an engineering program. Groundwater levelsand salinity concentrationshavebeen monitored at selected wells for a few years. Even when this data provided a basis to track the movement of seawater, a numerical simulation is one of the most reliable tools to effectively evaluate the adjustments of the transition zone over the long-term. The presence of salt alters water density to induce important effects on the pressure and flow fields and thereby on the dynamics of the system (Kolditz, et al., 1998; Paniconi, et al., 2001). Thus, the present paper presents the results from a numerical model to assess the influence the construction of a particle accelerator may have on the groundwater flow and the freshwater-saltwater zone at the coastal area of Tokaimura, Japan. Moreover, natural conditions under predevelopment were also evaluated as a prerequisite to address the magnitude of the anthropogenic impacts. In sum, the study consisted of three phases: analysis of the undisturbed situation, assessment of the effects of groundwater abstraction (dewatering stage), and finally, forecast changes at the transition zoneafter the construction iscompleted. While the model approach used is concise, the study updated the hydrogeological characteristics of the site, answered a number of questions regarding the response of the system to construction stresses, and provided environmental managers with a scientific platform from which to base future decisions, in particular, with regard to the use of land and groundwater resources. In addition, findings from the present work can be extrapolated to other coastal sites and are instructional to get a better understanding of the dynamics of the freshwater-saltwaterinterfacein areas meeting natural and/or human disturbances. Hydrogeological setting of the area Construction of the particle accelerator takes place within the J-PARC (Japan Proton Accelerator Research Complex) campus at the coastal area of Tokaimura, approximately100 km northeast ofTokyo (Fig. 1).The projected tunnel has a maximum diameter of nearly 500 m located on a plain delimited by the Pacific Ocean to the east, and the Shinkawa River to the south. At the watershed scale, the elevation ranges from 0 m at the shoreline to 38 m above mean sea level (a.m.s.l) at the water divides. The hydrologic system is dominated by the Shinkawa River whose waters are diverted into a network of channels, ponds, and control structures to irrigate the rice fields developed in the alluvial valleys. The artificial canals have a limited width and depth, and are lined with concrete on all sides which means they are isolated from the aquifer system. Shallow wells are abundant throughout the region however, extraction rates are limited to domestic uses. Geologically, the site of interest is filled with sediments of the Neogene Tertiary and the Quaternary: conglomerates, sandstones, siltstones, tuffs and clays. Horizontal and vertical changes of facies are common and as a result, physical properties of the sediments have an appreciable different character. The Miwa formation deposited during the last interglacial transgression is at the top (Sakamoto, et al., 1972).Ithas athicknessof 50 mbeneath the accelerator site, and can be divided in three members: gravel and mud filling channels at the bottom, fluvial gravels in the middle, and sands at the top. The Taga Fm from the late Miocene is beneath. Drilling to a depth of 200 m below the ground was not enough to reach its base. The unit consists mainly of sandy mudstones and siltstones rich in marine fossils, and a number of intercalated tuff layers attributed to subaqueous pyroclastic flows. The tuffs are irregularly distributed which a thickness from a few cm to about 10 m (Fig. 2). The Miwa Fm acts as an unconfined aquifer. Depth to the water table is usually between 3 to 6 m below the ground. The Taga Fm has a lower permeability and constitutes the basement of the aquifer. Thin horizons of permeable materials are intercalated in the formation and therefore,it can beconsidered a multi-aquifer system. MATERIALS AND METHODSMeasurements of the groundwater level and samples for water qualitywere collected every 24hours at selected monitoring wellsfrom December2001 toFebruary 2006. Electrical conductivity(EC) was also determinedat some of the wells on an hourly basis. Concentrations of NaCl were used in the analysis of salinity. A numerical model was applied to investigate the flow of groundwater and the salt-transport mechanisms, giving particular attention to the shallow aquifer. The selected code was SEAWAT (Guo and Langevin, 2002), a combination of MODFLOW (McDonald and Harbaugh, 1988) and MT3DMS (Zheng and Wang, 1999) capableofsimulating three-dimensional,variable-density groundwater flow in porous media. The code is based on a finite-difference approach, and solves the governing equation for variable-density groundwater flow in terms of equivalent freshwater heads. Then, the governing equation as used in SEAWAT can be described by the following equation:
where, z is the coordinate direction aligned with gravity [L]; ρ is the fluid density [ML-3]; ρf is the density of freshwater [ML-3]; Kf corresponds to the equivalent freshwater hydraulic conductivity [LT-1]; hf is the equivalent freshwater head [L]; Sf is the equivalent freshwater storage coefficient [L-1]; t is time [T]; n corresponds to porosity; C is the concentration of the dissolved solute [ML-3]; ρ* is the fluid density of a source or sink [ML-3]; and q* is the flow rate of the source or sink [T-1]. In addition to the flow equation, a second partial differential equation is required to describe the solute transport in the aquifer. The transport of solute in groundwater is explained by the following equation (Zheng and Bennett, 1995):
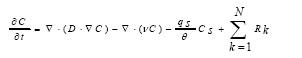
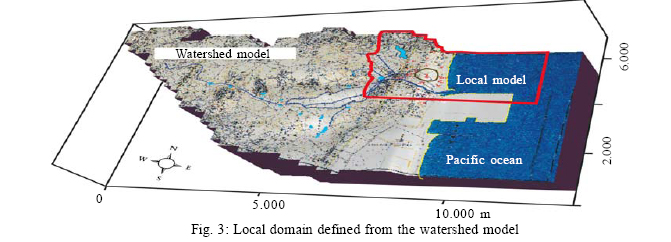
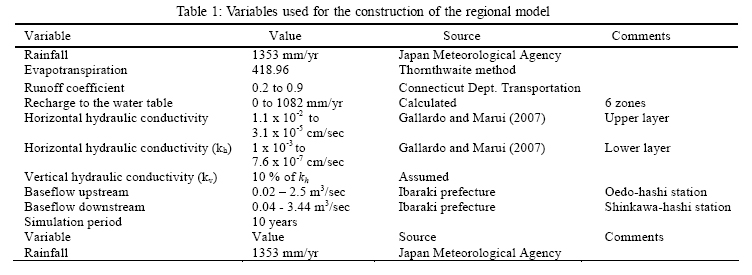
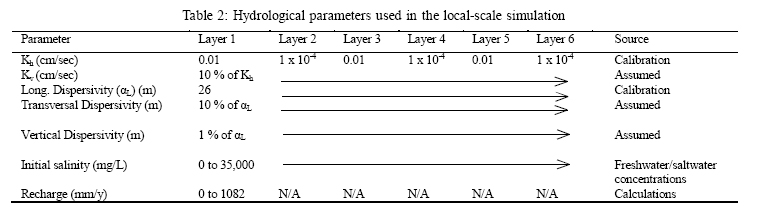
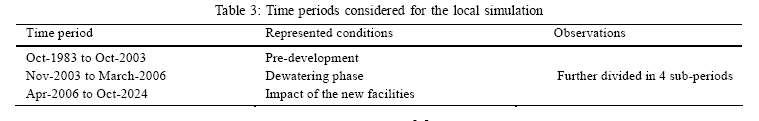
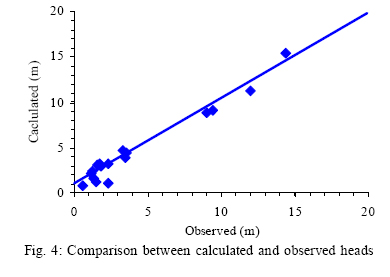
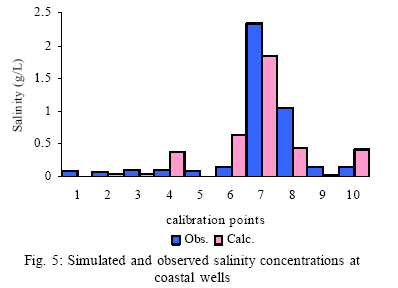
where, D is the hydrodynamic dispersion coefficient [L2T-1]; v is the fluid velocity [LT-1]; Cs is the solute concentration of water entering from sources or sinks [ML-3], and Rk (k=1,…N) is the rate of solute production or decay in reaction k of N different reactions [ML-3T-1]. Model configuration Regional scale model It was not possible to select a full set of boundaries around the area of interest therefore, the solution was achieved by the telescopic mesh refinement (Ward, et al., 1987). In this approach, a coarse grid is fitted to the regional boundaries and then, hydraulic boundaries for models covering smaller areas are defined from the large-scale simulation (Anderson and Woessner, 1992) (Fig. 3). The watershed has a total area of 13 by 7 km. To the east, the regional model was extended 3 km offshore the coast which was represented by a constant head boundary of 0 m. The area was discretized into 35 rows and 55 columns oriented along the geographic coordinates, and vertically represented from theground to a depth of 200 m below sea level. It was divided into 2 layers, the upper unconfined aquifer and the lower deposits of the Taga Fm. Geologic information was derived from 9 exploratory wells distributed over the coastal area (Gallardo and Marui, 2006), while sediment properties were established through the physical analysis of more than 300 samples (Gallardo and Marui, 2007). Forthe upper layer, permeabilityranged from1.1 x 10-2 to 3.1 x 10⁻⁵ cm/sec. For the lower unit, it varied between 1 x 10⁻³ to 7.6 x 10⁻⁷ cm/sec. The ground elevation is variable, and was constructed from digital maps edited bythe Geographical Survey ofJapan (1997). Rechargeto the water table was estimatedby subtracting evapotranspiration and surface runoff from the mean precipitation fallen during theperiod 1990-2005. Records of rainfall are available at the database of the Japan Meteorological Agency, of public domain. On the other hand, evapotranspiration rates were derived from monthly temperatures in the area by the Thornthwaite method. This method is regularly used for the calculations because of its low data requirements (Varni and Usunoff, 1999). Finally, a runoff coefficient was specified according to the land use. Based on these calculations, recharge was assigned to the top layer in six zones varying between 0 and 1082 mm/yr. The flow of the Shinkawa River is being measured monthly by the Ibaraki prefecture at two stations, with values between 0.02 and 10.1 m3/sec upstream (Oedo-hashi station), and 0.04 and 13.4 m3/secnear theriver mouth (Shinkawa-hashi station). Using the hydrograph separation method (Linsley, et al., 1982), it canbe concludedthatthe baseflow is approximately0.02 - 2.5 m3/secat the upstream station, and 0.04 and 3.44 m3/sec downstream (Table 1). The simulation was performed for a period of 10 years assuming steady-state conditions, and results were calibrated by adjusting the input parameters to find a match between calculated and observed flow in the river. The difference between measured and observed flow was 0.08 %. In addition, the water balance of the whole area showed that the difference between inflows and outflows was 0.15 %, a value low enough to suggest a successful simulation (Waterloo Hydrogeologic, 2005). Local-scale model Groundwaterheadsfrom the regional modelwere used to set the new boundary conditions at a more detailed scale. As seen in Fig. 3, water divides on the north and the sea were kept unmodified, while a no-flow boundary was set on the south. A specified-head boundary delimited the model to the west. The new domain was reduced to an area of 4.1 by 3.1 km with a mesh of 50 rows and columns refined around the construction site. At the local scale, density-flow systems require a finer vertical resolution because vertical density gradients must be resolved to accurately calculate the flow (Langevin, 2003). Therefore, the model was further divided in six layers: the upper one still represented the unconfined aquifer within the Miwa Fm; the Taga siltstones and mudstones which dominate most of the sequence were replaced by three layers; the intercalated tuffs were represented as two thin layers. Unlike the previous model, a single value of hydraulic conductivity for each unit yielded the best results (Table 2). A constant salt concentration of 35 kg/m3 was applied to the outermost cells in the ocean. Initial conditions for salinity were generated by trial and error, which resulted in 8 zones of variable concentrations between pure freshwater and seawater. Excavation dewatering took place from 7 well clusters extracting water to a maximum depth of 20 m around the construction. Implementation of a highly variable abstraction schedule led to numerical instability therefore, groundwater withdrawal was distributed over 7 periods of time apportioned on a total of 31 wells scattered around the accelerator perimeter. Along with a finer spatial discretization, the local model required a more detailed temporal resolution. Thus, the simulation was run for 15,000 days (about 41 years) starting in October 1983. Assuming the system reaches equilibrium over the long term, three main periods were considered for assessment of the results: pre-pumping conditions after 20 yrs of simulation, 859 days of pumping activities, and about 18.5 years to examine the impact of the new construction (Table 3). The model was calibrated by adjusting input parameters within a reasonable range until the simulated groundwater heads and salinity concentrations approximated the values observed in 17 wells. The calibration was performed for the end of the undisturbed scenario, when the simulated system would have reached steady state. The first step consisted in a trial-and-error procedure and then, parameter values were optimized with PEST (Doherty, et al., 1994). In general, there isan acceptable agreement between observed and calculated heads (Fig. 4). Nonetheless, the reliability of the model must be also assessed by some quantitative parameter. In this way, the normalized root mean squared (NRMS) was calculated by dividing the root mean squared error (RMS) by the maximum difference in the observed groundwater head:
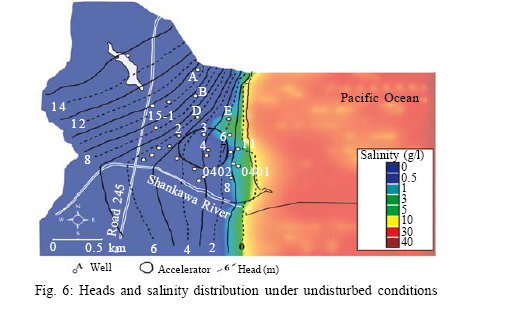
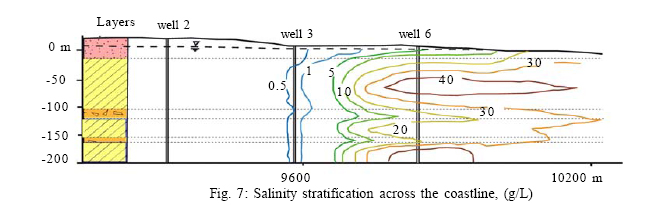
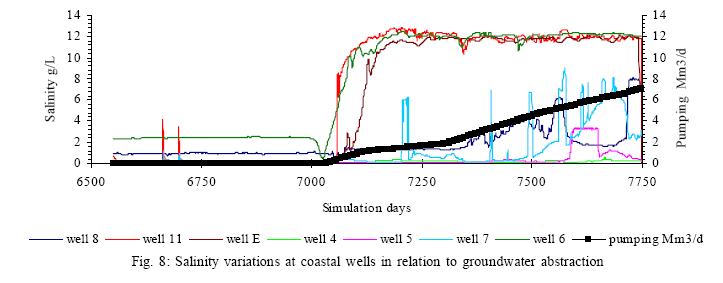
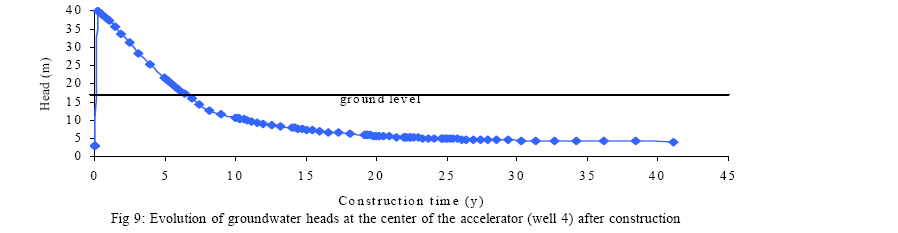
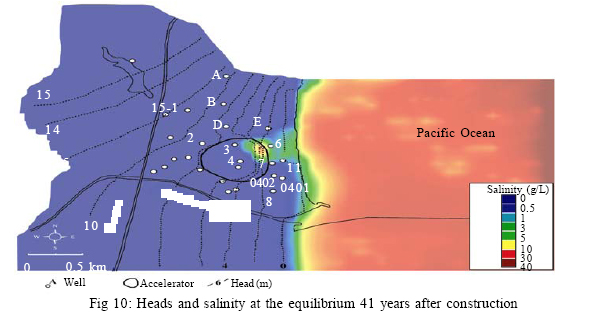
A reasonable calibration is achieved when it is less than 10 % (Waterloo Hydrogeologic, 2005), which was satisfied by the 9 %calculated in the present simulation. Other indications of a successful simulation are the low differences between water in and outputs to the system (0.2 %), and a correlation coefficient of 0.97. In contrast, even when the model reproduced satisfactorily the position and shape of the saltwater interface, it tended to underestimate its concentration values suggesting that more geologic data, especially at the sea bottom, would be necessary (Fig. 5) As stated by Langevin (2001), calibration discrepancies may be due to a poor representation of aquifer parameters, the effects of numerical dispersion, or disequilibrium of the saltwater intrusion line at the time of the observations. The first hypothesis seems to be the more probable since the dynamics of the seawater wedge is dependant on a complex arrangement of soil horizons with variable properties that can seldom be reproduced both in terms of geometry and time. In addition, offshore conditions were derived by extrapolation from inland wells which means, many issues regarding the seafloor remain unsolved. On the other hand, changes in the grid resolution were not corresponded with major changes in the salinity patterns suggesting that numerical dispersion would not have exerted a direct influence. Finally, salinity was monitored for 478 days during the pre-development phase without signs of significant variations in concentrations or any other trend indicative of a temporary disturbance in the saltwater front therefore, it seems unlikely these data reflect a situation other than natural conditions under equilibrium. RESULTSPre-development conditions The calibrated model was first applied to investigate flow and salinity under natural conditions, previous to the construction works. Groundwater converged to the ocean in two directions, NW-SE in the north, and SW-NE south of the Shinkawa River. Near the coast, flow turned into the W-E direction. The hydraulic gradient was somewhat variable, in the order of 0.02 in the north, decreasing to 4 x 10⁻³ - 5 x 10⁻³ on the southern margin of the river. The gradient reduced even more north of the Akogigaura Lake, suggesting it constituted a local-base level that intercepted part of the groundwater that otherwise would have moved directly to the sea (Fig. 6). The fresh-saltwater mixing zone was described by a series of narrow zones parallel to the coast, where concentrations varied gradually from seawater to pure freshwater in about 1500 m. The simulated seawater-front advanced inland approximately 250 m from the shoreline, but reduced to only a few meters toward the northern coasts. The most prominent plume of salinity occurred around well 6, where concentrations near the water table remained above 2 g/L. It is likely that the salinity anomalies were related to the influence of the medium. In effect, it has been observed that in some cases leaching of marine sediments is the primary cause of a rise in concentrations (Sanchez Martos, et al., 1999). The well in question locates at the boundaries of a buried channel with numerous levels of marine and fluvial terraces and therefore, it is possible that some of these horizons contain entrapped interstitial waters enriched in Cl, which are responsible for the elevated concentrations. The saltwater lobe reduced significantly a few meters to the south in front of wells 7 and 11, as more groundwater moved to the sea taking advantage of the higher permeability of the paleochannel. The channel constitutes a preferential way for the discharge of submarine groundwater, limiting the advance of the saline front towards the land. Thus, the more permeable sediments enhance the flow of groundwater to the ocean, while seawater propagates downward across sediments of lower hydraulic conductivity at the base of the aquifers. In agreement with results by Inouchi and Kakinuma (1992), and Holzbecher (1998), a vertical profile near the shoreline shows salinity is stratified with an individual front of saltwater intrusion for each aquifer-aquitard system (Fig. 7). While lower concentrations prevail near the water table, saltwater protrudes inland through the underlying aquitards. A similar pattern is seen at depth as more freshwater discharges through the tuff layers, which “pushes out” or act as a natural barrier to the advance of seawater. Furthermore, the simulation showed some disconnected patches of moderate salinity (in the order of 20 g/L) within the uppermost layer beneath the ocean. Salinity in these patches was lower than initial concentrations at the start of the simulation suggesting therefore the possible mixing of fresh and saltwater within the open sea. Initially, a large volume of fresh groundwater would spread into the sea favored by the hydraulic gradient, but over time, cells from the constant concentration boundary would provide sufficient salts to accumulate and mix up with the freshwater, evolving finallyinto a system of“freshwater bubbles” dispersed beneath the ocean. Construction dewatering As excavation activities proceeded, the equilibrium existing prior to October 2003 was severely disturbed by the induced dewatering, resulting in a general drop of the water level around the construction site. There was a gradual receding of groundwater from the coast, reaching the maximum drawdown at the center of the accelerator. As pumping continued, the cone of depression expanded toward the west and north where several wells started to dry up. This means the water Table was lowered below the bottom of the phreatic aquifer. In spite the failing wells were all situated within the construction, groundwater yields at some of the residential wells in the surroundings would have been temporarily affected too, as the simulated water table dropped approximately 1 m. These results are corresponded with field measurements, which recorded a groundwater drop in the order of 1.2 m. When the pumping finally ended, the maximum drawdown was approximately 6.5 m at the center of the excavations, 1 m at the residential wells to the southwest, and almost 3.8 m at the wellsbytheshoreline. Results indicate that the preexistent equilibrium would be reestablished within a period of 700 days. As expected, variations in the water level were accompanied by a shift in the freshwater-saltwater interface. The seawater front continued its advance through the surroundings of well 6, penetrating inland morethan400 m fromthecoastline. Salinityat the mentioned well showed an increase from 2 to 12 g/L after 14 monthsofpumping (Fig. 8).A similar trend was observed at wells E and 11, where concentrations rose drastically from 0.14 to more than 11 g/L. In addition, the increase in the abstraction rates at the last stage of the dewatering phase generated a negative hydraulic gradient that reduced the outflows along the paleochannel. Salinity concentrations doubled to more than 7 g/L for wells located around the canal vicinities (e.g., well 7), indicating that the same routes that transported freshwater to the ocean turned into pathways for saltwater intrusion. On the other hand, saltwater intrusion was attenuated south of the construction site (e.g., wells 5 and 8), since there was an inflow of freshwater from the Shinkawa river into the upper aquifer along with the groundwater drop. Even when the migration of seawater is essentially limited by the aquifer permeability (Kooi, et al., 2000), it is likely that the mobilization of interstitial salts have also contributed tospread the saline plumefurther inland, influencing thus the final distribution of concentrations within theaquifer. Impact of the constructed facilities After its construction, the development will create and impervious barrier intercepting the flow of groundwater and leading in consequence, to a significant piezometric rise around its perimeter. The most dramatic rise in heads is expected to occur during the first 7 years after the construction. The water level will easily reach the ground surface and therefore, mitigation measures will be required to prevent the flooding of the facilities (Fig. 9). The groundwater level would decline when considering longer periods of time. After 10 years, the water table at the center of the construction would settle at approximately 10 m below the ground, while it would tend to stabilize below 5 m after 25 years. It must be noted that these values are somewhat conservative since groundwater within the accelerator perimeter is expected to be subjected to higher evaporation rates which in turn, might lead to a more pronounced drop of the water level. The accelerator itself does not appear to produce a direct impact on the position of the fresh-saltwater interface, as this front remainsrelatively stable throughout the analyzed time-span. In this regard, the model depicts a diffuse transition-zone along the shoreline but in particular, it is notorious the presence of a plume with concentrations near seawater penetrating insidethefacilities, through the shallowaquifer (Fig. 10). Again, the absence of groundwater exploitation or any other disturbance that could promote seawater intrusion supports the idea that salinity might be associated to leaching of formation water. In effect, a rapid fluctuation in the groundwater heads generate a new hydraulic gradient which in turn, reactivates the flushing of the interstitial waters that were statically stored in the soil structure. Furthermore, the low mobilityof shallow groundwater within the accelerator area enhances the differential concentration of salts by evapotranspiration and in association with this phenomena, the presence of relatively impermeable sediments at the base of the aquifer prevent the leaching down and the dilution of theplumebyrecharge which promotes in consequence, a more substantial accumulation of salts within the water table. DISCUSSION AND CONCLUSIONA particle accelerator is under construction at the coast of Tokaimura, Japan. A numerical simulation was used to investigate the influence of the development on the flow and salinity patterns at the freshwater-seawater interface. In addition, natural conditions in the absence of anthropogenic disturbances were investigated as a basis for predictive modeling. The simulation results were validated against field measurements obtained before the construction dewatering. The model described appropriately the groundwater dynamics and the shape and movement of the saltwater front however it tended to underestimate salinity concentrations, suggesting that some of the aquifer properties that control the transport of solutes are still uncertain. The saltwater front migrated up to 250 m inland during pre-development conditions. It was hypothesized that along with seawater intrusion, interstitial Cl- may have migratedfrom soil horizons near the contact betweenTertiary andQuaternary formations. Further research will focus on chemical parameters and measurements of the isotopic composition of groundwater to discriminate the sources of salinity, and to gain a deeper insight into the geochemical processes taking place. Pumping activities altered the long-term equilibrium andproduced a readjustmentofthe transition zone, which turned the routes of groundwater discharge into pathways for seawater intrusion. At this stage, the salinity front advanced more than 400 m from to the coast, penetrating nearly to the center of the construction. Results indicated that groundwater yields have been temporarily disruptedduring thedewatering phase although there is no evidence of a permanent reduction in the supply rates, or any deterioration in the water quality of residential wells around J-PARC. According to the model, the pre existing equilibrium would be reestablished within a period of 700 days since the end of pumping. At the end of the construction the new development would intercept part of the flow of groundwater to the ocean leading therefore, to a sharp rise in the piezometric levels. The maindisturbance would last for about 7 years, anticipating thus the need to implement measures to prevent the flooding of the facilities. On the other hand, there would not be major changes in the freshwater-seawater interface, which is expected to remain relatively unaffected by the construction. However, flushing of interstitial waters and differential evaporation could play a significant role to origina plume of highsalinity withinthe internal perimeter of the accelerator. Even though more work is still necessary, the present simulation effectively reconstructed the cause-effect relationship between hydrological changes to construction activities at the coastal zone constituting thus, a useful tool to identify the major components affecting the dynamics of the freshwater-saltwater interface. Results from this study can be applied to other coastal sites under anthropogenic ACKNOWLEDGEMENTS The authors are especially grateful to the JAERI-KEK Group (High Energy Accelerator Research Organization, J-PARC) and Ibaraki prefecture authorities, for providing valuable information on groundwater chemistry, pumping rates, and river conditions. Many thanks are also extended to Dr. Narimitsu Itoh, Geological Survey of Japan for his constructive comments and advices. REFERENCES
© 2007 Center for Environment and Energy Research and Studies (CEERS) The following images related to this document are available:Photo images[st07037t1.jpg] [st07037f9.jpg] [st07037f7.jpg] [st07037t2.jpg] [st07037f6.jpg] [st07037f8.jpg] [st07037f5.jpg] [st07037f4.jpg] [st07037f1.jpg] [st07037f2.jpg] [st07037f3.jpg] [st07037t3.jpg] [st07037f10.jpg] |
| |||||||||

