 |
| About Bioline | All Journals | Testimonials | Membership | News |
|
||||||
|
||||||
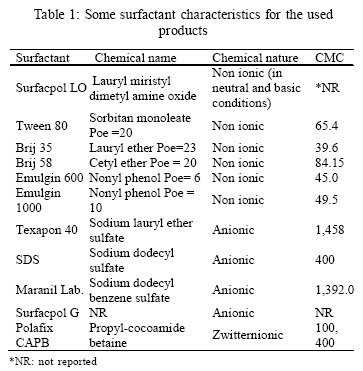
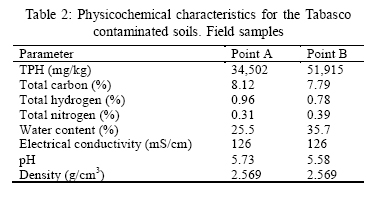
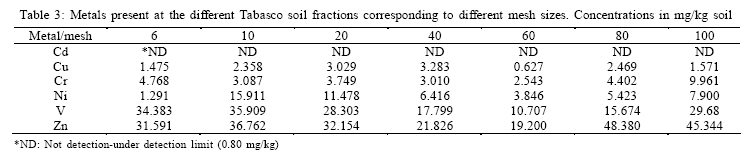
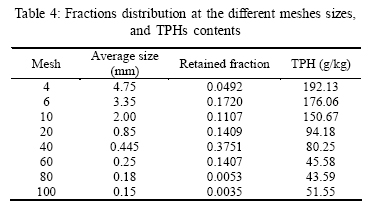
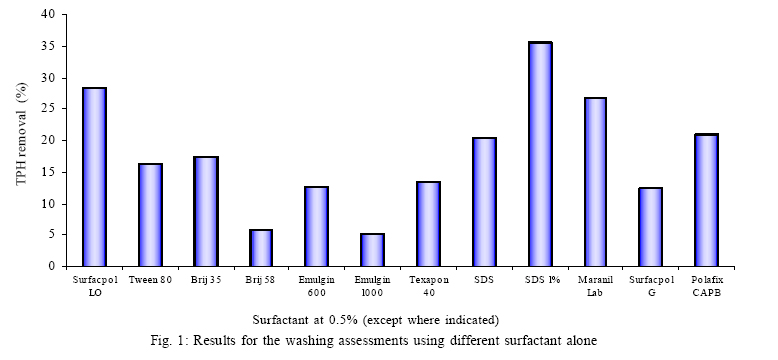
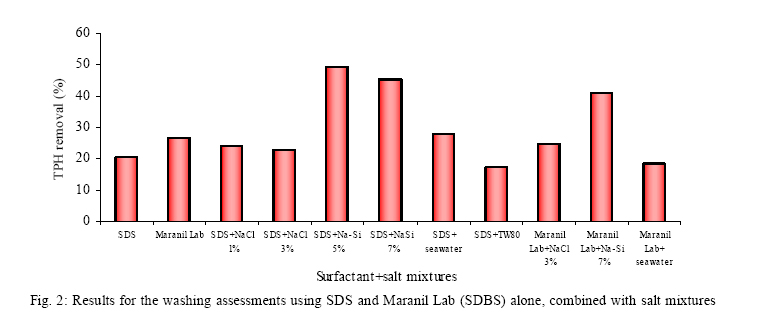
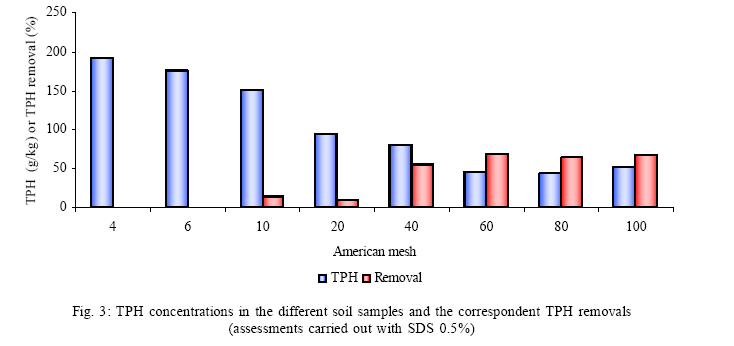
International Journal of Enviornmental Science and Technology, Vol. 4, No. 3, Summer 2007, pp. 311-322 Characterization and treatability of a contaminated soil from an oil exploration zone 1*L. G. Torres; 1M. Climent; 1J. Saquelares; 2E. R. Bandala; 1G. Urquiza; 1R. Iturbe 1Grupo Tratamiento de Suelos y Acuiferos. Coordinación de Ingenieria Ambiental, Instituto de Ingeniería. Universidad Nacional Autonoma de Mexico, Apartado Postal 70-472. Coyoacán 04510.México DF, Mexico *Corresponding Author Email: ltorresb@iingen.unam.mx Tel.: +5255 5623 3600; Fax: 5255 5616 2164 Received 29 March 2007; Code Number: st07039 ABSTRACT A crude contaminated soil, arising from an oil production zone in Tabasco, Mexico was studied. A sample of about 40 kg was dried and screened through meshes 10-100. Total petroleum hydrocarbons and 6 metals (Cd, Cu, Cr, Ni, V and Zn) were determined to the different portions. For soil which passed mesh 10, six non-ionic, three anionic and one zwitterionic surfactant solutions (0.5%) were employed to wash the soil. Additional tests using surfactant salt mixtures and surfactants mixtures were carried out. Once the best soil washing conditions were identified, these experimental conditions were applied for washing the rest of the soil portions obtained (meshes 4, 6, 20, 40, 60, 80, 100). Total petroleum hydrocarbons values were in the range of 51,550 to 192,130 mg/kg. Cd was not found in any of the soils portions, and the rest of the metals were found at different concentrations, for every soil mesh. Treatability tests applied to the soils indicated that it is possible to get removals between 9.1 to 20.5%. For the case of a sodium dodecyl sulphate 1% solution, total petroleum hydrocarbons removal was as high as 35.4%. Combinations of sodium docecyl sulphate and salts, gave removal rates up to 49.5%. Total petroleum hydrocarbons concentrations for the whole soil were about 150,600 mg/kg. The higher the particle size, the lower the washing removal rate. The combined effect of particle size and total petroleum hydrocarbons concentration, determines the total petroleum hydrocarbons removal efficiencies. These facts are very important for designing an appropriate soil washing remediation process. Key words: Particle size, surfactants, total petroleum hydrocarbons, surfactant enhanced soil washing INTRODUCTIONOil exploration and production zones are very frequently contaminated. In Mexico, the most important exploration and production zones are located at Veracruz and Tabasco states. There are several remediation techniques, which have proven to be an excellent option for remediation purposes. One of them is surfactant enhanced soil washing. Many paper related with surfactant enhanced soil washing deals with aspects such as the selection of ideal surfactant and doses, soil washing mechanisms and modeling of the process (Chu and So, 2001; Chu and Chan, 2003), the use of different driving forces for surfactant enhanced soil washing, i.e. air sparging and flotation (Zhang, et al., 2001; Urum, et al., 2005) and other engineering aspects (Zhou, et al., 2005).Our research group has been studying for years this remediation technique at laboratory, pilot plant and full-scale levels, for decontamination of soil containing diesel, gasolines, crude oil and other petroleum fractions (Torres, et al., 2003; Iturbe, et al., 2004 a; Iturbe, et al., 2004 b; Lopez, et al., 2004;Torres, et al., 2005a; Torres, et al., 2005b, Torres, et al; 2006). Kuhlman and Greenfield (1999) reported the washing of soils contaminated with petroleum hydrocarbons or metals at industrial level. They describe soil washing process grouped in modules, including a) a soil preparation module for removal and cleaning of oversize material and debris, b) a soil washing module to remove the contaminants, subdivided into equipment for washing sand and fines (<200-mesh or 74-µm). Authorsdescribe that this division has developed because lower surface area, larger sand grains are easier to process than fines fraction, which has one to three orders of magnitude larger surface area than the >200 mesh sand, c) a wastewater treatment module, to treat dirty water generated in the process, d) a residual management module, e) a volatile emission control module and finally, f) a wash water storage and management module. Yeh and Young (2003) studied cleaning ofsoilscontaminated with petroleum hydrocarbons by means of surfactant enhanced soil washing. They studied the cleaning procedure for two different soils containing different sand, silt and clay contents (and thus different cationic exchange capacity (CEC) and soil organic matter (SOM) values). They characterized the soils measuring the CEC and SOM values for coarse and fine fractions. They observed that fine fractions for both soils contained always SOM values higher than those values found at coarse fraction (up to 3 fold), while CEC values were higher at fine fraction in comparison to coarse fraction for only one soil. The interesting point was to measure the TPH removal in the fine, coarse and bulk fractions, when washing both soils with two different surfactants: one nonionic (Triton-100, TX-100) and one cationic dodecylpiridinum chloride, (DPC). At the end of the study, authors concluded that both CEC and SOM values in the soils affected the sorption of TX-100 and 2,6-dichloroindophenol DCP,thoughobviously DCP(as a cationic surfactant) was more sorbed to soil than the TX-100. Besides, they concluded that sufficient amounts and strong capacities of the fine fraction were both important in reducing the total petroleum hydrocarbons (TPH) level in the coarse fraction during soil washing. The questions arising form these facts are: how is the TPH contamination distributed along the soil fractions? How this TPH level affects the soil washing process? Is it easier to clean soil coarse or fine fractions contaminated with TPH? The aims of this work are three: 1) characterizing a soil highly contaminated with crude, arising form an oil exploration zone, including a characterization of TPH and metals level at different fractions, 2) evaluate the surfactant soil washing efficiencies for the whole soil using single surfactants and mixtures and 3) evaluate the surfactant soil washing efficiencies for different soil particle sizes. MATERIALS AND METHODSA 40 kg soil sample arising to an oil exploration zone at Tabasco, Mexico, was received and kept at 4 ºC before its characterization. Subsamples were obtained from the parent sample and used to characterize its physical and chemical composition. TPH and 16 Polycyclic aromatic hydrocarbon PAH, considered by USEPAas prioritypollutants, pH, electrical conductivity, nitrogen and carbon contents, water content, metals (Cd, Cu, Cr, Ni, V and Zn) and density assessments were carried out to those samples. After initial characterization, soil was dried at environmental temperature and was milled. After that, it was passed by different mesh sizes, from mesh 10 (1,700 µm), until mesh 100 (150 µm). Particles bigger than mesh 10 were separated, since they were comprised for big hydrocarbon agglomerates covered by thin layers of sand. These particles were not able to break in that kind of mill, since theyareplastic, andwere kept apart.After this process, TPH and metals(Cd, Cu, Cr, Ni, Vand Zn) were evaluated in every one of the meshed samples. Initial approaches for identify the best reactive to be used for surfactant enhanced soil washing assessments were carried out using 11 different surfactants as shown in Table 1, together with some of their main characteristics, including their chemical nature (i.e., anionic, nonionic, zwitterionic), their chemical names, and the critical micellar concentration (CMC). Surfactant enhanced soil washing experimental runs were performed as follows: Six grams of soil (mesh 10) were washed in a 40 mL amber vial, with 20 mLof water or surfactant solution, using gentle agitation during 23 h, at room temperature. After this time, soil was allowed to settle for 1 h and resulting solution was discharged. Clean soils were dried and measured for TPHs concentration using a gravimetric technique. Previous experiments showed that results for this technique varies between 4 and 5%. In order to evaluate the effect of ionic strength on surfactant efficiency for soil washing, soils were washed using water and seawater (SW), as well as surfactants solutions (those surfactants with the highest efficiency) prepared in tap water or sea water. Washing removals were calculated taking into account the water content of samples and the initial TPH concentrations. Once the best conditions (surfactant type and concentration, water type, and salt concentration) were identified, every one of the soil portions (i.e. mesh 4, 6, 10, 20, 40, 60, 80 and 100) were washed using these experimental conditions, in order to determine the effect of the particle size over the soil washing rates. RESULTSTabasco contaminated soil characteristics On Table 2, some physical-chemical properties of the contaminated soil are shown. It is important to remember that these measurements were taken in situ at the exploration zone (points A and B). As it was mentioned earlier, besides the TPH and the other measurements showed, the 16 PAH considered as prioritary by USEPAwere also evaluated in every sample. None of the sub-samples showed presence of the tested PAH in values over the detection limit for the measurement technique. TPH values found for the two sampling sites (sites A and B), showed an important heterogeneity in the contaminated soils (34,502 and 51,915 mg/kg, respectively). Soils show a lot of product conglomerates covered by thin layers of sand. Some particles showed values up to 0.16 m size. Values for C, H and N were evaluated because they are interesting if the proposed remediation treatment is a biological one. Concentration of C, H and N were quite similar for both sampling sites. The water content for soils was between 25 and 35%, considering this high water content we decided to dry the soil at environmental conditions prior to perform further characterization assessments and the treatability tests. The electrical conductivity for both samples (as an indirect measure of the soil salinity) was the same, 126 mS/cm. This value corresponds to normal soils with an electrical conductivity in the range of 0-2 dS/m. Regarding the pH values, soil samples showed very close values (5.73 and 5.58, for site A and B respectively), and both indicates that soil is moderately acid (5.1 to 6.5 unities). Finally, soil density for both samples resulted in 2.569 g/cm3, which is a very useful parameter for converting volumes to weights of soil. Metals distribution for the different soil meshes is presented on Table 3. We were not able to determine Cd over the method detection limit (MDL), 0.08 mg/kg) in any of the samples. Regarding the rest of the metals (Cu, Cr. Ni, V and Zn), it is important to underline that none of the values were over the Mexican legislation values (SEMARNAT, 2003). It seems that there is no a clear path in the distribution tendency for the five metals in the meshes 6, 10, 20, 40, 60, 80 and 100. Cu showed its maximum concentration at mesh 40, while Cr was present in the higher concentration at mesh 100. On the other hand, the maximum concentration value for Ni, V and Zn were found at meshes 10, 10, and 80, respectively. Lower metal concentrations were found at mesh 60, with exception of Ni, which was present in the lower concentration at mesh 6. It has been reported (Toeberman, et al., 1999) the following tendency; the lower the particle size, the higher the TPH concentration. This tendency has been reported previously at least for coarse and fine fractions (Yeh and Young, 2003). Toeberman, et al. (1999) reported a soil characterization for a soil contaminated with mineral oil. Particle sizes between the intervals of 0-45 m and 2000-4000 µm were found, with mass fractions between 0.82 % (for the 45-63 µm range) and 41.7 % (for the 180355 µm size interval). The mean values within size interval contamination by mineral oil were between 376 mg/kg (for the 355-630 µm) and 20,618 mg/kg (for the 45-63 µm size interval). Inresume, maximum mineral oil concentrationswerefound at the relativesmall particles fraction with a low mass fraction, while lower concentrations were found at bigger particles fractions with a high mass fraction. TPH values in the soils from different meshes, Table 4 shows the TPH distributions in meshes from 4 to 100. In our case, we observed that the higher the particle size, the higher the TPH concentration, except for the fines fraction. The mesh 80 soil showed the minimum TPH concentration (43,590 mg/kg), while mesh 100 showed a higher TPH concentration, i.e. 51,550 mg/kg. This behavior is easily explained if we considered that bigger particles are big dry TPH conglomerates, covered by thin layers of sand. As far as we know, this tendency has not been reported before and has profound implications for the washing of this kind of soils using surfactant solutions, as it will be discussed in the next section. In resume, TPH concentrations in the samples ranged from 43,590 mg/kg (mesh 80, corresponding to particles about 0.18 mm), and 192,130 mg/kg (for mesh 4, corresponding to particles of about 4.75 mm). In the same table it is possible to observe the retained fractions for the different meshes. As an example, it is quite clear that the more abundant fraction is mesh 40 (0.445mm) with a 0.3751 retained fraction), with a TPH concentration of 80,250 mg/kg. These results are quite different from the results showed at Table 2. It is important to remember what it was stated before: soil is highly heterogeneous and contents a lot of big dry TPH conglomerates. Another source of error is that the values in this table are reported in dry basis, while the results in Table 2 are reported in wet basis (water contents were as high as 35%). Soil washing using only one surfactant The results of the assessments carried out with only one surfactant are depicted on Fig. 1. For all the assessments soil, which passed mesh 10, was employed (with a TPH concentration of 150, 671 mg/kg). As observed, the maximum value for the TPH removal was obtained when washing with Surfacpol LO, a non-ionic surfactant at neutral and alkaline pH (28.3%). This surfactant contains an amine group, so it tends to protonate and behave as a cationic surfactant. For soil washing purposes that behavior is quite undesirable, since cationic surfactants tend to adhere to soils (which have in general a negative charge), so the loss in surfactant due to that phenomenon is very high. In second place, TPH removal value in soil when washing with Maranil Lab (sodium dodecyl benzene sulfate, (SDBS), ofanionicnature) was alsoverygood (26.7%). In the third place is the soil washed with the zwitterionic surfactant Polafix CAPB (21%). Beside these results, two assessment results should be mentioned: using SDS at 0.5% (20.5%) and using the non ionic Brij 35 (17.6 %). When the assessment with SDS was repeated using a surfactant concentration of 1%, a better result of 35.5% was obtained. In other works (Deshpande, et al., 1999), it has been stated that not always an increase in surfactant concentration means an increase in the soil-washing rate; sometimes the result is opposite to that desired. Finally, even when is not shown at the same Figure., the result of washing the soil with seawater previously characterized (Torres, et al., 2005a) was a TPH removal of only 9.15 % and this value will be used in the discussion of the next section results. Soil washing using surfactants mixtures or surfactant salt mixtures Experience has shown us that, when washing soils contaminated with crude oil or fractions using anionic surfactants such as SDS and SDBS, due to the Ca and Mg soil contents, TPH removal values are not as good as they could be, since part of the surfactant is precipitated by the Ca and Mg ions (Torres, et al., 2005b). When using this kind of hard soils, it is very important to measure the value of the ratio (Na+K/ Ca+Mg). If the value ishigher than 1,it is very possible that no adverse effect will be observed when washing the soil with anionic surfactants. in the contrary, If the ratio is quite lower than 1, the effect of this divalent cations will be very important in the soil washing rates. To overcome this difficulty, three different mechanisms have been suggested in the literature (Stellner and Sacamehorn, 1989; Rodriguez, et al., 2001; Torres, et al., 2005a): 1) to add a Na-salt to the surfactant solution (i.e., NaCl), 2) to add phosphates or zeolite powder, to capture Ca and Mg ions and 3) to combine non-ionic + anionic surfactant mixtures. The three options have shown to decrease anionic surfactant precipitation. The three procedures have disadvantages of different origin. The use of NaCl, for example can be very costly and on the other hand, for some type of soils, it could be risky to add NaCl solutions at 1-3 % concentration, since this solutions could cause soil salinitization. In the case of the use of phosphates, costs can be high too. Finally, the use of zeolite powder is more attractive from the technical point of view, but costs related to this technique arequite high. Mixing nonionic+ anionicsurfactants do not present environmental or cost inconveniences in general, but results are not as good as those observed when adding Na or Ca sequestrants to the surfactant solutions (as reported by Torres, et al., 2005b). In this work, as SDS and Maranil Lab (SDBS) surfactants are very popular products, which have low prices and are easy to get, beside the high soil washing rated that showed, it was decided to try both surfactants with the use of the three mechanism to avoid surfactant precipitation and enhance the washing rates. Both surfactants were mixed with NaCl, Na-metasilicate (Na-Si) or a nonionic surfactant trying to get better washing results. The results of these assessments are presented also on Fig. 2. Tests using SDS (0.5%) + NaCl at 1 and 3% concentrations showed an enhancement in the value of the soil washing removal but not very important (increases of 3 and 4% in comparison with SDS alone, respectively). On the other hand, using SDS and Na-Si at 5 and 7%, did increasethe TPH washing removal in 29 and 25%, if compared with the assessment with only SDS. The assessment where SDS was mixed with TW80 was not successful, since the TPH removal obtained was 17.5% lower than the removal, obtained with just SDS, but higher if compared with the assessment using TW80 alone(16.3%). When preparing the SDS solutions with seawater, the TPH removal value was 28% more than that obtained with SDS in tap water, and higher than that obtained with SDS + NaCl at 1 and 3% concentrations. It is important to remember that the assessment employing seawater alone gave TPH removals of only 9.15%. The use of seawater, when washing soils near the sea, could be a very high costeffective technique though it would be very necessary to evaluate the effect of addition of the salts contained in seawater (Na, K, Ca, Mg, chlorides, sulfates, etc) to soils. With respect to the assessments with Maranil Lab (SDBS), it was observed that addition of NaCl 3%, augmented TPH removal in 4.5% more than the assessment without salt. By adding Na-Si (7%), an increase of 20.5% was observed. The assessment were SDBS + SW was used resulted in a TPH removal of 18.7%, lower than that observed using SDBS alone, but very similar to the value obtained when washing with SDS +TW80. Effect of the particle size over the soil washing rates The results of the assessments for different soil fractions Soil from the oil exploration zone in Tabasco, Mexico is highly contaminated with TPH. The characterization carried out after separation of very big particles (even 0.16 m long) and the separation of the remaining soil in fractions corresponding to American meshes from 4 (4.25 mm) to 100 (0.15 mm) showed that TPHs are distributed in the soil fractions with values from 43,590 mg/kg (mesh 80) to 192,130 mg/kg (mesh 4). The trend for TPH distribution was: the higher the particle size, the higher the TPH concentration. The average concentration for the fractions corresponding to mesh 10-100 was of 150, 671 mg/kg. The 16 PAH considered as priority by USEPA were also evaluated in every sample, but none of the points showed presence of the PAH in values under the detection limit for the measurement technique. Regarding the metals content of the soil fractions, it seems that there is no a clear path in the distribution tendency for the five metals in the meshes 6-100. Cu showed its maximum concentration at mesh 40, while Cr was present in the higher concentration at mesh 100. On the other hand, the maximum value for Ni, V and Zn were found at meshes 10 and 80, respectively. Lower metal concentrations were found at mesh 60, with exception of Ni, which was present in the lower concentration at mesh 6. The electrical conductivity was 126 mS/cm. This value corresponds to normal soils with an electrical conductivity in the range of 0-2 dS/m. Regarding the pH values, soil showed values of around 5.6, which indicates that soil is moderately acid (5.1 to 6.5 unities). Finally, soil density resulted in 2.569 g/ cm3, which is a very useful parameter for converting volumes to weights of soil. It was shown that soil could be washed using surfactants or mixtures, with efficiencies up to 28.3% if a single surfactant is employed at a concentration of 0.5% and up to 35.5% if 1% SDS solution is employed. Mixtures anionic surfactant + salt, resulted very interesting, since the presence of NaCl and Na-Si enhanced the soil washing removal of SDS solutions, particularly in the case of Na-Si. Employment of anionic surfactants was, in general, more suitable than using nonionic surfactants, but the use of zwitterionic surfactants showed big potential, which should be studied in detail. Combinations of anionic surfactants SDS and SDBS with NaCl and Na-Si were very interesting, giving higher TPH removals than those obtained only with the surfactants alone. The use of seawater as a Na source resulted quite promissory, always than the effect of the salts contained in seawater over the soil, be evaluated. It was shown that the lower the particle size, the higher the TPH removal value. Besides, the higher the TPH initial concentration, the lower the TPH removal. The combined effect of particle sizeand TPH concentration, determinesthe TPH removal efficiencies. These facts are very important for designing an appropriate soil washing remediation process. ACKNOWLEDGEMENT This work was partially supported by the National Council of Science and Technology Mexico (CONACYT) and the U.S. National Science Foundation (grant NSF-2004-C01-2). M. Climent is grateful to CONACYT for funding her B.Eng. thesis. REFERENCES
© 2007 Center for Environment and Energy Research and Studies (CEERS) The following images related to this document are available:Photo images[st07039t4.jpg] [st07039t1.jpg] [st07039f1.jpg] [st07039t3.jpg] [st07039t2.jpg] [st07039f2.jpg] [st07039f3.jpg] |
| |||||||||
