 |
| About Bioline | All Journals | Testimonials | Membership | News |
|
||||||
|
||||||
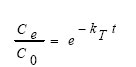
International Journal of Enviornmental Science and Technology, Vol. 4, No. 4, Autumn 2007, pp.481-488 Treatment of polluted river water by a new constructed wetland 1*D. F. Juang; 2P. C. Chen 1Department of Healthcare Administration, Meiho Institute of Technology, 24F, 230, Ming-Chuan Second Road, Kaohsiung 806, Taiwan Received 22 July 2007; revised 5 August 2007; accepted 25 August 2007; available online 1 September 2007 Code Number :st07062 ABSTRACT A new constructed wetland was built to purify one polluted river in Taiwan, and this study was conducted to evaluate the treatment efficiency of the wetland. Due to the very limitation of available budget, several water quality items, which were stipulated by Taiwan’s Environmental Protection Administration for rivers, in the influent and effluent of wetland were analyzed and evaluated. These items included water temperature, pH, DO, BOD5, TSS, and NH4+-N. The results showed that the average removal rates of total (unfiltered) BOD5, TSS and NH4+-N were 36.9 %, 71.8 % and 47.1%, respectively. With the HRT more than 3.4 days, the wetland could treat the polluted river water effectively. Longer HRT in this wetland appeared no obvious improvement on the removal rate of TSS or NH4+-N. However, BOD removal rate increased while the HRT (Hydraulic Retention Time) increased to about 5 days. In this wetland, the calculated mean firstorder reaction rate constant (kT) for BOD5 was 0.15/day with a standard deviation of 0.13/day and for NH4+-N was 0.24/ day with a standard deviation of 0.18/day. It is also concluded that there is a linear proportional relationship between BOD concentrations in the effluent of wetland and its influent mass loading rates, with the coefficient of determination (R2) of 0.6511. Similar result was seen for NH4+-N as well, with the coefficient of determination (R2) of 0.5965. TSS removal rate was found to be linearly proportional to its influent mass loading rate, with the coefficient of determination (R2) of 0.4875. Key words: Constructed wetland, ecological treatment, loading rate, macrophytes, polluted river, river water purification INTRODUCTIONConstructed wetlands can serve as wastewater treatment systems and always consist of shallow ponds or channels planted with aquatic macrophytes. They can treat a variety of wastewaters by the microbial, biological, physical and chemical processes (Hamilton, et al., 1997; Reed, 2000; USEPA, 2000a; García, et al., 2004; Voeks and Rahmatian, 2004). Kovacic, et al., (2006) applied two wetlands to effectively reduce agricultural non-point source pollution, such as nitrogen, before it entered a lake. One of the wetlands, with average retention time between 10 and 14 days and average total N loading between 38.8 and 61.6 kg/year, indicated the average total N removal rate of 23 to 42 %. Both organic and nitrate nitrogen appeared higher removal rates in this wetland. However, it was found that the average removal rates of ammonium nitrogen were negative. Similar results were found in another wetland with average retention time between 6.5 and 8 days and average total N loading between 294.3 and 358.5 kg/year. Also, a similar result of effective nutrient removal from a lake by two wetland cells was also found by Coveney et al., (2002) Although many researchers have recently studied a variety of pollution sources in river water or in the plants of aquatic ecosystems (Alam, et al., 2007). Green, et al., (1996) used pilot-scale constructed wetlands to treat the secondary effluent from a sewage treatment plant for river reclamation. The results of their study showed that the removal of BOD and SS was very efficient with the hydraulic retention time of 4 to 15 days and BOD loading of 1 to 5.5 kg/0.1 ha/ day (= 1 to 5.5 g/m2/day) The monthly average BOD removal rate was higher than 70 %, and the monthly average SS removal rate was higher than 85 %. However, they also found that the removal efficiency of the nitrogen and phosphorus compounds varied within a very wide range from 95 % to 0 %. Jing, et al., (2001) reported that constructed wetlands could effectively remove the BOD, suspended solids and nutrients from highly polluted river water. Sakadevan and Bavor (1999) also concluded that the treatment efficiency of pollutants in a constructed wetland could be improved by decreasing the hydraulic loading or by increasing the hydraulic retention time. The first order reaction equation used to express the removal of BOD5 and NH4+-N was shown as follows.
where C0 (mg/L) and Ce(mg/L) are the pollutant concentrations in the influent and effluent, respectively. kT (day-1) is the first order reaction rate constant of pollutant and t (day) is the hydraulic retention time. This equation can also be expressed as the following one:
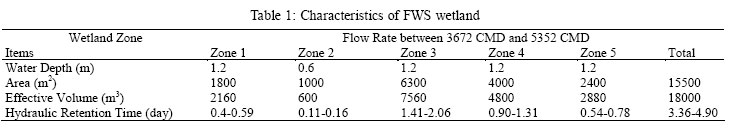
Jing et al., (2002) obtained the first-order reaction rate constant (kT)of BOD inafree water surface (FWS) wetland was between 0.38 day-1and 0.55/day, and that of NH4+-N was between 0.88 day-1 and 2.28/day. However, the artificial wastewater and the small-scale constructed wetlands were used in their study. Due to the river water quality in Taiwan becoming much worse in recent years, Taiwan’s Environmental Protection Administration (TWEPA) hasbeen actively propagating thenatural and ecological treatment techniquesfor the purificationof river water. Therefore, constructed wetlands have been considered as one of the techniques for the treatment of river water. In this study, we selected a large-scale new constructed FWS wetland which was built to treat the polluted water of Ho-Bou-Yu Drainage. This drainage was located in the south of Taiwan and received the runoff from swine farms or henneries and the domestic wastewater from several houses nearby. According to the water qualitydata of Ho-Bou-Yu Drainagefrom 2001 to 2004 provided byTWEPA, the monthlyaverage BOD5 wasbetween5.7 mg/Land 33.5 mg/L, themonthly average SS wasbetween 10.7 mg/L and 67 mg/L, and the monthly average NH4+-N was between3.93 mg/Land 20.8mg/L.In this research work, we evaluated the treatment efficiency of thewetland by analyzing the waterquality of the influent and effluent almost every month. Since this constructed wetland could be claimed as one of the first large-scale wetland for the treatment of river water in Taiwan, many operational data and control criteria needed to be established. However, the constructed wetlands always required a long time toreacha stable operationalcondition. Therefore, it is expected that the results obtained in this study could providethe operators with basiccontrolcriteria. MATERIALS AND METHODSDescription of the FWS wetland The water in Ho-Bou-Yu Drainage was pumped to the new constructed wetland with the total effective treatment area of 1.55 ha (= 15,500 m2). The wetland was separated into five zones in series and its monthly average influent flow rate was operated between 3672 CMD (cubic meter per day;m3/day) and 5352CMD.The water depth,thearea, the effective volume,and thehydraulic retentiontime (HRT) of each zone were described in Table 1. In the first zone, emergent and near shore macrophytes were planted and their covering rate to water surface area was about 70 %. Free-floating, emergent, andnear shore macrophyteswere planted in the second zone with their covering rate to water surface area of near 90 %. In both zone 3 and zone 4, all kinds of free floating, emergent, submerged and near shore macrophytes were planted. The covering rate of aquatic plants in zone 3 was about 20 %, and that was approximately 10% in zone 4. In the fifth zone, emergent and near shore macrophytes were planted, and their covering rate to the water surface area was always less than 5 %. All these aquatic plants in this wetland were popularlyfoundin local. Thefree floating macrophytes included Nelumbo nucifera and Ludwigia adscendens, and the emergent macrophytes included Phragmites communis (Reed), Bacopa monnieri, Scripus maritimus, Cyperus alterniflius (Umbrella Plant), Typha orientalis (Cattail), and Ludwigia x taiwanensis Peng. The submerged macrophytes were Ceratophyllum demersum and Egeria densa planch., and the near shore macrophytes were Hedychium coronarium koenig and Cyclosorus interruptus. After the treatment of wetland, the treated water was then discharged to the downstream of drainage by gravity. Analyses of water samples After the wetland was constructed and stabilized for several months, the influent and effluent water samples were collectedand analyzedduring a ten-month period of time. Due to the limitation of financial budget, only the influent and effluent grab samples of the wetland were collectedalmosttwice permonth. The influentgrab samples weretaken at the outletofthe pumping pipe(influent pipe of the wetland), and the effluent grab samples were taken at the outlet of the discharged pipe of the wetland. Water samples were measured for water temperature, pH, dissolved oxygen (DO), BOD5, total suspended solids (TSS), and NH4+-N, following the methods mentioned in Standard Methods (Clesceri et al., 2001). Data analyses The removal efficiencies ( r , %) of pollutants were calculated as:
The surface loading rate (Si, m3/m2/day) and the mass loading rate (Mi, g/m2/day) were expressed as:
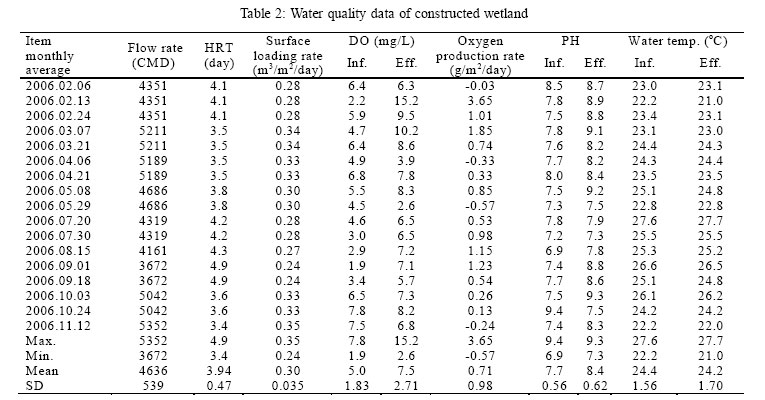
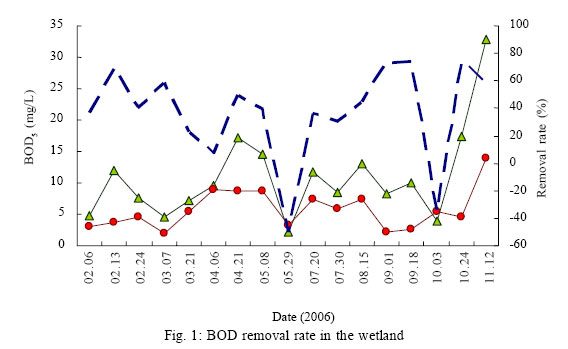
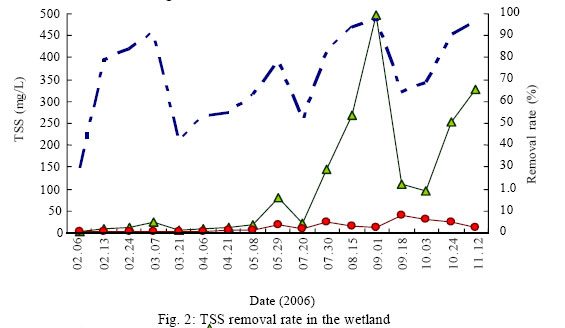
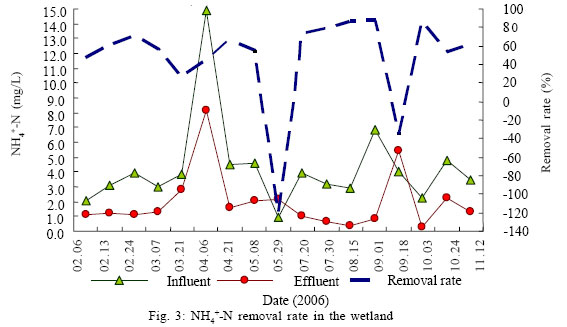
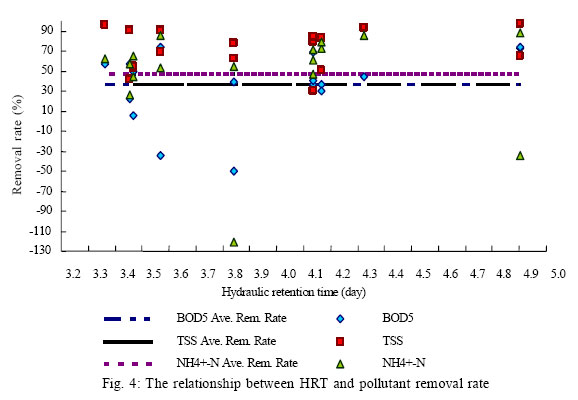
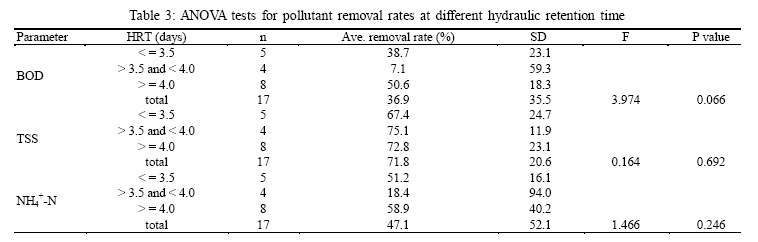
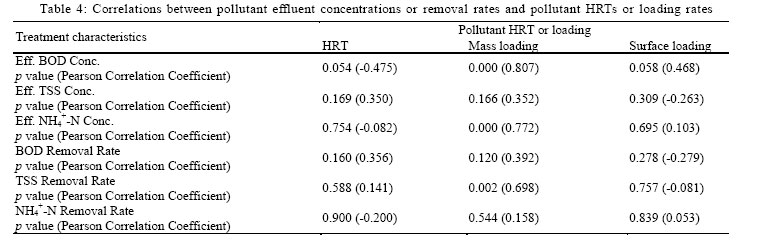
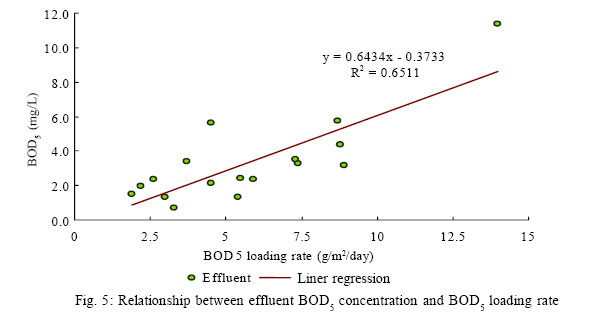
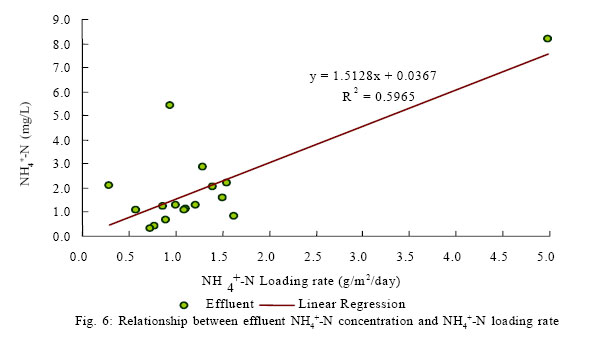
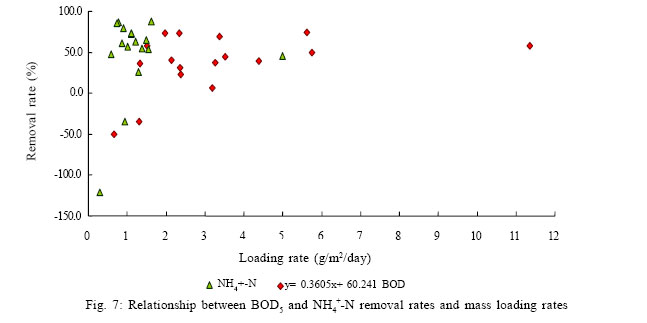
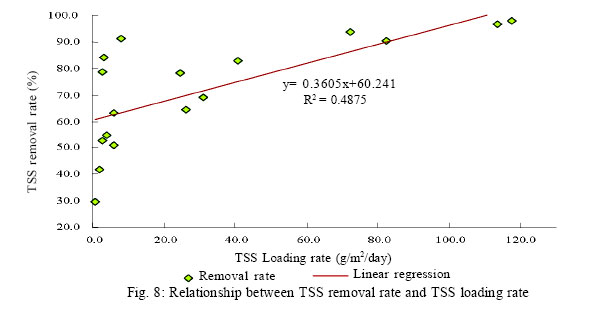
where Qi (m3/day) is the influent flow rate and A (m2) is total surface area of wetland. In this study, all statistical analyses of the data were completed by using Excel or SPSS software (Jing et al., 2002; García et al., 2004;Wiessner et al., 2005), and the significance level of 0.05 was used in the ANOVA (Analysis of variance), the correlation, and the linear regression tests. RESULTSThe water quality data of constructed wetland were shown in Table 2. During the research period, the water temperature ranged in the influent and between in the effluent. The results showed that water temperature in the influent (between 22.2oC and 27.6 oC) and in the effluent (21.0oC and 27.7oC) had no obvious difference during the whole research period. Apparently, warm winter is quite obvious in the south of Taiwan. Both dissolved oxygen (DO) and pH increased after treatment. The increaseof DO concentration in theeffluentwas probably due to the photosynthesis of vegetation or the surface aeration inopen water zones (USEPA, 2000b). Itis presumed that the increase of pH might be due to the denitrification occurring in the sediments of wetland. However, more research work is required for better understanding of this characteristic. The oxygen production rates of this wetland were between -0.57 and 3.65g/m2/day with a meanof 0.71g/m2/day and a standard deviation (SD) of 0.98 g/m2/day. The surface loading rates of this wetland were between 0.24 and 0.35 m3/m2/day and with a mean of 0.3 m3/m2/day and a SD of 0.03 m3/m2/day. Pollutant removal in the wetland The removal rates of BOD5, TSS and NH4+-N in this wetland were illustrated in Figs. 1, 2, 3, respectively. During the research period, the wetland received the river water with total average concentrations of 12.4 mg/L, 111.4 mg/L and 4.2 mg/Lfor BOD5,SS and NH4+-N, respectively. Since the water temperature was quite stable during the whole research period, its effects on the removal rates of BOD5 or NH4+-N could be neglected. However, the most efficient BOD5 and NH4+-N removal occurred in September (see Figs. 1 and 3). Fig. 4 showed the relationship between hydraulic retention time (HRT) and pollutant removal rate of wetland. Apparently, the wetland has displayed its effective treatment on the pollutants in river water while the HRT is more than 3.4 days. According to Figs. 4, BOD removal rate improved more obviously at higher HRT such as 4.9 days in this study, but no obvious difference on the removal rates for both TSS and NH4+-N was seen at the HRT from 3.4 days to about 5 days. However, the ANOVA test results in Table 3 showed that there were no significant differences (p > 0.05) on the removal rates of BOD5, TSS and NH4+-N with the HRT less than 3.5 days, between 3.5 days and 4.0 days, and higher than 4.0 days. During the research period, the average removal rates of total (unfiltered) BOD5, TSS and NH4+-N were 36.9 %, 71.8 % and 47.1%, respectively. Pollutant loading rates of the wetland The correlations between the effluent concentrations ortheremoval rates of pollutants and the HRT ortheloading rates of wetland system were shown in Table 4. Apparently, BOD effluent concentration and its mass loading rate had a significant correlation (p = 0.000) in this wetland. Similar result was seen between NH4+-N effluent concentration and its mass loading rate with the p value less than 0.05. A significant correlation was also seen between TSS removal rate and its mass loading rate (p = 0.002). Figs. 5 - 6 expressed the relationships between the effluent concentration and the loading rate of BOD5 and NH4+-N, respectively. The total average BOD5 and NH4+-N loading rate were 3.32 and 1.29 g/m2/day, respectively. These loading rates were in the reasonable range mentioned by USEPA (2000a), which were 0.23 – 18.3 g/m2/day for BOD5 loading rate and 0.03 - 1.6 g/m2/day for NH4+-N loading rate. Figs. 5 also showed the results of linear regression between BOD5 concentration in the effluent and BOD5 loading rate, and this relationship was expressed as follows with the coefficient of determination (R2) of 0.6511: CeB = 0.6434 × MiB − 0.3733 (6) where CeB is BOD5 concentration (mg/L) intheeffluent of wetland and MiB is the BOD loading rate (g/m2/day). Fig. 6 also showed the results of linear regression between NH4+-N concentration in the effluent and NH4+-N loading rate, and this relationship was expressed as follows with the coefficient of determination (R2 ) of 0.5965: CeN = 1.5128 × MiN − 0.0367 (7) where CeB isNH4+-N concentration (mg/L)in the effluent of wetlandand MiM isthe NH4+-N loadingrate (g/m2/day). Fig. 7 illustrated the relationship between loading rate and removal rate of BOD5 and NH4+-N. It seems that the effect of BOD loading rates on the removal rates of BOD5 was not obvious with the hydraulic retention time in the rage of 3.4 to 4.9 days. However, NH4+-N removal rates might be higher at lower loading rates. Fig. 8 showed the results of linear regression between TSS loading rate and its removal rate, and this relationship was expressed as follows withthe coefficient of determination(R2) of 0.4875: RRSS = 0.3605 × Mis + 60.241 (8) where RRSS is the TSS removal rate (%) of wetland and MiS is the TSS loading rate (g/m2/day). DISCUSSION AND CONCLUSIONThe results of this study showed that the constructed wetland can be applied to purify the polluted river water although the covering rate of macrophytes to the water surface area was not high. The oxygen production rates of constructed wetlands were in the range of 0 to 28.6 g/m2/day, whereas rates of 0 to 3 g/m2/day were mostly found (Kadlec and Knight, 1996). Since the oxygen production rates of this wetland werebetween -0.57 and 3.65 g/m2/day and with a mean of 0.71 g/m2/day, these values seemed to be reasonable. The surface loading rates of this wetland were between 0.24 and 0.35 m3/m2/day and with a mean of 0.3 m3/m2/day.They were also in the rangeof0.01to 0.5 m3/m2/ daytypically applied to the FWSwetlands (USEPA,2000b). Inthisstudy, the average removal ratesoftotal (unfiltered) BOD5, TSS and NH4+-Nwere 36.9%, 71.8 % and 47.1 %, respectively. Since lower HRT was applied in this study, these pollutant removal rates were somewhat lower than those reportedby Green et al., (1996). Basically,thewetland has displayed an effective treatment of pollutants in this drainage with the HRT more than 3.4 days,andno obvious difference ofBOD, TSS, orNH4+-Nremoval rate was seen for longer HRT up to about 5 days. This study also found that the BODandNH4+-N concentrationsinthe effluentof wetland will be linearlyproportional to their influent mass loading rate.NH4+-N removal rate was higher atlower mass loading rate, and the removal rate of TSS was linearly proportional totheir influentmass loading rate. According to the equation (1) or (2), the calculated mean first order reaction rate constant (kT) for BOD5 was 0.15/day with a standard deviation of 0.13/day and for NH4+-N was 0.24/ daywith astandard deviationof 0.18/day.Theseconstants were somewhat lower than those reported by Jing, et al., (2002). Sincethe artificialwastewater and the small-scale constructed wetlands wereused in their study, it is possible that the pollutants in the river water of this study could be more difficult to be degraded by microbes than those in artificial wastewater. Basically,this constructedwetlandhas still shown acceptable results on the purification of river water. The equations developed in this study will provide the operators with basic control criteria of this wetland. REFERENCES
© 2007 Center for Environment and Energy Research and Studies (CEERS) The following images related to this document are available:Photo images[st07062t1.jpg] [st07062f7.jpg] [st07062t4.jpg] [st07062f6.jpg] [st07062t2.jpg] [st07062f1.jpg] [st07062f4.jpg] [st07062f5.jpg] [st07062t3.jpg] [st07062f3.jpg] [st07062f2.jpg] [st07062f8.jpg] |
| |||||||||

