 |
| About Bioline | All Journals | Testimonials | Membership | News |
|
||||||
|
||||||
International Journal of Enviornmental Science and Technology, Vol. 4, No. 4, Autumn 2007, pp.505-512 A study of feasibility for water purification using vertical porous concrete filter ¹*M. M. Taghizadeh; ²A. Torabian; 1M. Borghei; ¹A. H. Hassani ¹ Department of Environmental Engineering, Graduate School of the Environment and Energy, Islamic Azad University Science and Research Campus, Tehran, Iran *Corresponding Author Email: tgmehdi@yahoo.com Tel.: +98 917 313 5359 Fax: +98 0711 830 1414 Received 5 June 2007; revised 8 July 2007; accepted 16 August 2007; available online 1 September 2007 Code Number :st07065 ABSTRACT There is a need to find cheaper and simpler techniques for rural water filtration system in developing countries. Using a filter made of blocks for the water treatment enables one to make vertical filters. It is expected that the amount of land utilized would decrease by more than 70 % if vertical filters were used. The operation and washing would be simpler than using horizontal sand filters as filters made of blocks would be used instead. The feasibility study focused on finding adequate materials, compositions and methods of making a block with enough resistance to water pressure, sufficient porosity for water transformation, and using inexpensive, readily available materials. A pilot study was used to determine an appropriate thickness. Testing the porous filter in another pilot study using the low overflow rate of river water showed biological growth in that media and an adequate efficiency of about 90-100 % was obtained for decreasing the coliform bacteria. Washing in this filter is possible. The amount of water necessary for backwashing is 2.9 % of total amount of water, which is passed. Key words: Slow sand filter, block filter, coliform bacteria, turbidity, porous concrete INTRODUCTIONFiltration is a process for screening water and sewage, which is widely used to eliminate sewage particles from water. In this process, water flows through filter materials, and particles accumulate on the surface or pile up in the depth of the filter. Sand with a diameter range of 0.1-10 mm is most frequently used. Filtration is also the last phase in the treatment to eliminate particles from the water. Most pollutants, such as viruses and heavy metals may occur with particles. Heavy metals accumulate in some fauna and flora, so the elimination of the particles improves the quality of the water. (Karbassi, et al., 2006) Sand filters were proved to be beneficial for the prevention of water-borne diseases in 1892 (Baker, 1949). Using a slow filter was the first modern technique for the purification of surface water. It can eliminate up to 99.9 % of the water bacteria. It has also been used to prevent gastrointestinal diseases for the last 150 years Slow sand filtration has several limitations, the most important being the need for a vast amount of land, as well as a great amount of filter materials. The overall function of the horizontal flow roughing filter in removing turbidity and TSS is acceptable. (Jafari, et al., 2007), It is necessary to meet the above-mentioned needs in order to conduct some research on a new filter that has the same capability as the slow sand filter. It is supposed that by using attached sand to form a block; one can make a vertical form of the slow filter bed, in order to use much less land. The matter attaching the sands may be a type of porous concrete. A porous concrete is a mixture of Portland cement, water and fine aggregate that provides suitable infiltration. Porous concrete, the so-called sponge concrete, is widely used to cover pavements in order to prevent the collection and adsorption of water (Richard, et al., 1982). Some researchers have used porous concrete as a contact media to culture bacteria (Yasunary, et al., 2006; Branson, et al., 2003). Wolfgang has reported that various living species, such as microorganisms including protozoa stick to the porous concrete and grow (Wolfgang, 1998). This fact confirms the potentiality for growth in the biological layer in these filters, as in the slow sand filters. Hence, it seems that one may be able to utilize the greatest advantage of the slow filter, its ability to eliminate infectious bacteria. The goal of this research is to study the capability of porous concrete as a vertical filter for water screening, in comparison with the slowfilter. MATERIALS AND METHODSManufacture of porous concrete 130 types of concrete blocks were manufactured using various compounds of cement, water and sand in different sizes as follows:
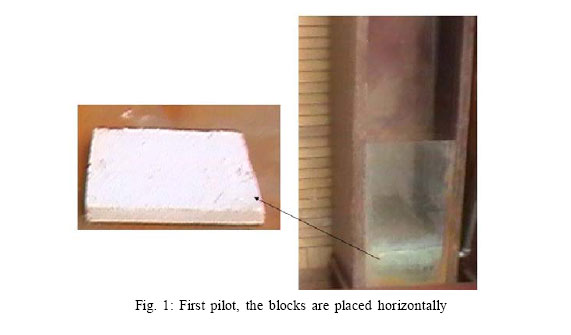
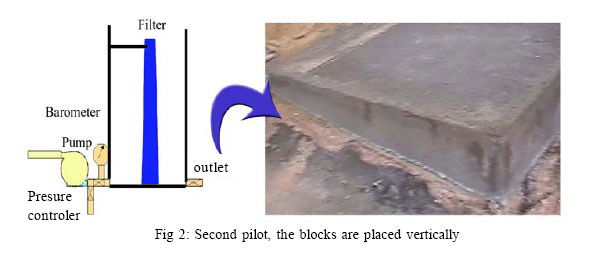
The porous concretes were in cylindrical shapes and their diameter and height were 25cm and 2.5cm, respectively. Physical characteristics of the porous concretes The physical characteristics of the porous concretes were investigated, in particular, their compressive strength and permeability coefficient. Investigation into adequate thickness The appropriate thickness was studied in a separate pilot study by constructing block samples with dimensions of2.5×31×31 cm3 in which the blocks were placed horizontally (Fig. 1). By examining the water flow rate from the block, an acceptable thickness for the selected block was established. Pilot study on purification of water A block with width and length of 98 cm and 130cm shaped like a trapezoid, with a thickness of 5-12cm was devised and was used in the second pilot study (Fig. 2). Startup At the start up, the velocity of the outflow from the pilot was fixed at about 0.25 m/h in order to establish the growth of the biological mass on the filter. The water elevation at the inlet was fixed at 110 cm. This was done by setting a spillway at this height. The outflow velocity was controlled by a valve. The water rose as the velocity decreased. The difference in the height of the water between the two parts at each time was the pressure head loss caused by the filter, which was measured daily. The temperature at the site of the experiment varied in the range 43-49 ºC Investigation into the treatment of the bacteria Since there are nearly 300 coliform in 100 mL of raw water, after the pretreatment phases, this amount reached 85-140 in 100 mL. These experiments were done daily using multiple-tube techniques according to the standard method. It was not be a suitable standard by which to estimatethe capability ofthe filter to eliminate the fecal coliforms because the number of fecal coliforms declined drastically after passing the pretreatment units, and sometimes reached zero. On the other hand, the growth of the useful bacteria in the filter would not permit a count of the total bacteria to be the yardstick. Investigation of the turbidity treatment The pilot started to operate at the water treatment plant at Karoon River. This river flows in south east of Iran. Because of the high turbidity, the inflowing water passed through a pressured, rapid sand filter and an 80cm layer with a grading like that of the slow sand filter. Therefore, the inflowing turbidity at thefilter was at most 15 NTU. Furthermore, the outlet flow turbidity was examined daily. Washing period testing The inflow and outflow were controlled. When the head loss reached a maximum value, the effects of the increased head loss made the outflow velocity decrease, and along with this decline, the washing phase began. Approaching the zero velocity was prevented, since a total jam in the filter might make the washing process impossible. Investigation into the washing method The washing was carried out under pressure by a pump and a pressure control faucet. Fig. 2 shows the schematic of the washing process. An appropriate pressure for washing was obtained by trying different pressures and studying the results. Sufficient time for washing was calculated so that the turbidity of the out flowing water would be equal to that of the inflowing water. The filter was washed several times and restarted, but after two start-ups the functioning of the filter at higher velocities (0.35 m/h and 0.4 m/h) and turbidities (25 NTU) was checked. RESULTS Physical characteristics Table 1 shows the best physical characteristics that were obtained from the examination of 130 types of block samples. Results show that the porous concrete made from high alumina cement with characteristic of No. 5 has the best compressive strength and permeability coefficient. Table 1 shows that the No. 5 is the best mixture of aggregate. Its effective size and uniformity coefficient were determined as 0.35 and 2.5, respectively.. Table 1: Physical characteristics of the best samples
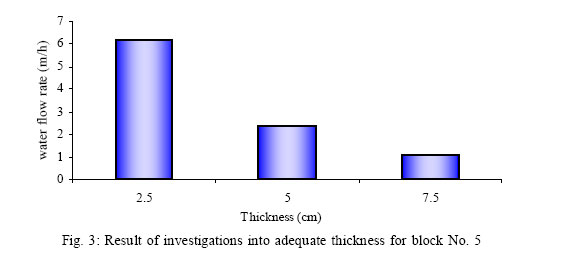
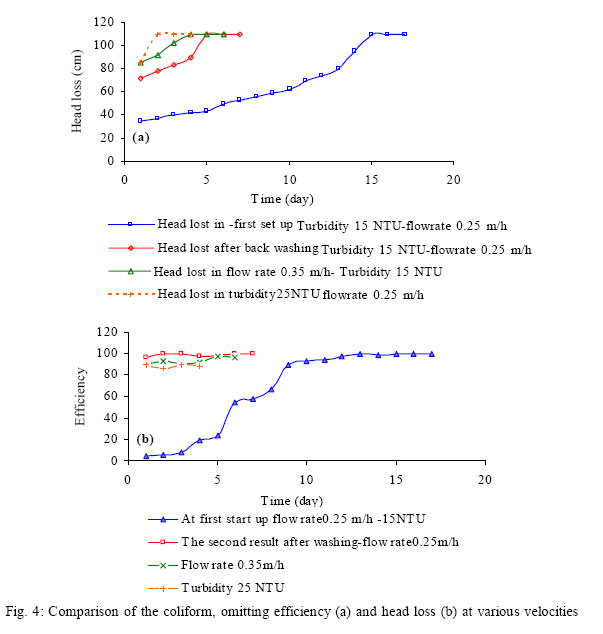
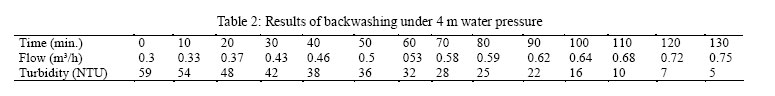
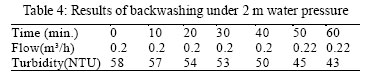
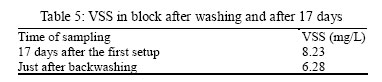
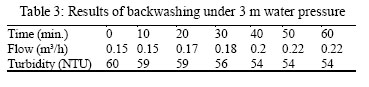
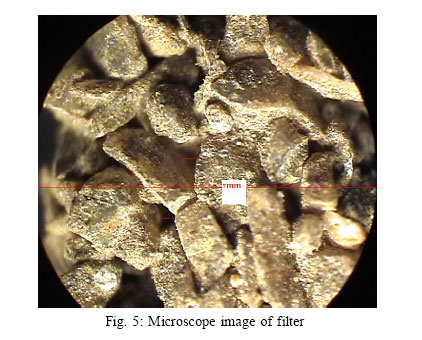
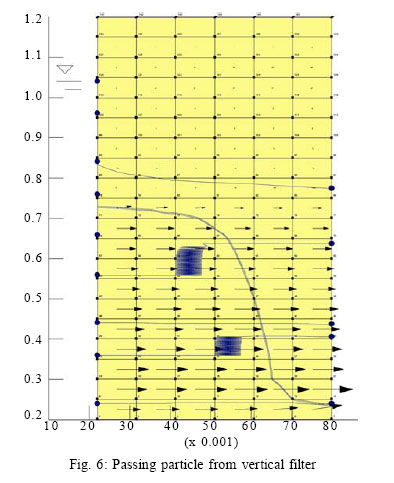
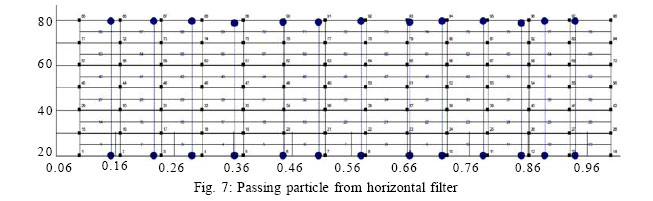
Investigation into the adequate thickness Fig. 3 shows the result of the investigation into an adequate thickness for block No. 5. As the results show, the velocity of the water passing through a thickness of 5-7.5 cm will be optimal. Increasing the thickness to more than 7.5 cm makes the velocity too low to influence the water, and at smaller thicknesses, the ability of the filter to trap matter will be very low. The pilot investigation represents various thicknesses in water heads from 0 to 110 cm. The final result of these investigations shows that the trapezoidal filter with top and bottom thickness of 5 and 12.5 cm, respectively, is the best alternative. Pilot study for purification of water In this experiment, the speed was set at about 0.25 m/h, equal to that of the water flow through the slow sand filter, in order to allow the biological mass to grow. The curve in Fig. 4 illustrates the changes in the efficiency of the bacteria elimination relative to time. The diagram shows that, the efficiency is low at the outset. It gradually increases logarithmically. Fig. 4 also compares the efficiency of the elimination in different phases of operation. The pressure declines in the second phase reaching its maximum for 6–7 days between the two washes. After stabilizing the biological mass, the function of the filter at the higher velocities was examined. Fig. 4 shows the results at 0.35 m/h. Along with the velocity, the head loss increases, and the number of days for productivity decreased to four- days at this velocity. In subsequent days this velocity tended to 0.25-0.1 m/h. In the next experiment, atthe maximumhead loss, velocity and the outlet efficiency were studied. In this case, the maximum flow rate was 0.43m/h which gradually decreased in the subsequent days. Efficiency changes are seen in Fig. 4. It also shows the function of the filter when the turbidity is 25 NTU. An apparent decline in the efficiency is a sign of the inadequacy of the filter at high turbidities. At this turbidity we have a rapid up growth of head loss and a considerable decline in the velocity at the outlet. Washing method The goal is to open the pores of the filter, which have been jammed by the particles which have stuck. The particles that cause turbidity would be trapped deep inside the biological layer. To separate these materials enough, force must be used to exert an influence in the depth of the filter. Usually, the washing in rapid sand filters which should be cleaned by backwashing, is practicable with a high pressure of water for the friction between the sands to achieve a perfect cleaning. But 100 % cleaning of the porous concretes is impossible. Furthermore, it is not desirable, because the presence of bacteria is needed. The washing in this filter is possible if the water pressure in the opposite direction is increased to be more than that when operating normally. A pressure greater than 6.5m breaks the filter. Hence, a test to determine a suitable water pressure of 4 m on the opposite direction was done by a pump, a pressure regulating valve, and a barometer to measure the flow and the outlet turbidity at different times until it reached 5 NTU. Fig. 2 shows the backwashing system. The washing was done by the reserved water with a turbidity less than 1 NTU. The results can be seen in Table 2. As the filter becomes cleaner, the velocity of the water in backwashing system increases. So, the filter would be clean in 130 min, under 4 m pressure of water. Table 4 and 5 show the results for 2m and 3m pressure. In the best design, the amount of water necessary for backwashing in the rapid sand filter is 3% of the total of the filtered water (Kawmura, 1999). The volume of water is 1.13 m3 per 38.4 m3 of screened water, i.e. 2.9 %, of the total amount of water which is passed. Filtration mechanism The porosity of the filter was found to be 40 % and the diameter of the pores was found to be about 0.1 mm, using a microscope with the source of light set above it. Fig. 5 shows part of the filter in the microscope image. Evidently, this filter could not eliminate the coliforms and particles that cause turbidity in conformity with thestraining mechanism. Thestraining mechanism is not an important issue when the ratio (diameter of particles/dimensions of media) is greater than 0.2 in the porous environment, whereas if the average diameter is measured in microns, this ratio would grow a hundredfold because of the diameter of fine aggregate, which is 350 µm. (Boller, 1980) and (Herzig, 1970). Screening in the porous environment is the predominant mechanism for the elimination of particles with an approximate diameter greater than 100 µm, while smaller particles in the filter are not eliminated (Thien, 1976), (Maroudas and Eisenklam, 1965). On the other hand, particles with diameters in the range 0.00110 µm cause the turbidity (Roberts, 1975). The bacteria also have dimensions in the range 0.2-8 µm. Hence another mechanism must be sought for their elimination. In slow sand filters, the biological layer plays the key role in the elimination of bacteria and turbidity on the surface of the filter. At high speeds of water flow through the filter, the biological mass has no chance to grow in the filter, and would be washed out with the stream. To be assured of the biological mass growth, a sample with dimensions of 10×2020 mm was carved from the upper part of the filter. It was dried at 105 ºC and weighed. The difference in its weight at 505 ºC was then determined in order to measure the weight of organic materials. This difference in weight was assumed to be related to VSS, which pertains to the biological mass. The experiment was repeated after thefilterwashing.The resultsaregiven in Table 5.CTRN/ W is a finite element software that can be used to model the movement of particle through porous materials. Fig. 6 and 7 show the result of passing particle from twosame horizontal and vertical positions. As these Figures show in vertical position the particle direction is longer than horizontal one (blue line shows the particle direction). it can be a reason for small thickness of these filters. DISCUSSION AND CONCLUSIONS These studies show, that slow horizontal filtration is feasible with the blocks which are made of the porous concrete, and thanks to the growth of the biological mass are efficient at eliminating bacteria. There is a restriction on the increase in the inlet turbidity as in the slow filter. Increase in the speed of filtration, cause reduction of the time of exploitation. Cleaning this filter is practicable, under 4 m water pressure for 130 min., consuming only 2.9 % of the water that was used. The land needed for the two filters with vertical area 2.6 m² and height of 130 cm is 0.8 m². In fact 70 % less land is needed than was required for the slow filters. Thanks to the average thickness of this filter (9 cm) and the use of simple materials, we have a 90 % saving in the total material needed compared to the slow filters. More economy is contributed by the price of cement and sand in the region. Back washing in the filter reduces the labor costs. Given the simplicity of the operation and the inexpensive material, this filter is acceptable for water treatment in small communities or villages. ACKNOWLEDGMENTThe authors would like to express their sincere thank to Pourab Company for accepting a part of the financial support affiliation for this research. REFERENCES
© 2007 Center for Environment and Energy Research and Studies (CEERS) The following images related to this document are available:Photo images[st07065t4.jpg] [st07065f3.jpg] [st07065t3.jpg] [st07065f5.jpg] [st07065t2.jpg] [st07065t5.jpg] [st07065f2.jpg] [st07065f1.jpg] [st07065f4.jpg] [st07065f7.jpg] [st07065f6.jpg] |
| |||||||||
