 |
| About Bioline | All Journals | Testimonials | Membership | News |
|
||||||
|
||||||
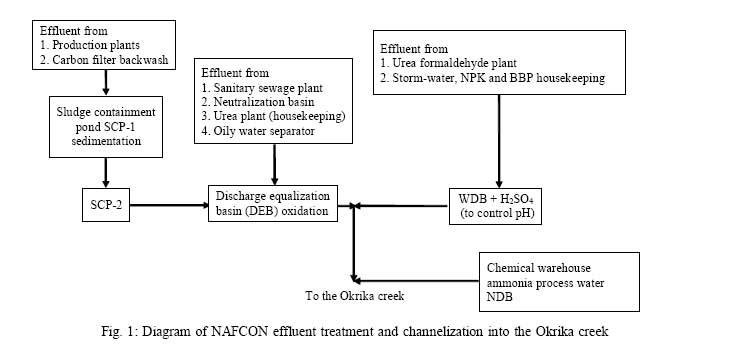
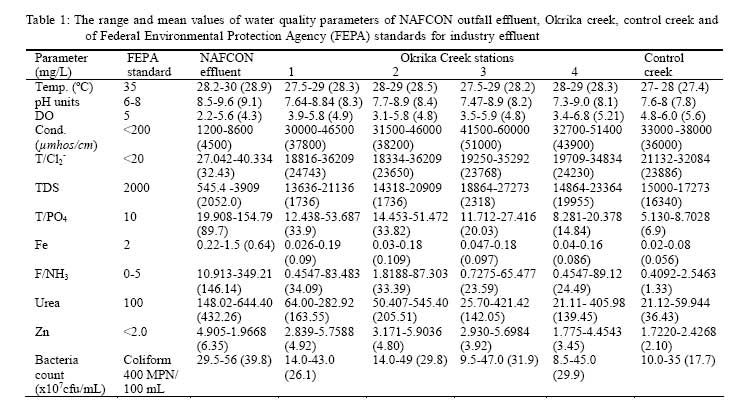
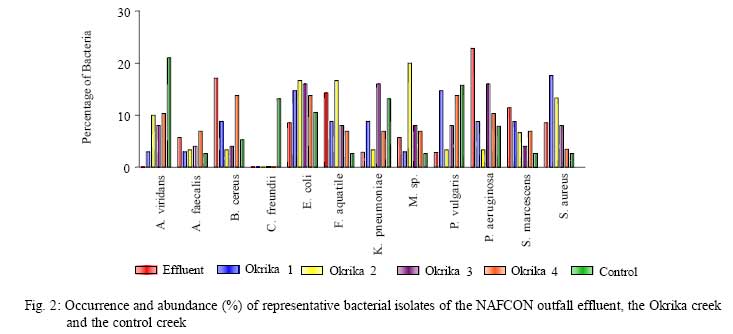
International Journal of Enviornmental Science and Technology, Vol. 5, No. 1, Winter 2008, pp.107-118 Impact of fertilizer plant effluent on water quality 1O. Obire; 1A. Ogan; 2*R. N. Okigbo 1 Department of Applied and Environmental Biology, Rivers State University of Science and Technology, P.M.B. 5080, Port Harcourt, Nigeria| Received 6 October 2007; revised 4 November 2007; accepted 30 November 2007; available online 26 December 2007 Code Number: st08013 ABSTRACT: The impact of National Fertilizer Company of Nigeria outfall effluent on the physicochemistry and bacteriology of Okrika creek was investigated during the sampling period from May to December, 1998. The National Fertilizer Company of Nigeria outfall effluent, the Okrika creek water and the Ikpukulubie creek (control) water samples were collected. The physico-chemical parameters analyzed for all the samples included temperature, pH, total chloride, total dissolved solids, dissolved oxygen, conductivity, free ammonia, total phosphate, urea, zinc and iron, while the bacteriological determinations were total culturable aerobic heterotrophic bacteria count and identification of representative isolates. The Okrika creek recorded higher concentrations for all the physico-chemical parameters and bacteria load than the control creek. The higher values of pH, Free NH3, urea, TDS and the conductivity of the National Fertilizer Company of Nigeria outfall effluent above the FEPA standards reflect the poor effluent quality generated by National Fertilizer Company of Nigeria. The bacteria species isolated from the samples include Aerococcus viridans, Alcaligenes faecalis, Bacillus cereus, Citrobacter freundii, Escherichia coli, Klebsiella pneumoniae, Proteus vulgaris, Pseudomonas aeruginosa, Serratia marcescens and Staphylococcus aureus. In general, the investigation revealed that there was an extremely adverse impact on the physico-chemical and bacteriological water quality characteristics of the Okrika creek as a result of the discharge of poor quality effluent from National Fertilizer Company of Nigeria operations. Key words: Fertilizer, outfall effluent, physiochemical, bacteriological parameters INTRODUCTION The impact of industrial toxics and hazardous wastes on aquatic life including microorganisms cannot be over-stressed. Consequently, upon the industrial revolution, many production and manufacturing companies have due to improper waste management techniques, added toxic and hazardous wastes including synthetic compounds into the aquatic environment. These wastes are also discharged into water without any treatment as a result of improper or deliberate channeling of the wastes into aquatic environment. The presence of these wastes in the environment causes extensive damage to the water quality characteristics and the ecology of the environment, especially when microbial degradation activities fail to remove these pollutants fast enough to prevent environmental degradation (ZoBell, 1963; Nelson-Smith, 1973; Obire and Okudo, 1997). The environmental consequences of marine pollution include creating a harsh marine environment which adversely affects activities of marine micro-flora as well as fish and other marine lives (Nelson-Smith, 1973; UNEP,1993; Obireand Okudo, 1997;Obireand Amusan, 2003). The National Fertilizer Company of Nigeria (NAFCON) limited, sited at Onne near Port Harcourt, is the largest nitrogenous fertilizer company in Nigeria and is sited along the banks of the Okrika creek. NAFCON started production in 1987 and has a capacity of producing over 700,000 t of combined (NH2)2CO, N, P, K (NPK) and bulk blended fertilizers per annum (NAFCON, 1990). Other products are also a variety of grades of nitrogen-based fertilizers produced to suit various soil conditions (Oliver, 1997). The NAFCON effluents include domestic and sanitary sewage, ammonia and urea plant condensate, stream condensate, contaminated run-off, storm water and utility waste waters (boiler blow down, cooling tower blow-down and demineralized regenerantwaste). These effluents contain essentially toxic components such as free ammonia, numerous ammonium compounds, phosphate compounds, urea, heavy metals from chemicals used in stabilizing production processes, oil, grease and fuel from machinery (Kiff, 1987;Wai-Ogosu, 1992). NAFCON is estimated to generate approximately 50% of the total nitrogen and virtually the total phosphorous from industrial sources of pollution in Port Harcourt (Moffat and Linden, 1995). Some of the NAFCON plant effluents are conveyed directly into discharge equalization basins (DEB) through separate waste stream channels for treatment before discharge into the Okrika creek (UNEP, 1993; Wai-Ogosu, 1992). The sludge formed in these treatment basins are cleared up and dumped in a pit or site close to the effluent outfall. Sludge discharge raises the carbon-nitrogen ratio of the environment and causes loss of carbon as carbon dioxide and affects the physico-chemical parameters of the marine milieu (ASTM, 1986). Other effluent sources such as processed water from ammonia plant, spills from chemical warehouse, contaminated surface drains as well as housekeeping and contaminated run-off from NPK and bulk blending plants are not channeled into the discharge equalization basins. These are discharged directly into the Okrika creek through the outfall with little dilution from an adjacent bore hole. Before the wastewater is discharged from the treatment basins, the various quality parameters are determined to check that they are within the internationally accepted standards. However, because of ill-equipped environmental laboratories, lack of qualified environmental scientists and technologists as well as inadequate knowledge of reliable techniques to determine these parameters (based on economic considerations), these wastes are most often discharged into the aquatic environment without proper treatment (UNEP, 1993). Contamination of aquatic environment due to fertilizer wastes is becoming of great concern. This is because fertilizer wastes discharged into natural bodies of water constitute a major cause of eutrophication and threaten the ecological health of the environment. The kinds of organisms present in an environment, their abundance, characteristics and activities are influenced by each other as well as by environmental conditions. Hawkes and Davis, (1971) reported that the pollution caused by fertilizers and inorganic wastes can bring about drastic changes in the composition of the microbial flora and fauna of any receiving aquatic system. Although bacteria degradation processes are largely responsible for natural oxygen depletion within the water column (Bell and Dutka, 1972; Hawker and Avan, 1979), most of the literature or contributions to the mineralization of fertilizer production wastes are concerned with microbial activity on sedimentary material (Bell and Dutka, 1972; Hawker and Avan, 1979). The NAFCON fertilizer plant is sited near the Okrika creek which eventually serves as its disposal site and little or no attention has been given to the damage done to the Okrika creek by the effluent discharge. Moreover, the scanty research on the Okrika creek is on the effluent collected from the discharge equalization basin (DEB) which does not reflect the actual constituent of the effluent that is discharged into the Okrika creek. Because of frequent clashes between industries, visitors, strangers and their host communities in Niger Delta, scientific samplings of aquatic and terrestrial environment in these areas are sometimes approximately impossible and some samplings, if however carried out, are usually done haphazardly with suspense and fear of being attacked. Consequently, there is little or no reliable data and information available on the ecological impact of the NAFCON effluent on the Okrika creek. It is therefore important to carry out a thorough assessment of the impact of the NAFCON effluent on the Okrika creek. The objectives of this study are to investigate the impact of the NAFCON outfall effluent on the bacterial population and on some selected physico-chemical parameters of the Okrika creek. This was carried out by measuring some water quality parameters and by enumerating the total cultural aerobic heterotrophic bacteria, isolating and identifying representative bacterial isolates within the NAFCON outfall effluent, within the stations along the Okrika creek and within a station of a control creek (Ikpukulubie creek) which is not exposed to the effluent discharges from the NAFCON plant. A comparison of data obtained from the Okrika creek and the control creek will present an assessment of the impact of the NAFCON outfall effluent on the Okrika creek. This investigation is intended to provide a reliable analysis of the water quality and bacterial community of the NAFCON outfall effluent and assessment of the ecological impact of the effluent on the water quality and bacterial community of the Okrika creek. It would therefore serve as a check in an effort to prevent damage to the Okrika creek and to properly maintain both the effluent and the Okrika water quality creek within certain environmental standards. MATERIALS AND METHODS The study area from which the water samples were collected is the Okrika creek in Okrika Local Government area of Rivers State, which lies in the coastal fringes of Niger Delta (Fig. 1). It stretches from the NAFCON jetty through the Okrika jetty. The Okrika creek is bounded on its eastern bank by the NAFCON complex (in Onne, Eleme Local Government Area), the Okochiri community(in Okrika Local GovernmentArea) and mangrove plants of different species and on the West by sand deposit from the dredged Okrika creek and different species of mangrove plants. The Okrika creek is confined in the salt water swamp zone and is influenced by tidal fluxes. The flow of the Okrika creek is only slightly swift and bidirectional. The creek is characterized by tall mangrove plants of different species having tangled mass stems and aerial roots of about 20-60 ft tall. The vegetation mostly consists of red mangrove. Frequent precipitation is a common occurrence in the study area and in rivers state as a whole. During the study period, i.e. 1998, the time lag of May to September was considered as the rainy season, while the dry season included the period of October to December when sampling ended. The control creek (Ikpukulubie creek) was chosen due to its relative distance from the Okrika creek and the NAFCON effluent outfall (Fig. 1). It is situated at the coastal fringes of the core south of Port Harcourt. Its vegetation is essentially the same as that of the Okrika creek. It has a fishing settlement and a rapidly developing sand fill (human settlement) along one of its banks. Based on the peculiarities and features observed around the study area, four sampling stations were established along the Okrika creek (Fig. 1). The sampling stations were chosen 50 m. from the banks of the creek and 100 m apart from each other. Station 1 is located 100 m. far from the NAFCON effluent outfall southwards that is before the outfall, close to the NAFCON jetty. The water way at this station is dredged for the reception of heavy duty vessels. There is no human settlement at the banks of this station except for the few NAFCON staff that are seen on the NAFCON jetty and few fishing canoes with two to three occupants fishing in this area. The left (West) part of this station is the place where the sand dredged from the water way is deposited and the water surface appears slightly turbid. Station 2 is located 100 m. from station 1 northwards and adjacent to the NAFCON outfall. Part of this station is also covered by the dredging, with sand deposit at the left hand side (west) of the station. There is no human settlement at the banks of the station but is characterized by muchof the mangrove vegetation. Few fishermen in canoes may also be seen fishing around this station. The water surface at this station appears more turbid than that of station 1. Station 3 is located 100 m. far from station 2 northwards. The water body at thisstation is narrower in breadth and visibly shallow at low tides with sludge deposits. It is characterized by the mangrove vegetation on the west. The creek at this part of the Okochiri community water front on the east and hence the water body at this station receive domestic and sanitary waste materials of inhabitants of this community. The water surface at this station also appears turbid. Station 4 is situated 100 m. far from station 3 northwards and also covers the remaining part of the Okochiri community water front on the east. It is characterized by the mangrove vegetation on the west and part of the eastern axis. The water surface appears relatively clearer than the three stations (1, 2, and 3) described above. The creek at this point is narrower in breadth than station 3. The control creek station (C) is located about 200 m. far from the Ikpukulubie fishing settlement and about 100 m. from the banks. The only source of contamination of this station is the open dumping of domestic and sanitary waste materials from the inhabitants of the fishing settlement. The personnel who collected the samples and carried out the investigation of this study included scientists from the environmental department of NAFCON in collaboration with indigenes of the Okrika community. All samplings during the investigation were thoroughly conducted without fear of being attacked. The fertilizer plant outfall effluent samples for bacteriological and physiochemical analyses were collected aboard an outboard engine boat, using sterile 500 mL capacity glass bottles with screw cap and sterile 2l plastic containers, respectively. With disposable hand gloves, the sampling container was held upright vertically against the outfall (at about the interface of the sea and the outfall). The effluent was collected and corked, while the sampling container was still in place, leaving a little air space to allow proper mixing of the sample before analysis. The containers were appropriately labeled after the collection, stored in a portable cool box and taken to the laboratory for storage/analysis.The Okrika creek water for bacteriological and physico-chemical analyses was collected along with the NAFCON outfall effluent (NOE) aboard and outboard engine boat. The distance between stations was measured with surveyor’s tape. The creek samples were collected at low tide to avoid too much dilution effect. The collection was carried out using sterile 500 mL capacity bottles for bacteriological analyses and sterile 2l plastic containers for physico-chemical analyses. The sampling container was held at the base and, dipping it downwards (10-12 cm) below the water surface, opened and allowed to fill corked, while still under water (APHA, 1985). This was done to eschew introducing foul filing covering on the surface of the water into the sample. The control creek samples were also collected, stored in a portable cool box and taken to the laboratory for analyses. The bacteriological analyses of the samples were conducted within 24 h. of collection of the samples. The pH checked immediately on arrival before storing in the refrigerator for analyses of the other physico-chemical parameters the next day. The samples were collected at monthly intervals from the month of May to December, 1998. However, no sampling was carried out in the month of August as a result of work stoppage embarked upon by the NAFCON staff, which restricted movement in and out of the complex, hence giving a total of seven sampling periods. Two creek water samples were collected from each station including the control station during each sampling period, giving a total of 10 creek water samples during each sampling. All in all, a total of 70 creek water samples and 14 NAFCON outfall effluent samples was collected during the seven-month sampling period. The NAFCON outfall effluent and the Okrika and control creek water samples were analyzed for physico-chemical parameters which included: temperature, pH, conductivity, total dissolved solids, dissolved oxygen, total phosphate, free ammonia, urea, Zn, Fe and total chloride. The analytical procedures used for the determination of these parameters are modificationsfrom theASTMstandards (1986),APHA (1985) and AAC (official methods of analyses, Association ofAnalytical Chemists).The temperature reading was taken at each sampling station by dipping a mercurythermometer into each homogeneously mixed sample and held for about two min. The thermometer was rinsed in buffer solution of pH 7 before reuse. The pH of samples from each sampling station including the NAFCON outfall effluent was immediately checked on arrival at the NAFCON quality control laboratory using the pH meter model: JENWAY 3020. The DO of the samples was determined using the DO m. YSI model with 51 B oxygen m. The conductivity of samples was determined using a digital bench-top conductivity meter (model Jenway 4010 conductivity meter). TDS and conductivity have the following ratio (relationship) 2.2:1. Therefore, to determine TDS, the conductivity value was divided by 2.2 to give the TDS value in mg/L. Free ammonia was determined by the direct titrimetric method. The spectrophotometric procedure was used for the determination of urea. P-dimethyl aminobenzaldehyde (DMAB) forms a yellow complex with urea in sulphuric acid medium. The intensity of the complex is directly proportional to the concentration of urea in the sample. Spectrophotometer model No. UV 160 U, Shimadzu (UV-Visible recording) was used at 436 nm wavelength. The spectrophotometer factor for urea is 227.06. Total phosphate in the samples was determined using the spectrophotometric method. Spectrophotometer model No. UV 160 U, Shimadzu (UV-Visible recording) was used, at 650 nm wavelength. The iron determination kit model: DC 110 single range colorimeter LAMOTTE was used to determine the Fe concentration in the samples. Determination of Zn was performed using the Zincon method. The spectrophotometer No. UV 160 U, Shimadzu(UV-Visible recording) was used at 620 nm wavelength. Zn in the sample forms a blue colored complex with buffered (pH 9.0) 2 carboxy-2 hydroxy-51 sulformazyl benzene, Zincon. The spectrophotometer factor for Zn is 10.9712. Total chloride determination was performed using the mercury metric method.Thetotal aerobicheterotrophic bacteria were cultured for, using nutrient agar, OXOID– CM 325, as the culture medium. The culture medium was weighed out and prepared according to the manufacturer’s specifications. This medium was also used for sub-culturing and pure culture isolation. The sub-surface of homogeneously mixed samples were extracted under aseptic conditions using sterile 1 mL pipettes and diluted serially (up to 10-6) in physiological saline as suspending medium. Diluted samples were inoculated in 0.1 mL aliquots onto the nutrient agar plates. The applied inoculation technique was the spread plate method, using a sterile glass spreader. The inoculations were made in duplicates. The plates were incubated at room temperature (30-33 °C) for 48 h. At the end of the 48 h., the isolates from the sub-cultured plates were aseptically transferred onto nutrient agar slants, labeled appropriately and incubated for 48 h. at room temperature (30-33 °C). The characterization and identification of isolated bacteria was limited to representative colonies that grew on the culture media. Bacteria isolates were identified based on their cultural, morphological and biochemical characteristics to their species levels and by comparison with characteristics of known taxa, as given by Cruickshank, et al., (1975) and Thomas, et al., (1984). Analysis of variance (ANOVA) and paired t-test were used to analyze the data obtained for each water quality parameter measured between the Okrika creek and the control creek waters and the data obtained for each parameter measured between each station of the Okrika creek and the control creek. RESULTS AND DISCUSSION The result of the range and the mean values (in parentheses) of the water quality parameters of the NAFCON outfall effluent, the Okrika creek and the control creek during the seven-month sampling period and of Federal Environmental Protection Agency (FEPA) standards for industry effluent for comparison are as shown in Table 1. Apart from conductivity, TDS, DO and total chloride, the NAFCON outfall effluent recorded the highest concentration for all the water quality physico-chemical parameters and bacteria load measured. With the exception of temperature, DO, Fe and total chloride, the concentration of all other parameters of the NAFCON outfall effluent are higher than the FEPA, (1991) standard. Generally, except for DO, the Okrika creek recorded higher concentrations for all the physico-chemical parameters and bacteria load than the control creek. The result generally revealed a gradual mixing of the constituents of the fertilizer plant outfalleffluent with the Okrika creek water as one moves awayfrom the point of discharge,diluting the effluent and reducing the original concentrations of the nutrient materials from stations 1 to 4 along the Okrika creek. Temperature values for the NAFCON outfall effluent ranged from 28.2 to 30 °C with a mean of 28.9b °C. The mean values of temperature for each of the four (1, 2, 3 and 4) stations of the Okrika creek were 28.3, 28.5, 28.2 and 28.3 °C, respectively, while the mean temperature value of the control creek was 27.4 °C. The pH mean value for the NAFCON outfall effluent was pH 9.10. The pH mean value of stations 1, 2, 3 and 4 of the Okrika creek were 8.3, 8.4, 8.20 and 8.10, respectively. While the pH mean value of the control station was 7.80. The statistical analysis carried out on the pooled Okrika creek samples and the control creek samples showed that there was a significant difference in the mean pH at 1% level of significance. The statistical analysis of the data obtained from each station of the Okrika creek and that of the control creek revealed that with the exception of station 4, stations 1, 2 and 3 differ significantly with the control creek on comparison at 1% level of significance. The high pH values of stations 1, 2 and 3 of the Okrika creek can therefore be argued to be the result of adding the NAFCON outfall effluent rich in ammonia and urea (alkaline nutrients) into the Okrika creek. The dilution effect of the Okrika creek waters resulted in low pH value of station 4, as one moves away from the outfall and northwards along the creek. The mean value of DO of the NAFCON outfall effluent was 4.3 mg/L. The DO values for stations 1, 2, 3 and 4 of the Okrika creek was 4.90, 4.80, 4.80 and 5.21 mg/L, respectively, while the DO value of the control station was 5.6 mg/L. The statistical analysis of the pooled data of the Okrika creek stations and that of the control creek waters showed that the difference between the two means was significant at the 1% level of significance, with the pooled Okrika creek mean lower than that of the control creek. The statistical analysis of the data obtained from the individual stations of the Okrika creek and that of the control creek revealed that the DO means of all the Okrika creek stations were significantly lower than that of the control creek. The mean value of conductivity for the NAFCON outfall effluent was 4.5 x 10³ μmhos/cm. The conductivity values for the Okrika creek stations were 37.8 x 10³ , 38.2 x 10³ , 51 x 103 and 43.9 x 10³ μmhos/cm,respectively. While the control station had a conductivity mean value of 36.0 x 10³ μmhos/cm. The statistical analysis carried out on the pooled data of the Okrika creek stations and the control creek water showed that they differ significantly at the 1% level of significance. The mean value of TDS for the NAFCON outfall effluent was 2050.0 mg/L, which is above the FEPA, (1991) standard value of 2000 mg/L. This indicates high levels of dissolved ions in the effluent. The TDS values for the Okrika creek stations were 1736 mg/L, 1736 mg/L, 2318 mg/L and 19955 mg/L, respectively, while the TDS mean value for the control creek was 16340 mg/L. Abnormally high soluble materials in an aquatic environment can reduce the rate of penetration of light into the aquatic microcosms, which otherwise would have served a useful purpose for photosynthetic organisms. The statistical analysis carried out on the pooled data of the Okrika creek stations and the control creek revealed that there was a significant difference between the mean TDS values, with the pooled data mean of the Okrika creek higher than that of the control creek. The T/PO4 mean values for stations 1, 2, 3 and 4 of the Okrika creek were 33.9, 33.82, 20.03 and 14.84/mg, respectively. The highest concentration, however, was obtained in station 1, while the lowest was in station 4. The control station T/PO4 concentrations were generally low and with a mean of 6.90 mg/L. The Fe concentrations of the Okrika creek stations were 0.094 mg/L, 0.109 mg/L, 0.097 mg/L and 0.086 mg/L, respectively, while the mean value of Fe concentration for the control station was 0.056 mg/ L which was the lowest value. The Free Ammonia (F/NH3) concentration for the NAFCON outfall effluent was 146.14 mg/L. F/NH3 concentrations for the Okrika creek waters ranged from 0.4547 to 83.483 for station 1, 1.8188 to87.303 for station 2, 0.7275 to 65.477 for station 3 and 0.4547to 89.12mg/Lfor station 4, with a mean of 28.89 mg/L. Relatively higher values were obtained during the dry season months. The F/NH3 concentrations of the control station ranged from 0.4092 to 2.5463 mg/L with an average of 1.33 mg/L and are also found to be relatively low. The urea concentration for the NAFCON outfall effluent was 432.26 mg/L. This is higher than the DEB value of 225.7 mg/L reported by Okpabi, (1997). The urea concentrations of the Okrika creek stations 1, 2, 3 and 4 were 163.55 mg/L, 205.51 mg/L, 142.05 mg/L and 139.45 mg/L, respectively. The urea concentration for the control station was 36.43 mg/L. The statistical analysis carried out on the pooled data of the Okrika creek and the control creek on each of these parameters revealed that the mean concentrations of these parameters of the Okrika creek were significantly higher than that of the control creek at the 1% level of significance. It also revealed that the individual stations of the Okrika creek differ significantly from the control creek with the mean concentrations of each of these parameters for each station higher than that of the control creek mean concentration. The Zn concentrations for the NAFCON outfall effluent had a mean value of 6.35 mg/L. The Zn concentrations for stations 1, 2, 3 and 4 of the Okrika creek were 4.92 mg/L, 4.80 mg/L,3.92 mg/Land 3.45 mg/L, respectively.Themean value of Zn concentration for the control station was 2.1 mg/L. The statistical analysis showed that the mean values of these parameters were higher in the Okrika creek and differed significantly from the control creek at the 1% level of significance. Also, the comparison of the data obtained from the individual stations of the Okrika creek revealed that apart from station 1, all other stations of the Okrika creek differ in their Fe concentrations with the control creek. All the stations of the Okrika creek differ significantly from the control creek in their Zn concentrations at the 1% level of significance. The mean value of the total chloride concentrations of the NAFCON outfall effluent was 32.43 mg/L. The T/Cl2- concentrations for the Okrika creek stations were24743 mg/L, 23650 mg/L, 23768 mg/ L and 24230 mg/L,respectively. The T/Cl2- concentration for the control station was 23886 mg/L. The mean total chloride concentration of the outfall effluent was 32.43 mg/L. This value was found to be lower than the FEPA standard of 250.0 mg/L. However, the effect of this low chloride concentration could encourage increased microbial activity and could lead to high oxygen demand. Similarly, the analysis of the pooled data obtained from individual stations of the Okrika creek revealed no difference at the 1% level of significance with the control station. The mean values of the enumerated viable bacteria colony counts obtained for the NAFCON outfall effluent and the creek stations are presented in Table 1 above. The bacterial counts for the NAFCON outfall effluent mean of 39.8 x 10⁷ colony forming units cfu/ml. The bacterial counts for the Okrika creek stations had means of 26.1 x 10⁷ cfu/mL29.8 x 107 cfu/mL,31.9 x 107 cfu/mL and 29.9x 10 cfu/mL, respectively. However, the highest count of 49.0 x 10⁷ and the lowest count of8.5x107 cfu/mL were obtained at stations 2 and 4, respectively. The bacterial colony counts of the control creek station had a mean value of 17.7 x 10⁷ cfu/mL. A total of 12 species of bacteria which include Aerococcus viridans, Alcaligenes faecalis, Bacillus cereus, Citrobacter Freundii, Escherichia coli, Flavobacterium aquatile, Klebsiella pneumoniae, Micrococcus, esp. Proteus vulgaris, Pseudomonas aeruginosa, Serratia marcescens and Staphylococcus aureus was isolated. The occurrence and abundance (%) of representative bacteria isolated from the NAFCON outfall effluent, the Okrika creek and the control creek are as presented in Fig. 2. All of the bacterial types were isolated from the control creek, whereas Citrobacter freundii was not isolated from the NAFCON outfall effluent and from the Okrika creek. Aerococcus viridans was also from the control creek and Okrika creek but from the NAFCONoutfall effluent. With the exception for Aerococcus viridans and Citrobacter freundii, all of the bacterial types isolated in this investigation occurred in the NAFCON outfall effluent. It could be affirmed that the outfall effluent exerted a bactericidal effect on Aerococcus viridans and Citrobacter freundii; it had an inhibitory effect on Aerococcus viridans, Bacillus cereus, Klebsiella pneumoniae and Proteus vulgaris and exerted an enrichment effect on Alcaligenes faecalis, Bacillus cereus, Escherichia coli, Flavobacterium aquatile, Klebsiella pneumoniae, Micrococcus, sp., Pseudomonas aeruginosa, Serratia marcescens and Staphylococcus aureus at some stations of the Okrika creek. The statistical analysis carried out on the pooled data of the Okrika creek revealed that there was a significant difference in the mean total aerobic heterotrophic bacterial count at the 1% level of significance when compared with the control creek data. The comparison of the individual stations of the Okrika creek with the control creek also showed a significant difference, with the mean bacterial count of the Okrika creek stations being higher than that of the control creek. The increase in the bacterial population of the Okrika creek has direct correlation with almost all of the parameters measured, including nutrient content, DO, etc. The all-important issue associated with the use of water is the concern for its quality and treatment. This present investigation has shown that the NAFCON effluent quality is poor and contains high concentrations of inorganic constituents (such as phosphate, ammonia and urea) and bacteria which were above the acceptable standard (FEPA) limits. This has extremely reduced the water quality of the Okrika creek. Therefore, the available DO must be used to sustain oxidation (degradation) of the available nutrients and support the normal range of aquatic life. The temperature values of the NAFCON outfall effluent is below the FEPA (1991) standard value of 35ºC and higher than 28.3 ºC reported by Okpabi (1997) in the Discharge equalization basin (DEB). The temperature of water is a very important parameter because of its effect on the aquatic life. A sudden change in temperature can result in a high rate of mortality of aquatic life (Umesi, 1989). Statistical analysis of the data obtained from the creek waters revealed that there is a significant difference at 1% level of significance with the temperature of the Okrika creek being higher than that of the control creek. It can therefore be inferred that the high temperature of the Okrika creek waters was as a result of the discharge of the NAFCON outfall effluent into the Okrika creek. The temperature values obtained in this investigation for the Okrika creek falls within the temperature range 26 °C to 30 °C, reported byAlabaster and Lloyed, (1980). The temperature have been influenced several degrees by the insulating effect of increased nutrient load resulting from the input of industrial discharge as the river flowed downstream. The statistical analysis which was carried out also revealed that only station 1 showed significant difference in the statistical analyses carried out on the individual stations of the Okrika creek. The pH values of the outfall effluent recorded during the study is higher than the FEPA (1991) standard values of 6.0 to 8.0 and lower than 9.16 reported in DEB by Okpabi, (1997). The high pH value of the outfall effluent is attributed to the high ammonia and urea concentrations of the process condensates from the ammonia and urea plants and from the sanitary sewage system following decomposition of organic matter. pH is an important qualityparameter of natural waters. The concentration range suitable for the existence of most biological life is quite narrow and critical (Umesi, 1989). The DO concentration of the NAFCON outfall effluent was below the FEPA (1991) standard value of 5 mg/L. The recorded DO mean of 4.3 mg/L could be attributed to the high degradable nutrient material content of the effluent which consequently increases microbial growth which resulted in increasing oxygen demand. Low DO concentrations suggest an increase in the bacterial population as a result of an increase in temperature, concentration and low flow rate of nutrient materials (Reid, et al., 1980). The relatively higher values of the DO obtained at station 4 is a reflection of the dilution effect of the Okrika creek water which tend to lower the concentration of degradable materials as one moves away from the outfall (discharge point) and give relatively normal bacterial population at this station. The observed relatively lower values of DO at stations 1, 2 and 3 could be attributed to the increased microbial growth due to the presence of high concentrations of degradable organic and inorganic matters which resulted in a tendency to be more oxygen demanding, making oxygen less available to the desirable organisms including fishes. This is in agreement with the observations made by Ekundayo, (1977) and Imevbore, (1983). It can therefore be argued that the physicochemical and microbiological properties of the Okrika creek have been altered significantly by the NAFCON outfall effluent, hence all life forms in the Okrika creek could be endangered. In a similar study, Okpabi, (1997) reported a DO concentration of 3.99 mg/L in effluent from the DEB of NAFCON. The prediction of the effect of pollution on a body of water can be reduced to that of predicting the dissolved oxygen content (Umesi, 1989). Bacterial degradation processes are largely responsible for natural oxygen depletion within the water column, resulting in eutrophication problems. Oxygen is required for the respiration of aerobic life forms. Thus, its depletion will result in death of these lifeforms (Bell and Dutka,1972;Umesi, 1989). The mean conductivity value of 4.5 x 10³ µmhos/cm of the NAFCON outfall effluent is higher than the FEPA, (1991) standard of 4.0 x 10³ µmhos/cm. The slight increase in conductivity could be due to the high level of conducting particles in the effluent from chemical spills and production process. Higher conductivity value of 4.6488 x 10³ µmhos/cm has also been reported by Okpabi,(1997) in a similar studycarried out in DEB. Concentrations of the ions of metals and non-metals in aquatic environment are known to affect the metabolism of bacteria and higher organisms in sea water. Most of these ions (especially cations) are toxic in varying degrees to aquatic life (Harvey, 1955; Umesi, 1989). The analysis of the data obtained from the individual stations of the Okrika creek and those of the control creek revealed that there was no significant difference between stations 1 and 2 of the Okrika creek and the control creek. However, stations 3 and 4 of the Okrika creek differ significantly from the control creek water. This can be inferred to have occurred as a result of high ionic content of the outfall effluent and the effect of the components of the open waste dump by the inhabitants of the Okochiri community at stations 3 and 4 of the Okrika creek. The analysis carried out on the data obtained from the individual stations of the Okrika creek revealed that stations 3 and 4 differ from the control creek. This can be inferred to have occurred as a result of the effect of the soluble materials in the outfall effluent generated from the overall operations of NAFCON and the effect of the open waste dump by the inhabitants of the Okochiri community at stations 3 and 4 of the Okrika creek. The total phosphate concentrations of the NAFCON outfall effluent had a mean of 89.70 mg/L, which is higher than that recommended by FEPA, (1991) and that reported in DEBby Okpabi, (1997). This high phosphate level could be attributed to the untreated surface run-off from the NPKplant and BBP which flowsdirectly intothe outfall through the west drain basin (WDB) and phosphate from ammonia and urea cooling towers blow-down. The mean value of the Fe concentrations for the NAFCON outfall effluent was 0.64/mg. The Fe concentration was not high as may have been expected. Regarding the mean Fe concentration, 0.64 mg/L of the outfall effluent was low compared to the FEPA, (1991) standard of 2.0 mg/L and 0.88 mg/L reported in DEBby Okpabi, (1997). This suggests that the piping systems of the plants are adequately protected from chemical and biological corrosion. The free ammonia concentration of the outfall effluent is higher from the FEPA standard value of 0-5 mg/L and lower than 356.8 mg/L reported by Okpabi, (1997) in DEB. This high ammonia concentration in the outfall effluent is attributable to the high level of ammonia in the process condensate from the ammonia and urea plants which were not properly stripped by the stripper-polisher system as well as the high level of ammonia in the emergency dumps. Excretory materials from the sanitary sewage system also contributed to the high ammonia level in the outfall effluent. The high level of urea recorded in the outfall effluent could be traced back to the abnormallyhigh urea level in theprocessed condensate from the urea plant. The urea synthesis and granulation sections could contribute greatly to the high urea concentration of the outfall effluent. Housekeeping activity which disposes/discharges urea granules into open drains on a daily basis could also contribute to the shooting-up of the urea level in the outfall effluent above the FEPA standard. The critical age of the plants could lead to the discharge of the effluent containing high levels of phosphate, ammonia and urea as well. Bell and Dutka, (1972) reported that abnormally high concentrations of T/PO4, F/NH3 and (NH2)2CO could result in eutrophication problems of water bodies and may also influence available trace metals which could result in a beneficial or detrimental effect. It can therefore be argued that these differences were due to the heavy load of these nutrient materials in the NAFCON outfall effluent which enhances bacterial proliferation and consequently depletes available oxygen in the water column. The concentration of Zn obtained in the outfall effluent was found to be higher than the FEPA standard value. This high Zn level in the outfall effluent could be said to have resulted from Zn contaminants in most of the chemicals such as anticorrosion agents used for coating and sandblasting of pipes and tanks and bactericidal agents dosed into the different water to maintain equilibrium in the production process. The Zn value recorded in the outfall effluent is more than 0.59 mg/L reported by Okpabi, (1997) in DEB. The values of Fe obtained in this investigation fall within those detected by Rivail Da Silva, et al., (1996). This indicates that such elevated concentrations largely originate from industrial discharges. This is also applicable to Zn in which the values recorded in this investigation were higher than that of Rivail Da Silva, et al., (1996). The significant difference in the T/Cl2 content of the creek water samples could be attributed to the common features of both creeks, especially the influence of human settlement along the banks of both creeks. The creeks receive both human excrete which contains about 6 g of chloride per person per day which tends to have overshadowing influence over other conditions such as leaching of chloride containing materials used in construction of pavements, rocks and soil. According to Lyman and Fleming, (1940), the chloride content of 19745 mg/Lobtained in Ocean Water Falls within the range was recorded in this investigation and supported these findings. The population of any aquatic system is to a large extent influenced by the concentration of dissolved constituents in the water body (Atlas, 1988). The critical levels of parameters such as T/PO4, F/NH3 and (NH2)2CO, which act as nutrients, were in concentrations well enough to encourage growth of bacteria, especially as there are low concentrations of toxic metals such as Fe and Zn in the effluent. Bacterial load increases in response to an increase in the nutrient materials with the tendency for depleting available oxygen (Hawker and Avan,1979). Exceptionally large bacterial population emerges where conditions make high concentrations of nutrient materials. The presence of bacteria in water bodies is important when they are identified as the major organisms which initiate the breakdown of introduced waste to various metabolic intermediates (Hollaway, et al., 1980). The results obtained in this investigation showed that the total aerobic heterotrophic bacteria count range from 8.5 x 10⁷ to 49.0 x 10⁷ cfu/mLwas higher than 1.0x 10² cfu/mL reported byPelcza, et al., (1982).Itmay thus be argued that the increase in the bacterial population of the Okrika creek was as a result of comparatively high nutrient content of the Okrika creek, caused by very high concentrations of these nutrients (T/PO4, F/NH3, urea, etc.) in the NAFCON outfall effluent. The highest mean bacterial count recorded in station 3 of the Okrika creek could be one result of the multiplying effects of the human settlement along one of the banks of this station. The inhabitants at the bank of this station were noted to contaminate the water with their domestic and sanitary waste materials. Such settlements have been documented to increase the microbial load in water bodies mainly by adding organic matter, which is a potential source of nutrient (Coleman, et al., 1974). Similarly, Imevbore, (1983) reported that inhabitants of coastal area passed faeces and threw garbage directly into water as a means of waste disposal. This is reflected in the presence of coliform bacteria such as Escherichia coli. The relationship between environmental factors and natural microbial populations is fairly complex and could lead to variations in bacteria numbers and types. It can therefore be argued that the absence of Citrobacter freundii from the NAFCON outfall effluent and the Okrika creek and its presence in the control creek was an indication of extreme pollution of the Okrika creek with the NAFCON outfall effluent, that is, Citrobacter freundii lacked the ability to oxidize or utilize these nutrient materials present in the outfall effluent and in the Okrika creek. In other words, this organism could not withstand the stress posed on the environment by this outfall effluent. Similarly, the absence of Aerococcus viridans in the NAFCON outfall effluent and its presence in both the Okrika creek and the control creek suggest that this species of bacteria lacks the ability to proliferate in such an extremely harsh environment. However, the different responses exhibited by these bacteria species could be due to some inbuilt properties of the different species (Atlas, 1988) which also suggests that each of these bacterial species was influenced by the common factors affecting all of the samples studied in this investigation. Apart from conductivity, TDS, DO and T/Cl2-, the NAFCON outfall effluent recorded the highest concentration for all of the physico-chemical parameters of the water quality and bacteria load measured. With the exception of temperature, DO, Fe and T/Cl2-, the concentration of all other parameters of the NAFCON outfall effluent are higher than the FEPA standard. Generally, except for DO, the Okrika creek recorded higher concentrations for all of the physico-chemical parameters and bacteria load than the control creek. The study generally revealed a gradual mixing of the constituents of the fertilizer plant outfall effluent with the Okrika creek water as one moves away from the point of discharge, diluting the effluent and reducing the original concentrations of the nutrient materials from the stations 1 to 4 along the Okrika creek. The presence of coliform bacteria such as Escherichia coli in all the analyzed water samples is an indication of the presence of faecal matter in all of the water samples. Its presence in the NAFCON outfall effluent is attributable to the constituents of the sanitary sewage from the sewage treatment plant, whereas the combined effect of this and the open waste dump by the inhabitants of the banks of the stations 3 and 4 of the Okrika creek and the open waste dump by the inhabitants of the banks of the control creek establish their presence in the creek water samples. The presence of relatively high culturable aerobic heterotrophic bacteria in both the outfall effluent and the Okrika creek water is a direct consequence of heavy load of nutrient materials such as phosphate, ammonia and urea in the NAFCON outfall effluent, exceeding the FEPA standards with the tendency for depleting available oxygen in the Okrika creek. The present study shows that the effluent discharged from the National fertilizer company of Nigeria (NAFCON) leads to drastic changes in physicochemical and bacteriological water quality characteristics of the Okrika creek. REFERENCES
AUTHOR (S) BIOSKETCHES Obire O., Ph.D., Senior lecturer and the Head of Department of Applied and Environmental Biology, Rivers State University of Science and Technology, Port Harcourt, Nigeria. Email: omokaro515@yahoo.com Ogan, A., B.Sc., M.Sc., Ph.D. student, Department of Applied and Environmental Biology, Rivers State University of Science and Technology, Port Harcourt, Nigeria Email: omokaro515@yahoo.com Okigbo R. N., Associate professor in Mycology Plant Pathology and former Chair of the Department of Botany, Nnamdi Azikiwe University, Awka, Nigeria. Email: okigborn17@yahoo.com This article should be referenced as follows: Obire O.; Ogan, A.; Okigbo R. N., (2008). Impact of fertilizer plant effluent on water quality . Int. J. Environ. Sci. Tech., 5(1), 107-118. © IRSEN, CEERS, IAU The following images related to this document are available:Photo images[st08013f2.jpg] [st08013f1.jpg] [st08013t1.jpg] |
| |||||||||
