 |
| About Bioline | All Journals | Testimonials | Membership | News |
|
||||||
|
||||||
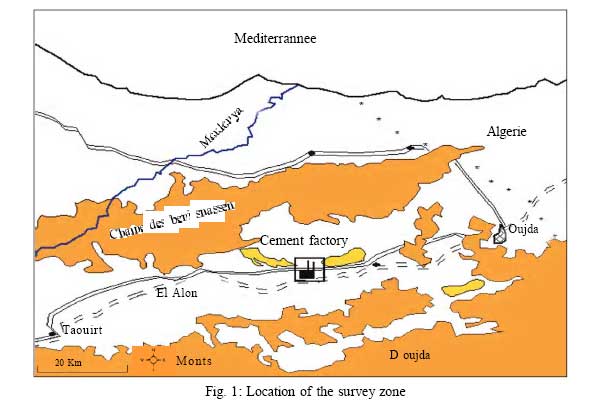
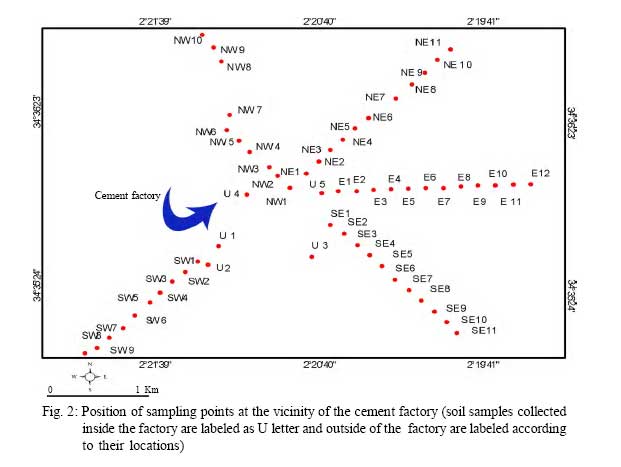
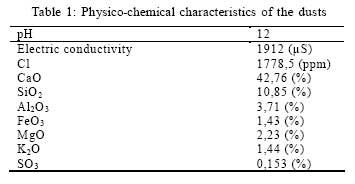
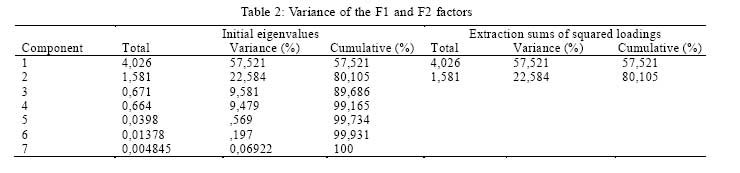
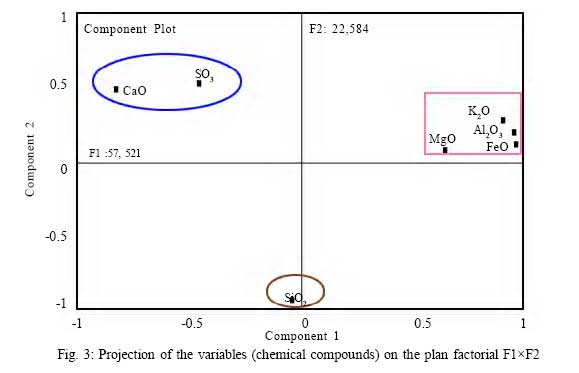
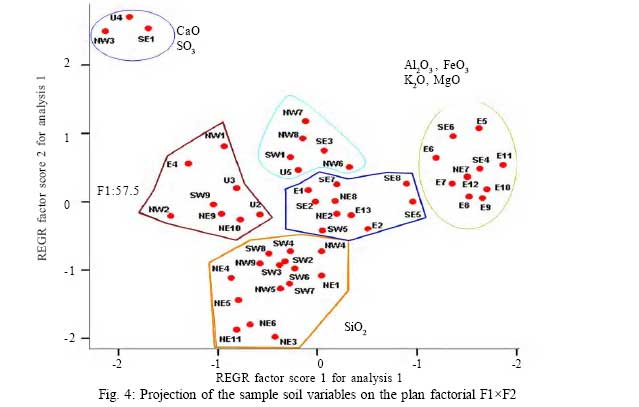
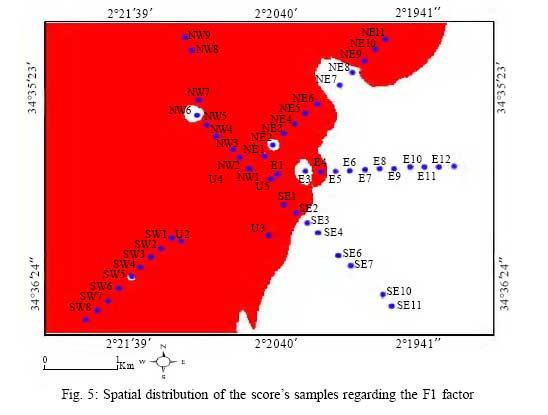
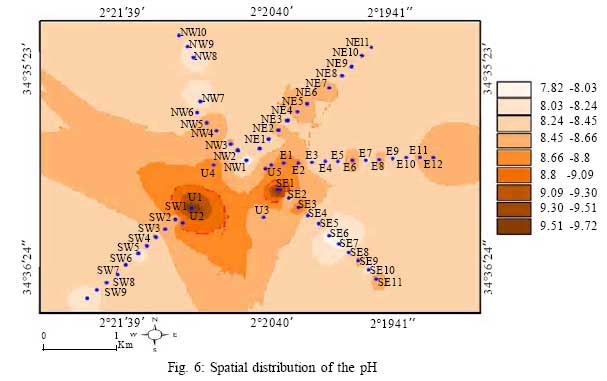
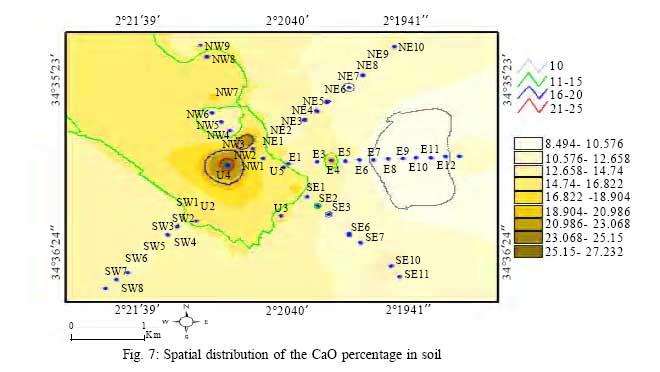
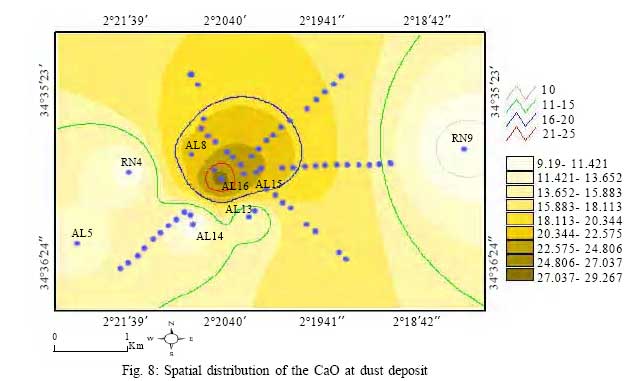
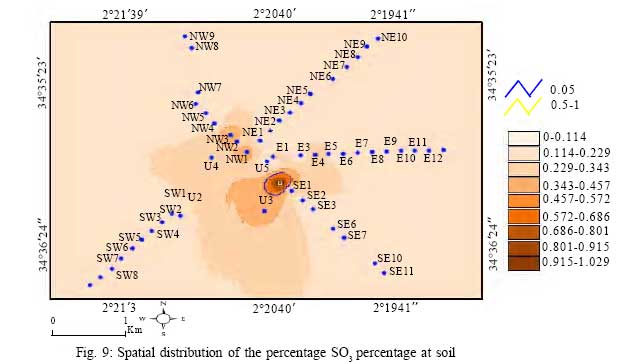
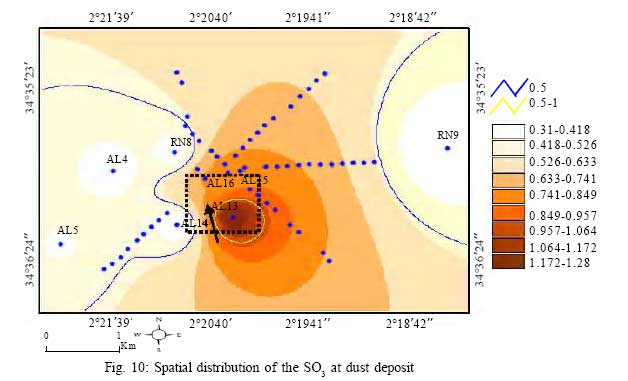
International Journal of Enviornmental Science and Technology, Vol. 5, No. 1, Winter 2008, pp.125-134 Assessment of cement's dust impact on the soil using principal component analysis and GIS 1*Z. Zerrouqi; 1M. Sbaa; 2M. Oujidi; 1M. Elkharmouz; 2S. Bengamra; 3A. Zerrouqi 1Laboratory of Hydrobiology and General Ecology, Mohamed Premier University, Oujda, Morocco Received 16 May 2007; revised 12 July 2007; accepted 24 October 2007; available online 26 December 2007 Code Number: st08015 ABSTRACT: To evaluate the impact of the cement’s dust emitted by the eastern Moroccan cement factory (Oujda Holcim) and deposited on the soil of the Ain Lahjar commune, 58 samples of soil were collected around the factory on a radius of 3 km approximately. The physicochemical analyses of the upper 3 cm of the soil surface samples correspond to the pH, electrical conductivity, the chlorides and the oxides of Ca, Al, Fe, K, Mn, S and Si which were analyzed by the fluorescence of X-rays. The preliminary results demonstrate that this dust are especially basic and contain a high free lime (43% CaO). The principal component analysis (applied on the 58 samples of soil) allows deducting that the free lime and the sulfur oxide are the tracer elements of this form of pollution. Furthermore, the spatial projection of the factor scores of the principal component analysis using the geographical information system permits to determine the spatial distribution of more polluted areas of soils as well as to estimate their surface (63.3% of the survey zone). Key words: Cement dust, soil, pollution, free lime, spatial distribution INTRODUCTION The impact of the atmospheric pollution on the ecosystems was demonstrated at several times (Bliefert and Perraud, 2001; Grantz, et al., 2003). Otherwise, this form ofpollution is caused byindustrial activities including the cement industry. The main impacts of the cement activity on the environment are the broadcasts of dusts and gases. These particles or dusts are very numerous and varied. This diversity is assigned to the different sources of broadcast (Laj and Sellegri, 2003). Indeed, two types of particles are to be distinguished: the primary particles that are cleared directly in the atmosphere and the secondary particles that are formed in the atmosphere following chemical transformations. The particles can enter into soil as dry, humid or occult deposits and can undermine its physico-chemical properties. The deposit of the particles is complex and it is controlled by the atmospheric stability, the roughness of the surfaces as well as the diameter of the particles (Hosker and Lindberg, 1982). Certainly, the dry deposit of the atmospheric particles is a longer process than the two other types of deposits (Hicks, 1986). Indeed, it is relevant to mention that in the arid regions, the dry deposits are particularly more important (Grantz, et al., 2003). The atmospheric particles can have as consequence the reduction of biodiversity and the quality of goods and services offered by the ecosystems. The main visible pollution generated by the cement industry corresponds to the dusts. Indeed, the dusts can be emitted at every stage of the manufacturing process of the cement: extraction of the raw material, crushing, production, etc. The main objective of this research is to assess the impact of the dusts given out by a cement factory on the physicochemical characteristics of the soil at the vicinity of the cement factory. The zone of survey is part of the township Ain Lahjar that is located in north-east of Morocco. It presents an arid climate (Haloui, 1991) and geology tochalkydominance (Laouina, 1990), (Fig.1). MATERIALS AND METHODS The sampling of soil of Ain Lahjar township has been performed in summer of the year 2002. The method of sampling the surface soil (the upper 3 cm layer) is according tothe normAFNOR X31B(AFNOR, 1999). Indeed, 58 points of sampling have been chosen based on the dominant directions of the wind: NW, SW, SE and E. The sampling has not been achieved in the west direction because of the presence of the relief. All samples were collected 3 km far from the factory. The stationsof sampling were accuratelylocated using global positioning system device (Fig.2). The samplescollected from theupper 3 cm layer of the soil were dried in 100 °C oven during 24 h. and sifted to a fraction lower than 2 mm (Selim, et al., 1989). -The pH is measured in a soil solution with a report soil/water equal to 1/ 2.5 (Kotto, et al., 1990). -The electric conductivity is measured in a soil solution with a report soil/water equal to1/5 (Kotto, et al., 1990). -The chlorides are measured by the nitrate of silver (AFNOR NT F90-014). -The oxides of calcium, aluminum, iron, potassium, magnesium, sulfur and silica are analyzed byfluorescence through X rays (Öblad, et al., 1982 and Janhäll, et al., 2003). The used statistical treatment method is the principal component analysis (PCA). PCA is the way of identifying patterns in data and expressing the data in such a way as to highlight their similarities and differences. PCA can provide information on the source contribution of particle composition. It was applied to quantify the source contribution (Arditsoglou and Samara, 2005). PCA has been widely used in geochemical applications to identify pollution sources (Facchinelli, et al., 2001). Geographical information system (GIS) software is increasingly used in environmental pollution studies (Corwin and Wagenet, 1996). It permits to draw a spatial distribution of the different measured parameters. GIS is one such tool that statistically estimates such a survey to maximize the amount of information using suitable interpolation technique. The interpolation technique used in this paper is the inverse distance weighted (IDW). IDW estimates grid cell values by assigning the values of sample data points in the vicinity of the cell. ThesoftwareArcview3.2 permitted us to draw maps of isovalue. RESULTS AND DISCUSSION The chemical composition analysis showed that the raw materials of the cement are essentially limestone (80%) and clay (20%). The dusts with their elevated pH 9.2 form a very basic substratum. Besides, the dusts are characterized by an elevated salinity (1912 µS). Otherwise, they are poorer in the oxides of aluminum (Al2O3), iron (FeO3), potassium (K2O), magnesium (MgO), sulfur (SO3) and the silica (SiO2) (Table 1). However, it is necessary to mention the existence of other particles generated by the cement industry which are rich in SO3. In order to detect the impact of the cement dust on the upper 3 cm layer of soil, the following parameters were determined: electric conductivity, chlorides and SO3 content, pH and CaO that characterize the cement dusts. The indicators of the cement’s pollution were attempted by employing the absolute principal component analysis. Only the first two factors have been kept because they present a significant threshold superior to 15%. The inertia of these two factors is of 80.1%: 57.52% for the F1 axis and 22.5% for the F2 axis (Table 2). The chemical compounds and the sample soil have been projected separately in the plan factorial F1 × F2 in order to understand their distribution according to the factorial axes. Thus, in the factorial plan that totals 80.10%, PCA allows us to differentiate the three associations (Fig.3) of which each one represents an assembly of chemical elements that characterizes the issuing source: - The association A stands on the negative plan of the F1 axis. It is formed by the two elements SO3 and CaO, which are two main indicators of the pollution induced and NW3 samples (Fig.4). - The association B that stands on the positive plan of the F1 axis, opposing the first association, is represented by the characteristic elements of soil Al2 O3, FeO3, K2 O and MgO. - The association C stands on the negative pole of the F2 axis. It is represented by silica (SiO2). By definition, the F1 axis opposes the associations A and B. To this axis contribute the elements Al2O3, FeO3s, K2O and MgO positively and CaO and SO3 negatively. The F2 axis is defined by the C association of the SiO2 that opposes to the A association. The spatial distribution of the F1 factor (Fig.5) shows that the negative values of this factor are concentrated inside the factory (U4) and in its immediate neighborhood with a strong diffusion in the SW, NW and NE directions. The positive values are distributed elsewhere, especially in the E and SE directions. The electric conductivity values of the soil samples vary between 136 and 431 µS/cm. These values which are lower than 500 µS/cm testify that these soils are low in salinity (<0.25 mS/cm) to moderate (0.25 and 0.75 mS/cm). At the 3 cm layer level, the contents in chlorides are very low, since they don’t exceed 50 parts by millions (ppm). The maximal values are noted in SE3 and SE7 (forest soils) with the respective values of 44.21 ppm and 42.02 ppm. The isovalue map of the pH created by the Arc-view 3.2 software using the IDW method (Fig.6) shows 2 main pits: - The first is noted inside the factory in the SW direction. It includes the U1, U2 and U4 points. - The second pit, which is less important, is recorded to the immediate neighborhood of the factory towards SE. The CaO spatial distribution (Fig.7) shows a very important accumulation pit in the factorywith a strong diffusion towards NW revealing the influence of the SE winds. In order to verify the impact of the cementry dusts on soil, it was useful to refer to the analysis results by FRX of the dust deposit collected by seven passive sensors installed in the setting of the factory and precisely in Ain Lahjar (AL4, AL5, AL13, AL14, AL15 and AL16) and in Rislane (RN8and RN9). Indeed, the chemical analyses of the dust deposit are limited to some months of the two years of follow-up (2001 and 2002). The chemical element tracer of dusts of industrial origin is free lime (42.7% of CaO). The rate means of this element in the dust deposit has been calculated and its spatial distribution is represented as an isovalue map (Fig.8). The spatial distribution of the CaO in the dust deposit shows that the free lime is concentrated in the factory, notably in AL15 and AL16 with 29.27% and 23.74% as their values, respectively. The first readingof the SO3 spatial distribution (Fig.9) in soil shows that the levels of the most important accumulation are localized in the nearest zones of the factory. The maximal value (1.03%) is marked in the SE1 point. The NW3 point presents an elevated enough content in SO3 (0.55%) in relation to the other sampled points. Also, the mean rates of the SO3 in the dust deposit have been calculated and their spatial distribution is represented as isovalue map. The curves representing the scattering of SO3 in the dust deposit (Fig.10) show a strong concentration of this element inside the factory, especially in the AL13 sensor with a maximal value of 1.28% followed by rates of 0.8% and 0.75% respectively in theAL15 andAL16 sensors.The physico-chemical characteristics of the particles are influenced by their mode of formation. Indeed, the primary particles, mainly given out by mechanical processes, often have a chemical composition similar to the related materials (Laj and Sellegri, 2003). This elevation of the pH of the soil is explained by a high level of dust in free lime (42.76% of CaO). In addition, the dusts are characterized by an elevated salinity that can beinterpreted bytheir high content in mineral salts, particularly the chlorides and the calcium. The mechanisms by which the particles interact with the environment are extremely complex (Laj and Sellegri, 2003). Indeed, it is critical to highlight that the dry deposits are particularly more important in the arid regions. These deposits are particularly made of big particles (Grantz, et al., 2003). The spatial information about soil properties is essential for effective and sustainable soil protection (Feldhaus, et al., 1997). The setting-up of the interfaces between principal component analysis and geographical information system permits to improve and facilitate the analysis of the data (Dray, 2003). The spatial distribution of F1 factor which is achieved with the help of the geographical information system permits to determine the area impact of the cement factory. It is the area of the negative values of F1 that represents the impact area of the cement factory broadcasts. It is estimated at 63.3% of the total area of the survey zone. Two pits of the pH of soil are noted near and inside the factory. The elevation of the pH in these zones can be linked easily to an important deposit of the cement dusts in these zones. The most elevated content in CaO is localized in U4 because it is near to the limestone heaps. Otherwise, it notes an important content in CaO at the NW3 point which is next to a deposit of inert waste (descended of the demolition) belonging to the factory. A strong concentration in CaO is also noted in SE1 which is very close to the factory. This elevation can have a natural origin (chalky fur outcrop) or an entropic origin (dust deposits). Besides, the more it moves away from the cement factory, the more the concentration of CaO decreases and this is what lets us deduct that the elevation of the rate of CaO in SE1 soil and NW3 has at least an entropic origin for a part. The sulfur oxide in soil can have an organic or mineral origin. The elevated content of SO3 was noted at the vicinity of the cement factory in the SE1 point. of the elevation of the percentages of this element in This point is situated to the immediate neighborhood soils inside the factory and those of its immediate of the combustible stocks (coke of petroleum) which is neighborhood (SE1 and NW3). It is important to with a highcontent ofSO3 (4.05%). Indeed, the sampled underline thatthe SO3 present in soil canhave another soil at this point is of abnormally black color revealing entropic origin, which is the combustion of the fossil the direct influence of these stocks uncovered. The fuels (coke of oil) used by the factory and which SO3 can also come from the stocks of gypsum (39.65% generates the SO2 (Reddy and Venkataraman, 2002). of SO3). The accumulation of SO3 in the dust deposit Indeed, it was assumed that 100% of the sulfur in the collected inside the factory confirms the entropic origin fuelis releasedinto the atmosphere (KatoandAkimoto, 1992; Arndt, et al., 1997). The fossil fuels in the cement plants are because of thermal energy generation in the cement kilns and captive power generation (Das and kandpal, 1997). Through a survey concerning the physico-chemical properties of cement dust and more than fifty soil samples belonging to Ain Lahjar commune, the influence of cement industry on the neighbouring soil was demostrated. PCA permitted to deduct the element tracers of the pollution led by the cement industry (CaO and SO3) and to detect the soil samples affected by the particular pollution. The use of the geographical information system allowed to value the spatial distribution of the polluting particles to thelevel of soil and to determine thesurface impacted by the dust deposit which is estimated to 63.3% of the total surface of the survey zone. ACKNOWLEDGEMENTS The authors would like to thank the entire staff list ofthe Oriental Cement factory for their assistance with the practical work. REFERENCES
AUTHOR (S) BIOSKETCHES Zerrouqi, Z., Graduate student in Environmental Science at Laboratory of Hydrobiology and General Ecology, University of Mohamed Premier, Oujda, Morocco. Email: zenviron@yahoo.fr Sbaa, M., Ph.D., Lecturer in the Department of Biology, University of Mohamed Premier, Oujda, Morocco. Email: mohsbaa@yahoo.fr Oujidi, M., Ph.D., Lecturer in the Department of Geology, University of Mohamed Premier, Oujda, Morocco. Email: oujidi@sciences.univ-oujda.ac.ma Elkharmouz, M., Graduate student in Environmental Science, Laboratory of Hydrobiology and General Ecology, University of Mohamed Premier, Oujda, Morocco. Email: elkharmouz@yahoo.fr Bengamra, S., Graduate student in Environmental Science at Laboratory of External Geodynamic and Valorization of the Sedimentary Basins, University of Mohamed Premier, Oujda, Morocco. Email: bengamras@yahoo.fr Zerrouqi, A., Research associate in Emory University, 2303-C Briarcliff road, Atlanta , GA 30329, USA. Email: azerrou@gmail.com This article should be referenced as follows: Zerrouqi, Z.; Sbaa, M.; Oujidi, M.; Elkharmouz, M.; Bengamra, S.; Zerrouqi, A.,(2008). Assessment of cement’s dust impact on the soil using principal component analysis and GIS. Int. J. Environ. Sci. Tech., 5(1), 125-134. © IRSEN, CEERS, IAU The following images related to this document are available:Photo images[st08015f4.jpg] [st08015f3.jpg] [st08015f10.jpg] [st08015f9.jpg] [st08015f7.jpg] [st08015f5.jpg] [st08015f2.jpg] [st08015t2.jpg] [st08015t1.jpg] [st08015f6.jpg] [st08015f8.jpg] [st08015f1.jpg] |
| |||||||||
