 |
| About Bioline | All Journals | Testimonials | Membership | News |
|
||||||
|
||||||
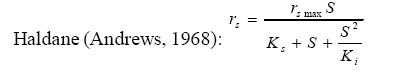
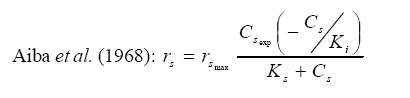
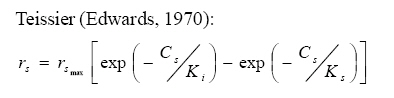
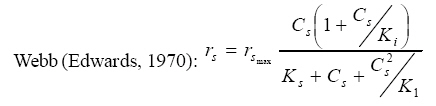
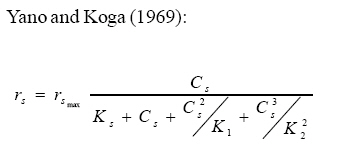
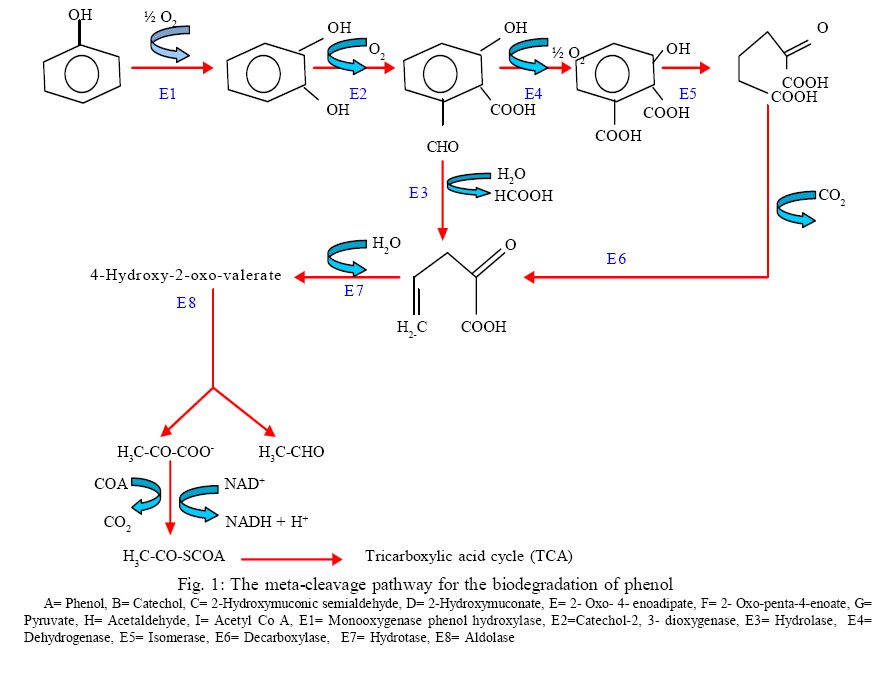
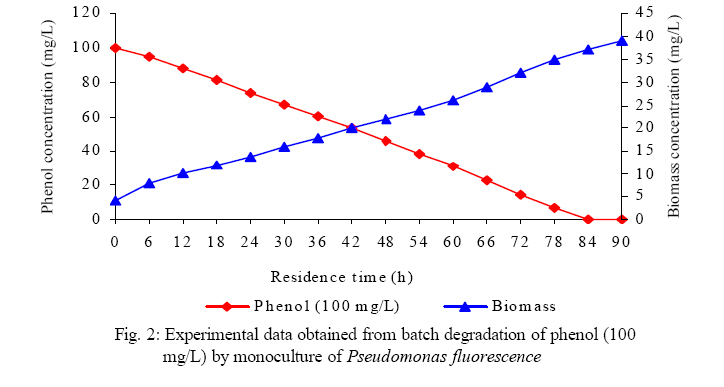
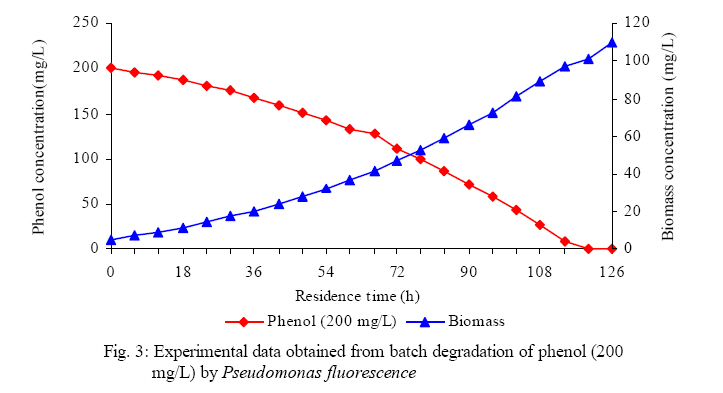
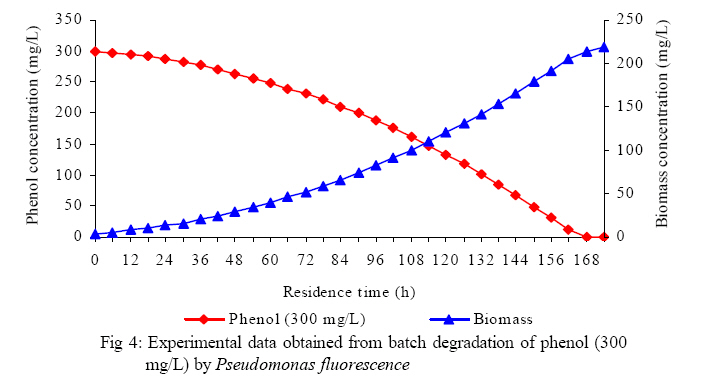
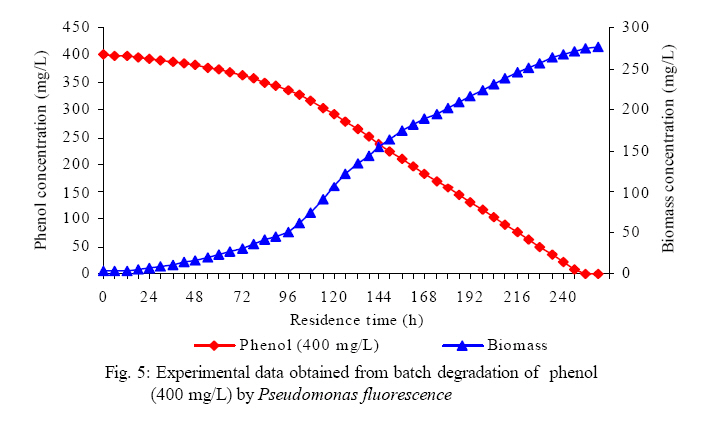
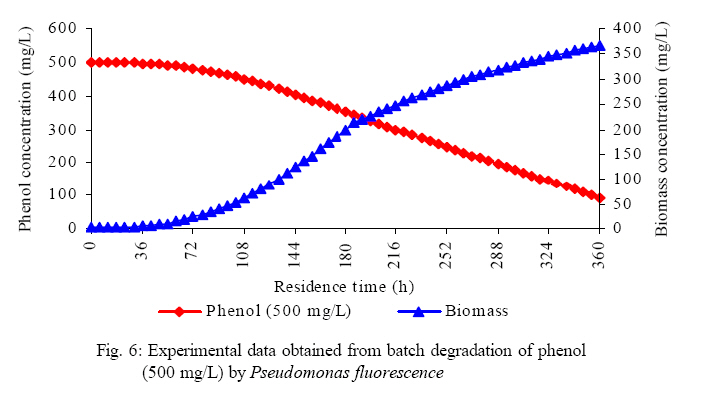
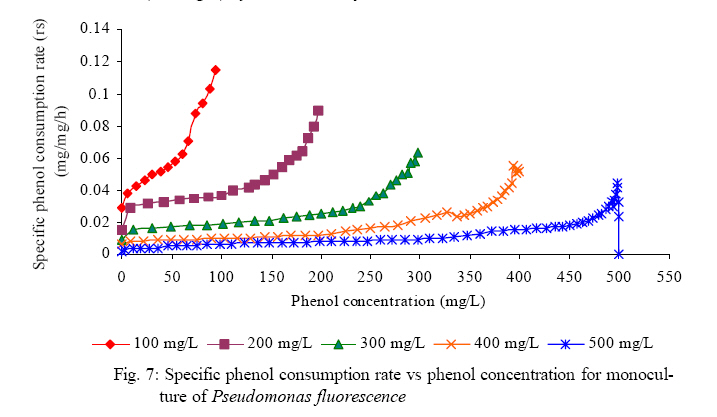
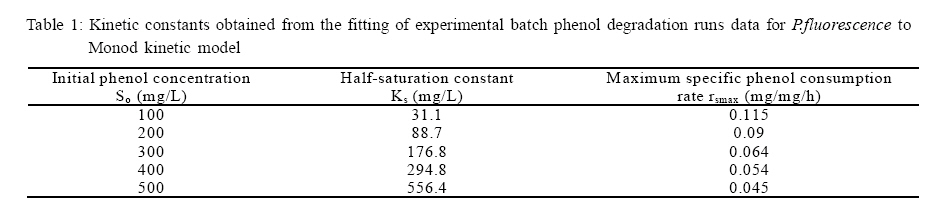
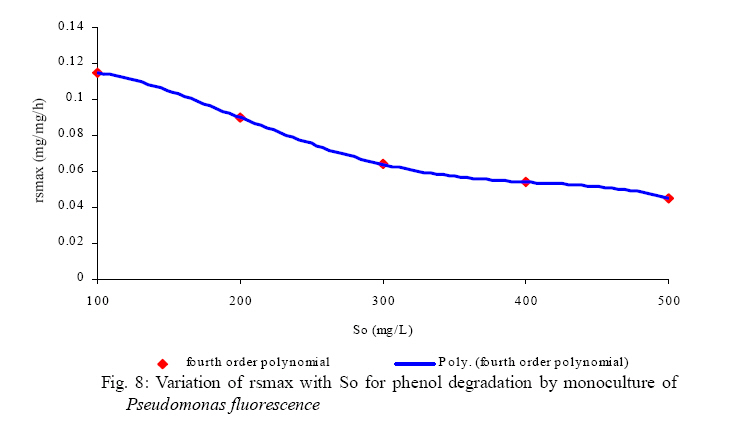
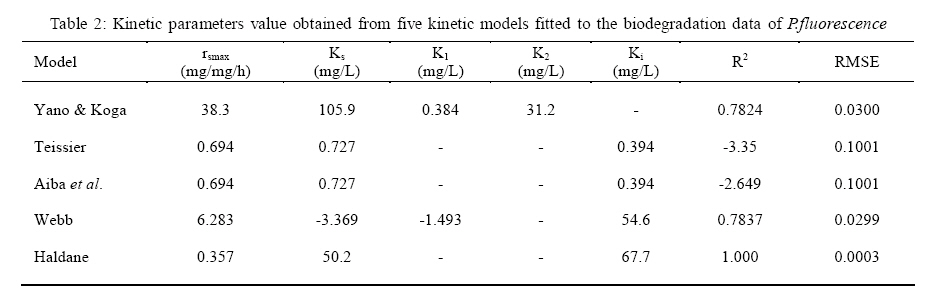
International Journal of Enviornmental Science and Technology, Vol. 5, No. 2, Spring 2008, pp. 223-232 Kinetics of batch microbial degradation of phenols by indigenous Pseudomonas fluorescence 1*S. E. Agarry; 2B. O. Solomon 1Biochemical Engineering Research Unit, Department of Chemical Engineering, Ladoke Akintola University of Technology, Ogbomoso, Nigeria Received 9 November 2007; revised 28 December 2007; accepted 19 January 2008; available online 10 March 2008 Code Number: st08026 ABSTRACT The potential of various organisms to metabolize organic compounds has been observed to be a potentially effective means in disposing of hazardous and toxic wastes. Phenols and their compounds have long been recognized as one of the most recalcitrant and persistent organic chemicals in the environment. The bioremediation potential of an indigenous Pseudomonas fluorescence was studied in batch culture using synthetic phenol in water in the concentration range of (100 -500) mg/L as a model limiting substrate. The effect of initial phenol concentration on the degradation process was investigated. Phenol was completely degraded at different cultivation times for the different initial phenol concentrations. Increasing the initial phenol concentration from 100 mg/L to 500 mg/L increased the lag phase from 0 to 66 h and correspondingly prolonged the degradation process from 84 h to 354 h. There was decrease in biodegradation rate as initial phenol concentration increased. Fitting data into Monod kinetic model showed the inhibition effect of phenol The kinetic parameters have been estimated up to initial phenol concentration of 500 mg/ L. The r smax decreased and K s increased with higher concentration of phenol. The rsmax has been found to be a strong function of initial phenol concentration. The culture followed substrate inhibition kinetics and the specific phenol consumption rates were fitted to Haldane, Yano and Koga, Aiba et al., Teissier and Webb models. Between the five inhibition models, the Haldane model was found to give the best fit. Therefore, the biokinetic constants estimated using these models showed good potential of the Pseudomonas fluorescence and the possibility of using it in bioremediation of phenol waste effluents. Key words: Biodegradation, kinetic model, batch cultivation, bioreactor, concentration INTRODUCTION Phenol and its derivatives is the basic structural unit in a wide variety of synthetic organic compounds (Annadurai et al., 2000). It is an organic, aromatic compound that occurs naturally in the environment (Prpich and Daugulis, 2005), but is more commonly produced artificially from industrial activities such as petroleum processing, plastic manufacturing, resin production, pesticide production, steel manufacturing and the production of paints and varnish (Mahadevaswamy et al., 1997; Bandyopadhyay et al., 1998). This aromatic compound is water-soluble and highly mobile(Collinsand Daugulis, 1997) and assuch waste waters generated from these industrial activities contain high concentrations of phenolic compounds (Chang et al.,1998) which eventuallymay reach down to streams, rivers, lakes, and soil, which represent a serious ecological problem due to their widespread use and occurrence throughout the environment (Fava et al., 1995). Phenol is a listed priority pollutant by the U.S.Environmental ProtectionAgency(EPA, 1979) and is considered to be a toxic compound by the Agency for Toxic substances and Disease Registry (ATSDR, 2003). The adverse effects of phenol on health are well documented (Calabrese and Kenyon, 1991) and death among adults has been reported with ingestion of phenol ranging from 1 to 32 g (Prpich and Daugulis, 2005). The low volatility of phenol and its affinity for water make oral consumption of contaminated water the greatest risk to humans (Prpich and Daugulis, 2005). A variety of techniques involving physical, chemical and biological methods have been used for the removal of phenol from industrial effluents and contaminated waters with bioremediation receiving the most attention due to its environmental friendliness, its, ability to completely mineralize toxic organic compounds and of low-cost (Kobayashi and Rittman, 1982; Prpich and Daugulis, 2005). Microbial degradation of phenol with different initial concentrations ranging from 50-2000 mg/L have been actively studied using shake flask, fluidized-bed reactor, continuous stirred tank bioreactor, multistage bubble column reactor, air-lift fermenter and two phase partitioning bioreactor methods (Bettmann and Rehm, 1984; Sokol, 1988; Annadurai et al., 2000; Reardon et al., 2000; Ruiz-ordaz et al., 2001; Oboirien et al., 2005; Prpich and Daugulis, 2005; Saravanan et al., 2008) and these studies have shown that phenol can be aerobically degraded by wide variety of fungi and bacteria cultures such as Candida tropicalis (Ruiz-ordaz et al., 2001, Chang et al., 1998; Ruiz-ordaz et al., 1998); Acinetobacter calcoaceticus (Paller et al., 1995); Alcaligenes eutrophus (Hughes et al., 1984; Leonard and Lindley, 1998); Pseudomonas putida (Hill and Robinson, 1975; Kotturi et al., 1991; Nikakhtari and Hill, 2006); and Burkholderia cepacia G4 (Folsom et al.,1990 , Solomon et al.,1994). In microbial degradation of phenol under aerobic conditions, the degradation isinitiated byoxygenation in which the aromatic ring is initially monohydroxylated by a mono oxygenase phenol hydroxylase at a position ortho to the pre-existing hydroxyl group to form catechol. This is the main intermediate resulting from metabolism of phenol by different microbial strains. Depending on the type of strain, the catechol then undergoes a ring cleavage which can occur either at the ortho position thus initiating the ortho pathway that leads to the formation of succinyl Co-A and acetyl Co-A or at the meta position thus initiating the metapathway that leads to the formation of pyruvate and acetaldehyde. Feist ands Hegeman (1969), Hill and Robinson (1975) and Leonard and Lindley (1998) have described the biodegradation or metabolism of phenol by Pseudomonas putida, Pseudomonas cepacia, and Alcaligenes eutrophus respectively via the meta cleavage pathway; while, Paller et al. (1995) described the biodegradation of phenol by Acinetobacter calcoacetium via the ortho cleavage pathway. The meta cleavage pathway for the biodegradation of phenol as presented byFeist and Hegeman (1969) is as shown in Fig. 1. A variety of kinetic substrate utilization and inhibition models have been used to describe the dynamics of microbial growth on phenol. Of these various models, the Monod and Andrew (Haldane) equations has been extensively used to describe phenol biodegradation (Bandyopadhyay et al., 1998; Reardon et al., 2000; Oboirien et al., 2005). The Monod (1949) and Haldane (Andrew, 1968) equations are based on the specific growth rate, but may also be related to the specific substrate consumption rate (Edwards, 1970; Solomon et al., 1994). Other kinetic models have been propagated. Sokol (1988) has reported a better fit for a modified Monod-Haldane equation while Schroeder et al. (1997) have shown a better fit for Yano and Koga equation amongst the tested inhibition models. In spite of the rather extensive use of phenol biodegradation processes, surprisingly, little work has been published on phenol microbial degradation kinetics based on specific substrate consumption rate using pure or mixed cultural systems. The objective of this present study was to investigate the degradation potential of an indigenous (local isolates) Pseudomonas fluorescence isolated from an oil-polluted area in Niger-Delta region of Nigeria and the effect of initial phenol (substrate) concentration on its degradation ability. MATERIALS AND METHODS The microorganism Pseudomonas fluorescence being an indigenous strain isolated from an oil-polluted area in Niger-Delta region of Nigeria was procured from the Department of Microbiology, Obafemi Awolowo University, Ile-Ife, Nigeria. The microorganism was maintained on nutrient agar slant and stored at 4 oC± 1oC for further use. The mineral salt medium used was modified from the one suggested by Bettman and Rehm (1984). The medium had the following composition per litre : 700 mL deionized water, 100 mLbuffer solutionA, 100 mL solution B, 50 mL solution C and 50 mL solution D. Compositions of each solution were as follows : Buffer solution A composition K2 HPO4 1.0g , KH2PO4 0.5g , (NH4)2SO4 0.5g , deionized water 100ml. Trace element solution B composition NaCl 0.5g , CaCl2 0.02g , MnSO4 0.02g , CuSO4.5H2O 0.02g , H3 BO3 0.01g , deionized water 50ml. Solution C composition MgSO4.7H2O 0.5g , deionized water 50 mL , Solution D composition FeSO4 0.02g , Molybdenum powder 0.02g, deionized water 50 mL. To prevent the precipitation of CaSO4 and MgSO4 in storage, the water, buffer solution A; trace elements solution B, solution C and solution D were autoclaved at 121oC for 15 min. After cooling, all the solutions were then mixed together and kept as stock solution from which known quantities were taken for the cultivation of the microorganisms. A primary culture was prepared by transferring two loops full of microorganisms from an agar slant culture into 100 mL of feed medium containing 20 mL of mineral salt medium and 80 mL of 50 mg phenol solution in a 250 mL Erlenmeyer conical flask. This was then incubated in a NewBrunwick gyratory shaker (G25-R model, N.J. U.S.A) for 48 h at a temperature of 30 oC and agitated with a speed of 120 rpm. Thereafter, 10 mL ofthe primary culture was transferred into another 100 mL of feed medium in a 250 mL Erlenmeyer conical flask and the incubation process was repeated. This was the secondary culture that was used as the inoculums for the degradation studies as this ensures that the organisms had fully adapted to growth on the phenol as sole source of carbon and energy. The experimental studies were carried out in a NewBrunswick Microferm Twin Bioreactor (PH -22 model, N.J., U.S.A) with 4 litres working volume. 800 mL of the autoclaved mineral salt medium and 3 L of phenol solution (100 mg/L) were measured into the bioreactor vessel and 200 mL of the inoculums was introduced aseptically to make up 4 litres of working volume. The bioreactor was operated for several hours at a temperature of 30 oC, aeration rate of 3.0 vvm and agitation of 300 rpm. Samples were withdrawn at every 6 h for biomass and phenol analysis. This was done in duplicate and average values were used. The undegraded phenol was estimated quantitatively by measuring its absorbance at 510 nm wavelength using UV -Visible Spectrophotometer (Lambda 35, Perkin-Elmer, USA) and 4 -amino antipyrene as color indicator (Yang and Humphrey, 1975). The biomass concentration was estimated using the dry weight method. 50 mL sample of culture broth was withdrawn from the bioreactor and centrifuged (Gallenkamp centrifuge) at 4000 rpm for 20 min in plastic centrifuge tubes. The supernatant was decanted into small bottles and stored at 4 oC for subsequent phenol estimation. The pellets was resuspended in de-ionized water and re-centrifuged. The supernatant was decanted and pellets rinsed off from the tube into a pre-weighed 1.2 µm pore filter paper (Whatman GF/C). The filter paper saw then dried in an oven at 105 oC for between 12-24 h, cooled in a dessicator at room temperature and re-weighed until a constant dry weight was obtained. The difference between the pre-weighed filter paper and the second weight was used to estimate the dry weight of the biomass. RESULTS AND DISCUSSION Five batch cultivation experiments were carried out using phenol as single limiting substrate for Pseudomonas fluorescence. Different initial phenol concentrations of 100 mg/L to 500 mg/L were used. The extent of phenol degradation using these different initial phenol concentrations was investigated for several batch residence times by intermittent sampling. Fig. 2, 3, 4, 5, 6 shows the biodegradation potential of the indigenous P.fluorescence in degrading synthetic phenol waste in the concentration range of 100 mg/L to 500 mg/L. Since the degradation proceeds with biomass (cell mass) growth, the Figure also depicts the typical cell growth curve. The cell growth curve has typical exponential and stationary phases with increasing lag phase. It could be seen from Fig. 2, 3, 4, 5, 6that the different initial phenol concentrations ranging from (100 - 500) mg/L were completely degraded (consumed) at different residence time of 84 h, 120 h, 168 h, 252 h, 354 h, and during these times the biomass correspondingly increased to a maximum of 37 mg/L, 101 mg/L, 213 mg/L, 274 mg/L, and 362 mg/L respectively. No lag phase was observed for initial phenol concentration of 100 mg/L as shown in Fig. 2. However, for initial phenol concentration of (200, 300, 400, and 500) mg/L corresponding lag phase of 6 h, 18 h, 24 h and 66 h was observed respectively as shown in Fig. 3, 4, 5, 6. Moreover, it was observed that after the complete degradation or conversion of the different initial phenol concentrations, there was further increase of the biomass at each initial concentration of phenol. This increase may be due to the fact that the added phenol was converted to unknown intermediates that were later consumed. A similar observation has been reported for the isolates of Pseudomonas and Acinetobacter grown on phenol (Hao et al., 2002; Saez and Rittman, 1991; Prpich and Daugulis, 2005). As shown in Fig. 2, 3, 4, 5, 6, which indicate the comparison of the time course for phenol substrate consumption of all the five batches, it is evident that the rate of degradation decreased with increase in the initial phenol concentration. Bandyopadhyay et al. (1998) and Ruizordaz et al. (2001) reported a similar observation on Pseudomonas putida and Candida tropicalis grown on phenol, respectively. Thus, it is observed that as the initial phenol concentration increased the duration of the lag phase increased; and thereby, prolonging the biodegradation time as a result of decrease in the rate of degradation. This observation is supported by the earlier worksofAndrews(1968), Hill and Robinson (1975), Collins and Daugulis (1997), and Oboirien et al. (2005). According to Prpich and Daugulis (2005), the rate of substrate consumption was suggested to be the most important measure of microbe performance. Zilli et al. (1993) gave a similar report. Relativelyvery few data exists in the literature on this parameter. Most of the data available concerns specific growth rate. It was on this basis that the specific phenol (substrate) consumption rate was calculated and plotted against phenol concentration as shown in Fig. 7. As seen from Fig. 7, the specific phenol consumption rate (rs) decreased as the phenol concentration (S) decreased for each of the different initial phenol concentrations Therefore, it seems that there is also an influence of the initial phenol concentration on the specific phenol consumption rate. Hinteregger et al. (1992) and Abd-El Hameidshalaby (2003) reported a similar observation According to Layokun et al. (1987) the growth of microorganisms corresponds to the degradation (consumption) of the substrate. Hence, the growth of microorganisms on phenol can be described by the most commonly used kinetic models that can be based on specific substrate consumption rate as proposed by Posten (Solomon et al., 1994) and which have been used by Zilli et al. (1993) and Schroeder et al. (1997). In this work, phenol was completely degraded and kinetic model of Monod (1949) based on specific substrate consumption rate was used to evaluate the degradation of phenol at different initial concentration by the indigenous P. fluorescence. The classical method of obtaining kinetic parameters (constants) is to linearize kinetic models. Recently, non-linear least squares computer fitting of data to model equations has been used (Schroeder et al., 1997; Reardon et al., 2000; Saravanan et al., 2008). The non-linear least square fitting routine of MATLAB 6.5 software package was used to fit the Monod kinetic model to the different batch experimental data. The parameters of Monod (Ks and r smax) was fitted to the experimental calculated specific phenol consumption rate and the corresponding phenol concentration under the constraint that r never exceeds the maximum obtainable specific consumption rate(rsmax ) and the results are presented in Table 1. As seen from the Table, the Monod parameters (rsmax and K s) show a definite trend of variation. The rsmax decreased and K s increased as the initial phenol concentration increased. Considering the fact that K s is inversely related to the affinity of the microbial system for the substrate (Pirt, 1975), this increase of K s corresponds to a decrease in affinity of the bacteria (P. fluorescence) for phenol. It is therefore evident that inhibition becomes prominent as initial phenol concentration increased. Thus, the rsmax is a strong function of initial phenol concentration (So) The variation of r smax with S o has been indicated in Fig. 8 and also fitted by the fourth order polynomial fit from which r smax at any value of So within the range of 100500 mg/L of phenol concentration may be predicted. However, the observation of substrate inhibition due to phenol can be modeled using substrate inhibition models described in literature (Schroeder et al., 1997). The experimental results of specific phenol consumption rate variation with initial phenol concentration was fitted to five inhibition models of Haldane (Andrew, 1968), Yano and Koga (1969), Aiba et al. (1968), Teissier (Edwards, 1970), and Webb (Edwards, 1970). The model with the best fit was selected on the basis of highest correlation coefficient (R2) and the least root mean square error (RMSE). The kinetic parameters of the models (rsmax , Ks and Ki ) were estimated using the non – linear regression routine of MATLAB 6.5, and the results along with the R2 and RMSE are given in Table 2. The results revealed that between the five models, Haldane has a correlation coefficient (R2) greater than 0.90 and the least root mean square error (RMSE = 0.0003 ), and thus, indicating a very good fit to the batch experimental data. In this work, the biodegradation potential of phenol by Pseudomonas fluorescence has been examined. It was shown that the organism completely degraded phenol up to a maximum concentration of 500 mg/L in mineral salt medium, and that, initial phenol concentration has effect on the rate of degradation. The higher the initial phenol concentration, the longer is the lag phase of the culture, and the lower the rate of degradation; thus, the slower the biodegradation becomes. The culture followed substrate inhibition kinetics as indicated by the kinetic parameters value of Monod model equation, in which rsmax decreased and Ks increased, as initial phenol concentration increased. Thus, the experimental batch biodegradation data was fitted to Haldane, Yano and Koga, Aiba et al., Teissier, and Webb, substrate inhibition models. It was shown that of all the models, the Haldane model represent the biodegradation data reasonably very well, and hence, may be proposed as the best model to describe the phenol biodegradation behaviour of P. fluorescence. The performance of this indigenous P. fluorescence is being compared with well-known effective degraders of phenol with emphasis on maximum specific substrate consumption rate. Reported values of the maximum specific substrate consumption rate (rsmax) varied from 0.001 to 2.6 hr-1 (Folsom et al., 1990; Zilli et al., 1993; Schroeder et al., 1997). Folsom et al. (1990) and Schroeder et al. (1997) reported an rsmax value of 2.6 hr-1 and 0.4 hr-1 for Pseudomonas cepacia G4 respectively. While, Zilli et al. (1993) reported a value of 0.0016/h for Pseudomonas putida NCIMB 10015. The rsmax value of 0.357 mg/mg/h for P. fluorescence was relatively comparable to that of Pseudomonas cepacia G4 (rsmax = 0.4/h), however greater than that of P. putida NCIMB 10015. In conclusion, the biokinetic constants evaluated using the models showed good tolerance and growth of the indigenous organism, and therefore, a complete degradation of the phenol substrate. The performance of the indigenous strain in biodegradation of phenol in the nutrient medium is good. ACKNOWLEDGMENTS The author wishes to thank Professor B. O. Solomon for his useful suggestions, encouragement and supervision of this work. B. O. Solomon wish to express his sincere thanks to the International Foundation for Science (IFS) for the financial support used for the procurement of all the chemicals needed for this work. Nomenclature Ks Half-saturation constant (mg/L) Ki Inhibition constant (mg/L) rs Specific phenol (substrate) consumption rate (mg/mg/h.) rsmax Maximum specific phenol (substrate) consumption rate (mg/mg/h.) S, Cs Substrate (phenol) concentration (mg/L)
REFERENCES
© IRSEN, CEERS, IAU The following images related to this document are available:Photo images[st08026t1.jpg] [st08026t2.jpg] [st08026f5.jpg] [st08026f3.jpg] [st08026f7.jpg] [st08026f1.jpg] [st08026f6.jpg] [st08026f4.jpg] [st08026f2.jpg] [st08026f8.jpg] |
| |||||||||

