 |
| About Bioline | All Journals | Testimonials | Membership | News |
|
||||||
|
||||||
International Journal of Enviornmental Science and Technology, Vol. 5, No. 2, Spring 2008, pp. 251-262 Application of an environmentally optimum cooling water system design to water and energy conservation M. H. Panjeshahi; *A. Ataei Department of Energy Engineering, Graduate School of the Environment and Energy, Science and Research Campus, Islamic Azad University, Tehran, Iran
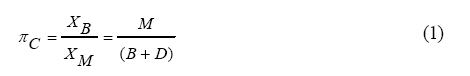
Received 23 September 2007; revised 18 October 2007; accepted 29 February 2008; available online 10 March 2008 Code Number: st08029 ABSTRACT Recirculating cooling water systems are consist of a cooling tower and heat-exchanger network which conventionally have a parallel configuration. However, reuse of water between different cooling duties enables cooling water networks to be designed with series arrangements. This will result in performance improvement and increased cooling tower capacity. Research on recirculating cooling water systems has mostly focused on the individual components. However, a particular design method represented by Kim and Smith accounts for the whole system interactions. In this study, the Kim and Smith design method is expanded and a comprehensive simulation model of recirculating cooling system was developed to account for the interaction between the cooling tower performance and the heat-exchanger network configuration. Regarding this model and considering cycle water quality through introducing ozone treatment technology, a modern methodology of recirculating cooling water system design was established and developed. This technique, called the integrated ozone treatment cooling system design, is a superior designed tool based on pinch analysis and mathematical programing. It also ensures maximum water and energy conservation, minimum cost and environmental impacts. Related coding in MATLAB version 7.3 was used for the illustrative example to get optimal values in cooling water design method computations. The result of the recently introduced design methodology was compared with the Kim and Smith design method. Key words: Environmental impacts,ozone treatment, pinch analysis, mathematical programing, heat-exchanger network INTRODUCTION Once-through cooling water systems and recirculating cooling water systems (RCWSs) are used for the rejection of waste heat to the environment. Of these methods, recirculating cooling water systems are the most common ones because of their important role in conserving fresh water and reducing thermal pollution compared to once-through systems (Kim et al., 2001). The process of cooling water system is that; cooling tower supplies the cooling water which goes throught a network of coolers, usually of parallel configuration. However, reuse of cooling water between different cooling duties enables cooling water networks to be designed with series arrangements. This allows better cooling tower performance and increases cooling tower capacity in the context of new design. In RCWS design, any possible changes in each system component should be predicted properly. To achieve this, directly interacted cycle components should be accounted simultaneously (Smith, 2005). Pinch technology, as the most common design tool, will be used. This technology is based on targeting prior to design and exploits conceptual understanding. Pinch technology in water system design has been developed through principle concepts to make opportunities for energy saving in process design, since it cannot be applied for energy conservational implications (Kim et al., 2001). Previous researches on RCWS focused on the cooling system components individually, not the system as a whole. However, a simultaneous integration of RCWS components provides opportunity to achieve the optimum design. Kim and Smith (2001) developed a systematic design methodology of RCWS, KSD method, which accounts for the interactions between the cooling tower and heat-exchanger network. This research has expanded the original design methodology (KSD). The KSD methodology allowed the minimum cooling water flow rate to be participated in the performance parameters calculation and network configuration design, considering fix approach value as the cooling tower design variable. However, the minimum cooling water flow rate through the fix approach value does not necessarily ensure niether optimum value, nor the minimum cost of system. Furthermore, their proposed cooling tower model is presented to demonstrate the existing interactions within the cooling water systems, whereas the presented cooling tower model accounts for water temperature only and is not sensitive to flow rate changes. However, for the cooling system design, a comprehensive model is needed to determine an optimum water flow rate and temperature, which are the interacting performance parameters, as well as cooling tower behavior prediction under the various conditions. Moreover, for water and energy conservation, a technique such as increasing the cycle of concentration is not considered in the cooling water system design method (Kim and Smith, 2001). To increase the cycle of concentration, cooling water quality should be considered as an important parameter. The objective of this study was to introduce and develop a modern methodology to RCWS design, regarding the interaction between cooling tower performance and the heat-exchanger network configuration, not the cooling system components individually. It considers any probable changes in RCWS components and regards the effect on the whole cycle, providing predicted conditions of the exiting air and water (Kim and Smith, 2001). The model leads to a modern design methodology which is called “integrated ozone treatment cooling system (IOTCS)”design which accounts for optimal heat-exchanger network configuration, maximum water and energy conservation and minimum cost. Integrating ozone treatment to cooling water system leads to a cost-effective and environment-friendlyRCWS design (Parker,1998). MATERIALS AND METHODS Water quality and its significance Water, as the main component of every cooling system, provides heat rejection opportunity for heatexchanger network. Thus, the quality of the cooling and make-up water needs to be considered not only to achieve an optimum operational condition, but also for reducing the negative environmental impacts. In a cooling system, eventually, the minerals reach a cycle of concentration that will cause loss of efficiency due to scale formation or damage due to excessive corrosion. To conserve water and treatment chemicals, it is desirable to allow the dissolved minerals to reach a maximum cycle of concentration. The cycle of concentration (π C ) is defined as the concentration ratio of a soluble component in the blow-down stream to that in the make-up stream (Heikkila and Milosavljevic, 2001).
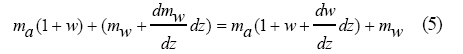
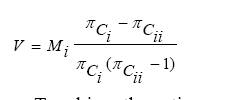
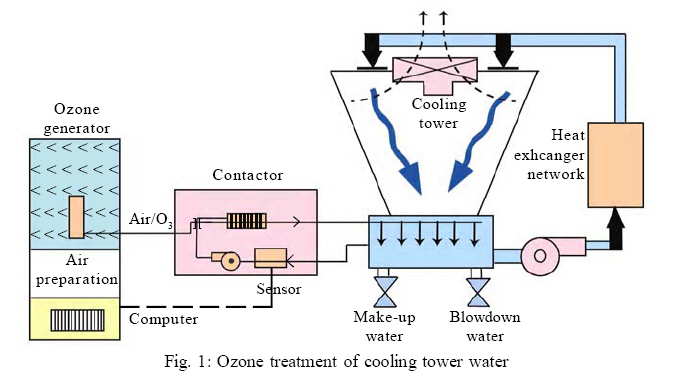
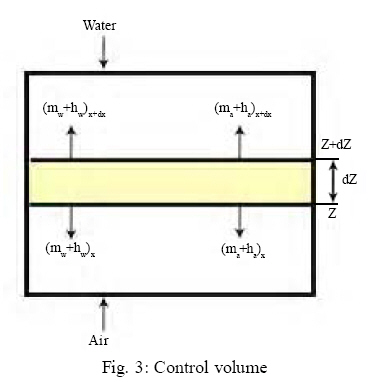
The concentration of contaminants should be managed to control biological growth, corrosion and scale build-up. The maximum cycle of concentration will depend on the quality of make-up water (Parker, 1998). Chemical, physical and biological treatment processes are used to improve the make-up water quality to solve the problems relevant to cooling water treatment, such as scale formation, corrosion and bacterial growth. Of all the methods, non-chemical treatment methods could be considered as safe and environmentally responsible methods for the use of make-up water. Magnetic and electro-magnetic, electrostatic, electrolysis, ozonation and hydrodynamic cavitations are some of these nonchemical treatments. Ozone water treatment Ozone (O3) has been recognized for nearly a century for its powerful ability to disinfect water. Cooling tower water must be treated to limit the growth of mineral and microbial deposits that can reduce the heat transfer efficiency of the cooling tower. The conditions in cooling towers can promote the growth of Legionella, which can exist in low concentrations in most water supply systems. Fig. 1 shows an integrated cooling tower with ozone water treatment unit (Parker, 1998). A cooling tower ozone treatment system compresses ambient air, then dries and ionizes it to produce ozone. The ozone is added to the circulating water in the tower to inactivate the infectious bacteria, algae and viruses in tower. Furthermore, microorganisms tend to accumulate in a bio-film on the sides and components of the cooling tower system, impeding heat transfer efficiency, increasing energy consumption (as the system has to work harder) and increasing maintenance costs. A frequent problem is the build-up of scale, mineral coatings that adhere especially well to the biofilm. Again the resulting build-up impedes system efficiency and could affect human health (Strittmetter, 2003). Conventional cooling tower water treatment technologies include treatment with chemicals to remove microorganisms and scale and the blow-down of water to remove impurities. These operations both add to the cost of cooling tower operation and maintenance (Conner, 2005). Integration of ozone water treatment with the recirculating cooling water system gathering the cycle of concentration which decreases the concentration of insoluble components in circulating water (Viera et al., 2000). It dramatically reduces the blow-down that, in turn, is environmentally constructive. Cooling water systems can be considered as energy conservation feeds opportunities (Alsheyab and Munoz, 2007). For maximizing water and energy conservation, ozone treatment should be integrated into the cooling tower. This also manages to drastic environment-friendly implications. The effect of ozone treatment integration on cooling system and IOTCS design is illustrated in the following example. During this research, an optimum cooling water system was designed to minimize the total cost while maximizing water and energy savings. To accomplish the objectives of this design, a cooling tower model was presented to predict the cooling tower performance parameters, water temperature and flow rate under various conditions provided by the heat-exchanger network. The model is then followed by the RCWS design, which is based on pinch analysis and mathematical programing. This designed model, called the “integrated ozone treatment cooling system (IOTCS)”, considers the cycle water quality by involving ozone treatment to the cooling water system. By using this method, an optimum heat-exchanger configuration was obtained by introducing a feasible area concerning the constraints that were dictated through the whole cooling system and exploring the optimum water supply line regarding minimum total annual cost. The optimization model was based on a relaxed approach value which considered the defined feasible region to accomplish the optimum water supply line and cost-effective heat-exchanger configuration. Mathematical modeling of cooling tower To determine the interactions within the cooling system, RCWS modeling was introduced. The model includes RCWS components for an accurate prediction of the exiting air and water condition. In the presented mathematical modeling, a counter-current contact cooling tower with mechanical air draft was assumed. The presented new mathematical model accounts for a reliable representation of air water conditions. Fig. 2 shows the process input and output and the energy and mass balances for make-up and blow-down as follows (Castro et al., 2000): F0 = F1 - B + M (2) F0T0 = (F1 - B)T1 + MTM (3) The overall heat load of the cooling water network was also needed to determine the desired heat removal of the cooling tower (Fisenko et al., 2004): QHEN = F2CP (T2 - T0) (4) Considering an elementary control volume in the fill or packing of a counter-flow, i.e. wet cooling tower (Fig. 3), mass balance for the control volume yields (Kröger, 2002):
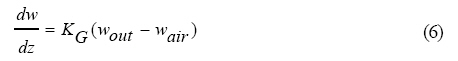
Humidity ratio changes along the cooling tower height:
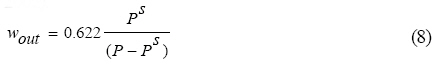
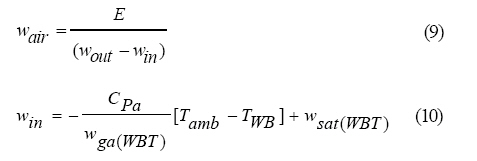
where, KG is the mass transfer coefficient of air (Kloppers and Kröger, 2005a). Several experimental measurements on heat and mass transfer coefficient in cooling towers have already been made. In air-water systems, the result is represented as a function of air and water flow rate (Smith, 2005): KG = a1mbamcw (7) where, wair is the humidity ratio of air and wout refers to the humidity ratio of the interface (Hasan and Siren, 2002).
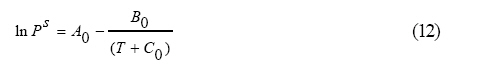
That wga(T) is defined as below (Mann and Liu, 1999): wga(T) = 2501.3 + 1.82T (11) It is assumed that the air leaves the tower at the saturation condition (Kloppers and Kröger, 2005b). The Ps is saturated pressure in Pascal (water vapor pressure at outlet air temperature given by the average of the inlet and outlet temperature of water) as per in Antoine equation (Heikkila and Milosavljevic, 2001):
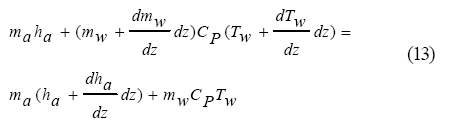
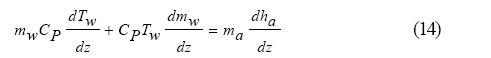
The coefficients of the above equation are presented as follows (Kim and Smith, 2001): For 0°C < T< 57°C, A0 = 23.7093, B0 = 4111, C0 = 237.7 The energy balance on control volume is:
Neglecting the second order terms of equation (13) simplifies to:
By substituting equation (5) with equation (6):
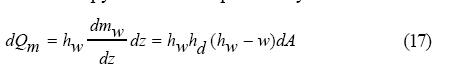
The total enthalpy transfer at the air-water interface consists of an enthalpy transfer associated with the mass transfer due to the difference in vapor concentration and the heat transfer due to the difference in temperature (Kröger, 2002): dQ = dQm + dQC (16) The enthalpy transfer is expressed by:
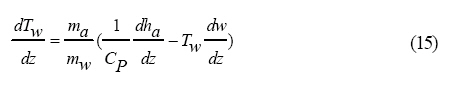
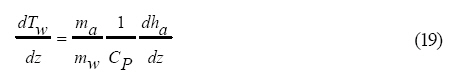
The convective transfer of sensible heat at the interface is given by Kloppers and Kröger (2004): dQC = hd (Tw - Ta )dA (18) Water temperature drops along the cooling tower height which can be expressed as follows (Hollands, 2003):
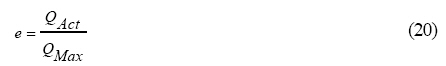
The cooling tower effectiveness (e) is defined as the ratio of actual heat removal to the maximum achievable heat removal (Khan et al., 2004). The high effectiveness of cooling tower represents better cooling performance and high heat removal. Effectiveness is presented through the following expression (Khan et al., 2003):
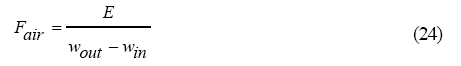
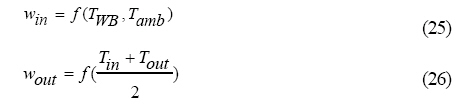
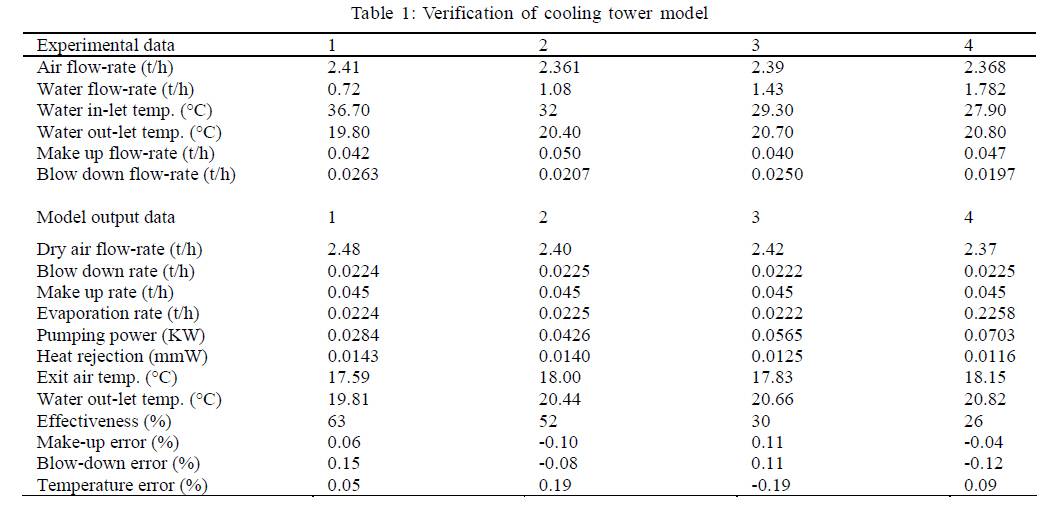
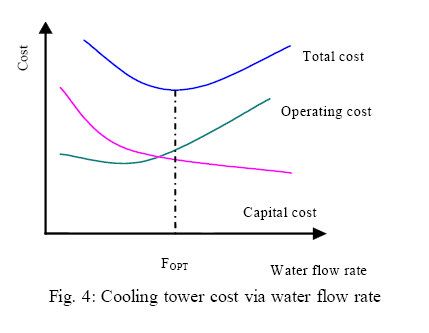
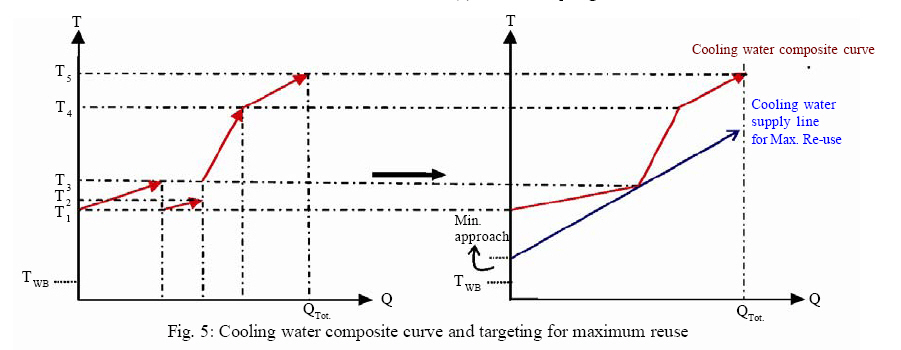
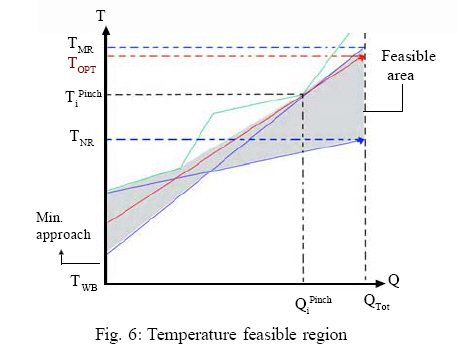
The outlet cooling water temperature, flow rate and evaporation ratio are all functions of tower air flow rate, wet bulb temperature, inlet water temperature and the flow rate (Khan and Zubair, 2004). The effect of each parameter, namely temperature difference along cooling tower (R) and flow rate (Fin), should be examined to achieve the optimum point. The result of the cooling tower modeling shows that decreasing the water flow rate of the cooling tower has a more significant effect on the effectiveness than decreasing the inlet temperature. To verify the results of the proposed model, the simulation results were compared with the experimental data (Table 1) (Bernier, 1994). The results shown in Table 1 demonstrates that when the cooling water inlet conditions are in high temperature and low flow rate, the cooling tower effectiveness increases, which indicates more heat removal from cooling tower will occur, that is, in such conditions, cooling tower obtains a lower cooling water outlet temperature. In the verification stage of the model, it was observed that the cooling tower model, used for the design of cooling water system, is accurate enough to evaluate the tower performance and predict the effectiveness of the cooling tower system. Objective function In design targeting, the objective is to minimize the total annual cost (Kim et al., 2001). Consequently, the defined objective function of the introduced design methodology was to determine total annual cost of the cooling tower including operational and capital cost (Kaiser et al., 2005). The capital cost of cooling tower is as follows: CC = 746749 (Fin) 0.79 (R) 0.57 (A) - 0.9924 (0.22TWB + 0.39) 2.447 (21) As shown in equation (21), the capital cost in $/y, including chemical engineering index and annualisation factor, a function of water flow rate in t/h. The approach, range and wet bulb temperature are in ºC. The operating cost of cooling tower: pumping cost + fan cost + make-up cost + chemical treatment cost + blow-down treatment cost OC = 2.4094 × 10 -3(PP) + 44(Fair ) + 110(Fin ) + 2275.132(M ) + 1138(B) (22) The operation cost includes the terms “cooling water pumping cost”, “air fan operation cost”, “make-up water cost”, “cycle cooling water chemical treatment” and “blow-down treatment cost”. For the water pumping cost, the terms “pumping power”, “electricity cost coefficient” and “conversion factor” are considered in the model. Air fan operation cost depends on air flow rate, electricity cost coefficient and related conversion factor. Make-up water cost is a function of water flow rate. Cooling water treatment cost also varies according to flow rate. Operating cost consists of blowdown treatment cost as well. As a matter of fact, the cooling tower wastewater should be treated to meet the environmental standard specification. The cost of blow-down treatment depends on the amount of blowdown flow rate and the cost coefficient. Ultimately, the objective function is defined as the total annual cost. The optimization problem can be stated as follows: Min TC =CC + OC (23) The operating cost and capital cost of the cooling tower differently affect the overall cost of cooling water systems, as shown in Fig. 4. The problem of targeting cooling water systems becomes an optimization problem to search for the optimal cooling line. Model constraints To establish the model constraints, first, the cooling water composite curve should be drawn. Cooling water streams depend on the heat load and the temperatures were graphed. All the cold streams are then summed up to figure out the composite curve (Smith, 2005). The cooling water supply line is shown for the maximum reuse of water, which means the possible series configuration of heat-exchangers. Fig. 5 shows the procedure for the composite curve graph and the targets for the maximum reuse of water flow rate. The point where the target supply line touches with the composite curve creates a pinch point. The interpretation of the pinch does not imply zero driving force for the heat transfer, but it is only a minimum driving force. Upon introducing constraints, the pinch point that will not cross the composite curve should be considered. The cooling tower cannot operate at temperatures above a specific water temperature due to operational problems related to cooling tower performance, such as packing decomposition. Therefore, temperature constraints should be imposed on the model. Fig. 6 shows the feasible region for cooling water systems, using the optimum cooling target line located between two limits. One limit is the minimum flow rate target and the other is the maximum flow rate target line, representing a parallel configuration. The slope and inlet/outlet temperature of the target cooling line are limited by the temperature conditions and the composite curve. It should be considered that for maximum water reuse cooling supply line construction, i.e. a minimum approach (TMA), is necessary. The air flow rate is expressed in the following expression (Deng and Tan, 2003):
That inlet and outlet humidity ratios are both functions of temperature:
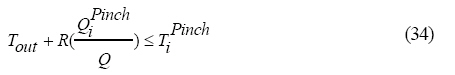
The evaporation rate is a function of water flow rate and temperature difference of cooling tower (Kim et al., 2001): E = 0.001 53( Fin )( R ) (27) The heat load of cooling system is: QHEN = FinCP (Tin - Tout ) (28) The design variables for the cooling tower construction are usually temperature range, approach temperature and water flow rate (Pascal and Marchio, 2003). The approach is more important than the flow rate and the range in achieving a high driving force for cooling. This is because the driving force becomes more limiting as the approach becomes narrow. Since cooling performance is influenced by the water flow rate as well as other factors, a cooling water system should be targeted by considering the effect of tower performance on cooling cost (Kloppers and Kröger, 2005c). Range definition: R = Tin - Tout (29) Approach definition: A = Tout - TWB (30) Feasibility constraint on the inlet and outlet temperatures of cooling tower is: TNR ≤ Tin≤ Min {TMR,TTL} (31) Cooling tower water outlet temperature varies between minimum approach value, considering wet bulb temperature and the minimum temperature of water stream at heat-exchanger network: (TWB + TMA) ≤ Tout≤TMN (32) Here, TMN is the minimum temperature of heatexchanger network with respect to ΔTmin of the network and TMA is the minimum cooling tower approach. TMN = THENMin -ΔTmin (33) The feasible area for the inlet temperature of cooling tower is constructed as the region between non-reuse of water at the heat-exchanger network, which is synonymous to a totally parallel configuration and maximum water reuse temperature considering cooling tower packing limitation (Qureishi and Zubair, 2006). In order to define the upper inlet temperature boundary, the minimum value between TMR and TTL (temperature limitation), that is determining by the tower packing type, should be selected. The analysis for optimization of the process ensures that the optimum water supply line temperature does not violate the temperature limitation. In order to reach a desired outlet temperature, a minimum approach for the wet bulb temperature of the ambient and the network minimum hot stream temperature should be taken into consideration, regarding the pinch point (Smith, 2005). Feasibility constraints to avoid pinch crossing is:
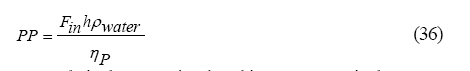
Feasibility constraints on the cooling water flow rate is: F lin ≤ Fin≤ Fuin (35) F lin and F uinare the upper and lower limits of the water flow rate which are expressed at water temperature feasibility area of cooling tower. Pumping power is a function of water flow rate and can be calculated as the following equation:
Here, h is the pumping head in m, ρwater is the water density in Kg/m3 and ηP is the pumping efficiency. Blow-down and make-up which are functions of evaporation are calculated as below:
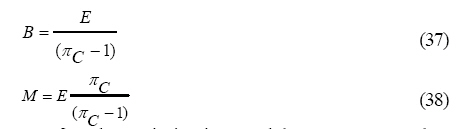
After the optimization model was constructed, a proper method was used to optimize the performance parameters with respect to the environmental criteria, energysaving target and minimumcost. Thepresented optimization model, which was constructed using MATLAB was accounted for the optimum water supply line and minimum cost. The optimum water supply line was achieved using the recently presented model, while considering the feasibility definition constraints to obtain optimal performance parameters. An illustrative example is presented to apply the IOTCS design technique to demonstrate the cost-effective optimal configuration of the heat-exchanger network. The result of a different design methodology was demonstrated for comparison. RESULTS AND DISCUSSION Illustrative example of IOTCS In this work, a cooling water system using IOTCS with an optimum network configuration was designed. An analysis for minimizing the total cost and conservation of energy was performed. The process stream data is given in Table 2. The following parameters were used for the illustrative example: The wet bulb temperature of air is 15 ºC, ambient air temperature, 25 ºC, minimum approach temperature, 5 ºC, pump efficiency, 60%, pumping head, 10.67 m, operating time, 8600 h/y, interest rate, 15%, payback period, 3 y,∆Tmin,10 ºC and temperature limitation, 57ºC. Most cooling water design methodologies achieve a cycle concentration of 3. However, using IOTCS design, it increases the cycle of concentration up to 15, which will result in water conservation. Theoretically, 46% saving in water usage can be obtained using the following equation (Prasad, 2004):
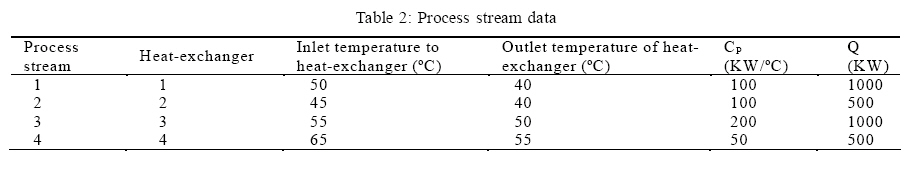
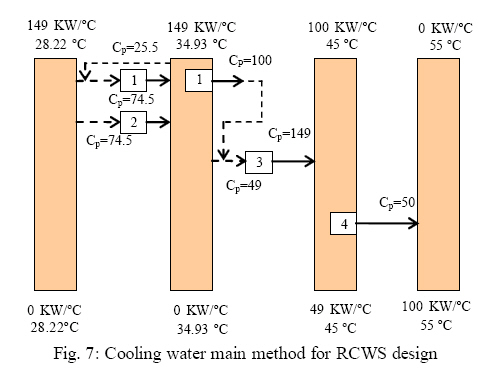
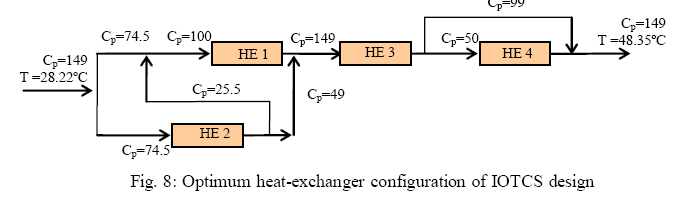
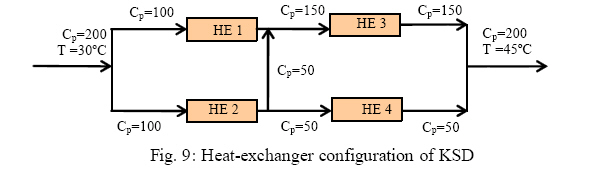
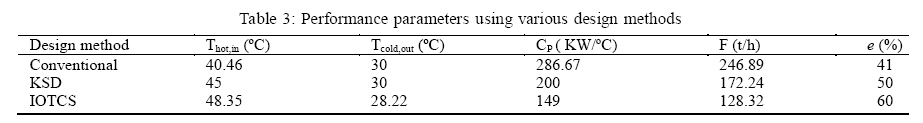
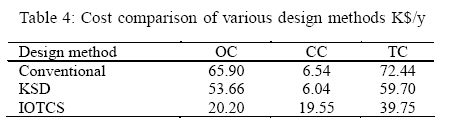
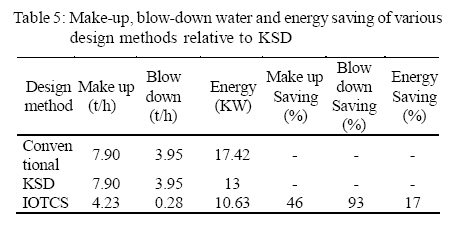
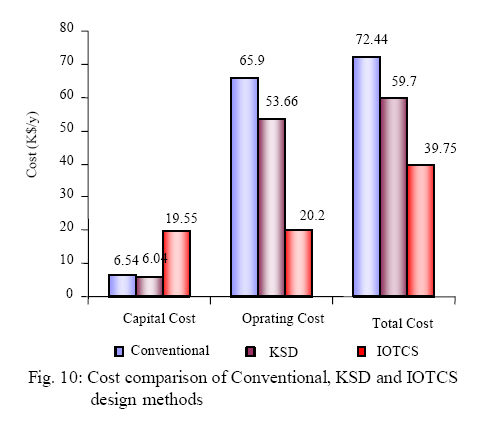
To achieve the optimum performance parameters of the cooling system, the cooling tower total annual cost function, capital and operational investments, including the blow-down and ozone water treatment cost, was solved to achieve the minimum value as possible. In order to obtain optimum parameters, advanced synthesis algorithm was used and consequently an optimal heat-exchanger configuration was achieved. operating cost of IOTCS = fan cost + pumping cost + blow-down treatment cost + make-up water cost + ozone water treatment cost capital Cost of IOTCS = cooling tower capital cost + ozone water treatment capital cost The ozone treatment operational cost is included of ozone electricity cost in $/y and conversion factor. The capital cost of ozone water treatment is a function of water flow rate and can be expressed as follows (Parker, 1998): ozone capital cost = 24.43 (Fin) + 104 (40) ozone electricity cost = 24.43 (Fin) (41) The inlet water flow rate is in T/h. The synthesis algorithm by setting up the water mains at water supply temperature, pinch points temperatures and exit temperature (Fig. 7) was used for developing an optimal heat-exchangers network configuration (Fig. 8) (Mann and Liu, 1999). This synthesis algorithm was based on the composite curve decomposition and water main method. The water main method of Kuo and Smith (1997) for the design of water reuse networks can be extended to the design of cooling water networks. The original method identified water reuse opportunities for problems in which reuse was constrained by concentration limits. This method was carried out in four steps. The first step was to generate a grid diagram with cooling water mains and plot the cooling water using operations as shown in Fig. 7. The second stage was to connect the operations with cooling water mains. The third stage was to merge operations that cross mains. The final stage was to remove intermediate (pinch) cooling water mains. Following the method allows the design of the cooling water network to achieve the target predicted by the supply line. Details of the procedure are given by Kuo and Smith (1997) and readily adapted to the concentration constraints in the original paper to the temperature constraints that are a feature of the cooling water network design problem. In order to achieve an optimum water supply line in the feasible region, using a limiting profile, which is defined from either pinch point or cooling tower temperature limitation, was considered as a guide that represents the boundary between feasible and infeasible operation. The optimum design construction and optimum heat-exchanger configuration were then accomplished considering the maximum water reuse profile and water pinch synthesis (Fig. 8). As Fig. 8 is shown, the optimum configuration achieved through IOTCS design methodology provides more series arrangement opportunities in comparison with the KSD method (Fig. 9). Table 3 shows the optimum water flow rate and temperature of cooling water system, using IOTCS design. Table 4 illustrates that IOTCS obtains the minimum total cost achievable in comparison with the KSD design methodology. By integrating ozone water treatment and constraint identification, and in search for the optimum arrangement, the cost analysis results of the total parallel configuration (Conventional design) KSD and IOTCS are demonstrated in Table 4. Table 5 shows the water and energy saving processes in both the design methods of KSD and IOTCS. As shown in Table 5, the IOTCS design method resulted in a 17% energy saving relative to the KSD method. Fig. 10 shows the cost comparison of conventional, KSD and IOTCS design methods. As the presented illustrative example indicates, the results show that the total cost of the IOTCS design method resulted in the total cost of 39.75 K$/y as compared to the KSD total cost of 59.70 K$/y and 72.44 K$/y for the conventional design. Optimization was made using MATLAB version 7.3. The results of the analysis for a four-stream illustrative case demonstrated 46% of make-up, 93% of blow-down water and 17% of energy saving relevant to the KSD method. Consequently, applying the IOTCS methodology to the industrial large-scale problems provided more water and energy conservational opportunities. Nomenclature RCWS Re-circulating cooling water system Z Cooling tower height (m) A Cooling tower area (m2) Tamb. Ambient temperature (ºC) R Range (ºC) (ºC) REFERENCES
© IRSEN, CEERS, IAU The following images related to this document are available:Photo images[st08029t3.jpg] [st08029f7.jpg] [st08029t1.jpg] [st08029f8.jpg] [st08029f6.jpg] [st08029f4.jpg] [st08029f1.jpg] [st08029t2.jpg] [st08029f5.jpg] [st08029t4.jpg] [st08029t5.jpg] [st08029f3.jpg] [st08029f2.jpg] [st08029f9.jpg] [st08029f10.jpg] |
| |||||||||

 (39)
(39)