 |
| About Bioline | All Journals | Testimonials | Membership | News |
|
||||||
|
||||||
International Journal of Enviornmental Science and Technology, Vol. 5, No. 3, Summer 2008, pp. 287-296 An intelligent neural network model for evaluating performance of immobilized cell biofilter treating hydrogen sulphide vapors E. R. Rene; J. H. Kim; *H. S. Park Department of Civil and Environmental Engineering, University of Ulsan, P.O. Box 18, Ulsan 680-749,
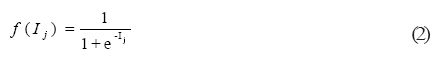
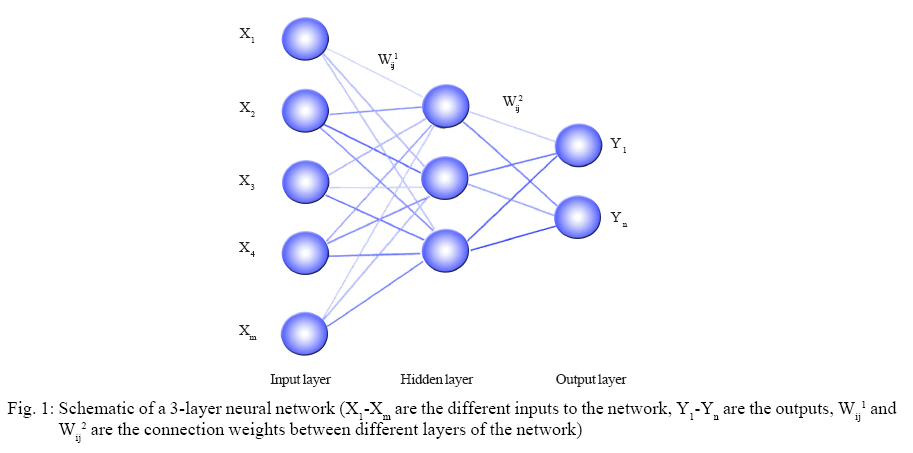
South Korea Received 3 April 2008; revised 22 April 2008; accepted 30 May 2008; available online 1 June 2008 Code Number: st08033 ABSTRACT Biofiltration has shown to be a promising technique for handling malodours arising from process industries. The present investigation pertains to the removal of hydrogen sulphide in a lab scale biofilter packed with biomedia, encapsulated by sodium alginate and poly vinyl alcohol. The experimental data obtained under both steady state and shock loaded conditions were modelled using the basic principles of artificial neural networks. Artificial neural networks are powerful data driven modelling tools which has the potential to approximate and interpret complex input/output relationships based on the given sets of data matrix. A predictive computerised approach has been proposed to predict the performance parameters namely, removal efficiency and elimination capacity using inlet concentration, loading rate, flow rate and pressure drop as the input parameters to the artificial neural network model. Earlier, experiments from continuous operation in the biofilter showed removal efficiencies from 50 to 100 % at inlet loading rates varying up to 13 g H2S/m3h. The internal network parameter of the artificial neural network model during simulation was selected using the 2k factorial design and the best network topology for the model was thus estimated. The results showed that a multilayer network (4-4-2) with a back propagation algorithm was able to predict biofilter performance effectively with R2 values of 0.9157 and 0.9965 for removal efficiency and elimination capacity in the test data. The proposed artificial neural network model for biofilter operation could be used as a potential alternative for knowledge based models through proper training and testing of the state variables. Key words: Immobilized cell biofilter, artificial neural networks, factorial design, elimination capacity, removal efficiency, back propagation, hydrogen sulphide INTRODUCTION Hydrogen sulphide (H2S) is used extensively as a digesting agent in the pulp and paper industry. However, the potential large emitters of hydrogen sulphide includes electric power plants (burning coal or fuel oil containing sulfur), oil and gas extraction operations, oil refineries, pulp and paper mills, sewage treatment plants, large pig farms, confined animal feeding operations and aerobic composting of low C/N material. Hydrogen sulfide is commonly found in coal and petroleum deposits and may be mobilized by human manipulation of these resources. Most hydrogen sulphide releases are directly to the ambient atmosphere. Inhalation is the major route of exposure to hydrogen sulfide in the environment. Hydrogen sulfide is disruptive to the mitochondrial electron transport system and is thus expected to affect all systems; the most sensitive systems are the respiratory and central nervous systems. Hydrogen sulfide is also an ocular and respiratory tract irritant. The Occupational Safety and Health Administration (OSHA) has set an acceptable ceiling limit for hydrogen sulphide of 20 parts hydrogen sulphide per 1 million parts of air (20 ppm) in the workplace. Hence there arises a potential need to adapt suitable control techniques for the effective removal of these emissions from related process industries. Biofiltration is a cost effective technology for treatment of waste gases containing low concentrations of VOCs at large flow rates (Rene et al., 2005). The high removal efficiencies (REs) achieved along with uncomplicated flexible design, low operational and maintenance costs edges biofilters over other biological treatment techniques such as biotrickling filters and bioscrubbers (Kennes and Veiga, 2001). Anew, biofiltration may be considered as a suitable solution for H2S emissions, as investment and operation costs are lower and performances are comparable with other abatement systems and comply with permit requirements. Biofilters have proved to remove H2S emissions effectively from gas streams using a bed of biologically active material such as compost, peat, wood bark, etc. A wide range of experimental studies have been carried out recently by researchers to evaluate the influence of operational parameters on the performance of biofilters handling H2S vapours individually and as mixtures (Lee et al., 2006; Duan et al., 2006; Sagastume and Nayola, 2006; Yu et al., 2007; Galera et al., 2008). In recent years, immobilization of microbes in support matrix such as alginate beads or suitable polymeric materials has gained popularity in the field of biofiltration. The main advantages of adopting immobilization techniques in biofiltration is to provide high cell concentrations, improve genetic stability, protection from shear damage and to enhance favorable microenvironment for microbes (nutrient gradients and pH). Chung et al., (1996) evaluated the effects of operational factors such as retention time, temperature and inlet concentration on the performance of a biofilter packed with Thiobacillus thioparus immobilized with Ca-alginate pellets and found an optimal S-loading of 25 g m"3/h. A wide variety of bacterial strains have shown potential ability to handle odors containing H2S. Bacterial species like Pseudomonas putida, Xanthomonas sp., Thiobacillus denitrifans and Thiobacillus ferroxidans have been used by researchers to eliminate H2S compounds (Chung et al., 1996; Cha et al., 1999). Traditionally the performance of biofilters has been modeled/predicted using process based models that are based on mass balance principles, simple reaction kinetics and a plug flow of air stream (Ottengraf and Oever, 1983; Shareefdeen et al., 1993; Deshusses et al., 1995; Jin et al., 2006). The main advantages of these process models are that they are based on the underlying physical process and the results obtained generally provide a good understanding of the system. However this depends on numerous model parameters and obligates information on specific growth rate of microbes, biofilm thickness and density, values of diffusivity, partition, yield and distribution coefficient, intrinsic adsorption etc. The accurate estimation of some of these parameters requires elaborate technical facilities and expertise, the absence of which hinders the preciseness of the model and limits the application and reliability of the model. An alternate modelling procedure consists of a data driven approach wherein the principles of artificial intelligence is applied with the help of neural networks. Artificial neural networks (ANNs) such as the three-layer back propagation network have been proved to be universal function approximators (Hornik et al., 1989; Poggio and Girosi, 1990). ANNs have already been applied to solve, predict and optimize a variety of environmental and biotechnological problems: wastewater treatment plant performance (Hanbay et al., 2008; Torrecilla et al., 2008), biodegradation kinetics of organic compounds (Schuurmann and Muller, 1994), air pollution related problems (Reich et al., 1999; Yildirim and Bayramoglu, 2006; Lira et al., 2007; Martin et al., 2008), predicting fed batch fermentation kinetics (Valdez-Castro et al., 2003), and optimizing media components for enhanced lipase production (Haider et al., 2008). Anew, it has been shown earlier that the performance of biofilters and biotrickling filters can be predicted from prior estimation of easily measurable operational parameters (Rene et al., 2006; Elias et al., 2006). The Ann based modelling strategy A multi layer perceptron (MLP) using the back propagation algorithm (Rummelhart et al., 1986) is the most widely used neural network for forecasting/prediction purposes (Maier and Dandy, 2001). Neural networks acquire their name from the simple processing units in the brain called neurons which are interconnected by a network that transmits signals between them. These can be thought of as a black box device that accepts inputs and produces a desired output. MLP generally consists of three layers; an input layer, a hidden layer and an output layer (Fig. 1). Each layer consists of neurons which are connected to the neurons in the previous and flowing layers by connection weights (Wij). These weights are adjusted according to the mapping capability of the trained network. An additional bias term (qj) is provided to introduce a threshold for the activation of neurons. The input data (Xi) is presented to the network through the input layer, which is then passed to the hidden layer along with the weights. The weighted output (XiWij) is then summed and added to a threshold to produce the neuron input (Ij) in the output layer (Yi). This is given by: Ij = ∑ WijXi + θj This neuron input passes through an activation function f (Ij) to produce the desired output Yj. The most commonly used activation function is the logistic sigmoid function which takes the form;
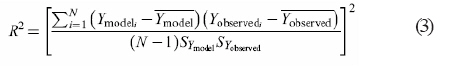
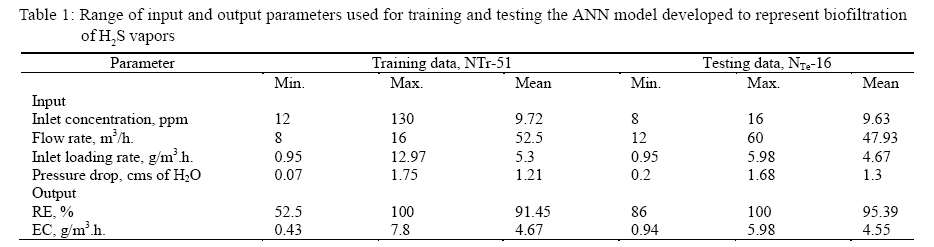
MATERIALS AND METHODS Experimental details pertaining to the cultivation of microorganisms, media composition, preparation of immobilized packing media, experimental setup, biofilter operation and analytical techniques for data collection are given in our previously published work (Kim et al., 2007). Modeling methodologyModel input-outputs and data division A neural network based predictive model was developed with flow rate (X1), inlet loading rate (X2), pressure drop (X3) and inlet concentration (X4) as the model inputs and elimination capacity (Y1) and removal efficiency (Y2) as the outputs. The experimental data was divided into training (NTr, 75%) and test data (NTe, 25%). The test data was set aside during network training and was only used for evaluating the predictive potentiality of the trained network. The minimum and maximum values of these variables for both the training and test matrix is shown in Table 1. Error evaluation The closeness of prediction between the experimental and model predicted outputs were evaluated by computing the determination coefficient values as shown below (Elias et al., 2006);
Where, Ymodeli predictions made by the model,
Yobservedi observed true values from experiments, N
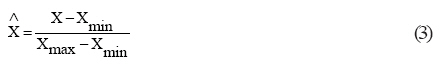
number of cases analyzed, Data pre-processing and randomization Experimental data collected from the biofilter during the 67 days of continuous operation was randomized to obtain a spatial distribution of the data, which accounts for both steady state and transient steady state operation. The data was also normalized and scaled to the range of 0 to 1 using equation 4, so as to suit the transfer function in the hidden (sigmoid) and output layer (linear).
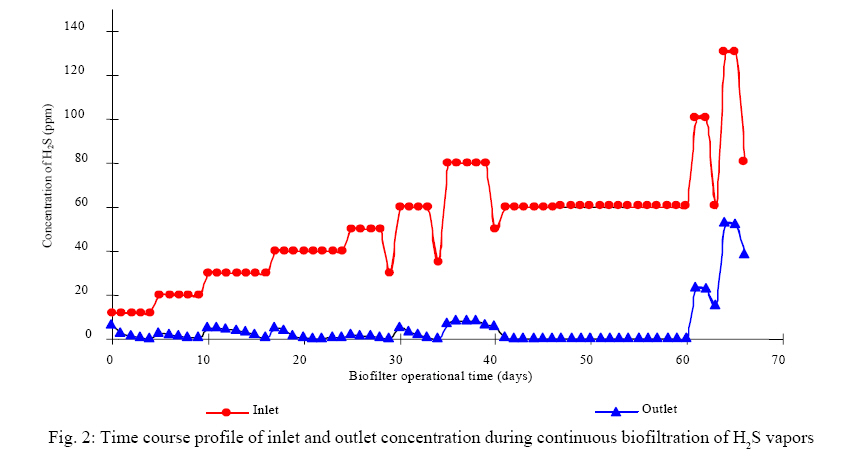
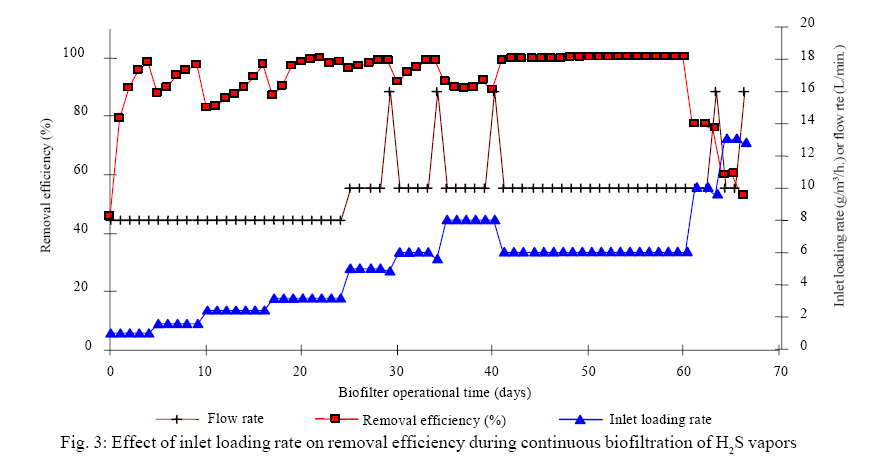
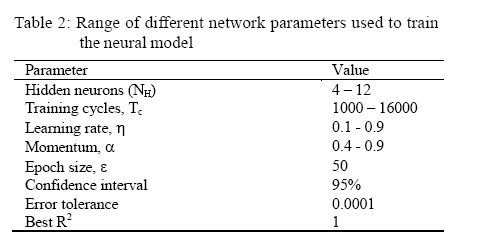
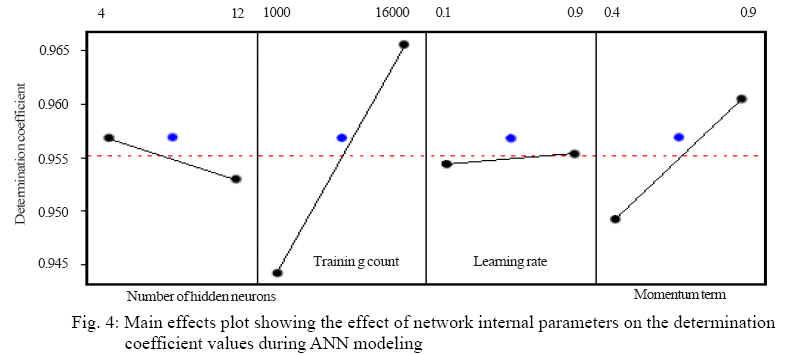
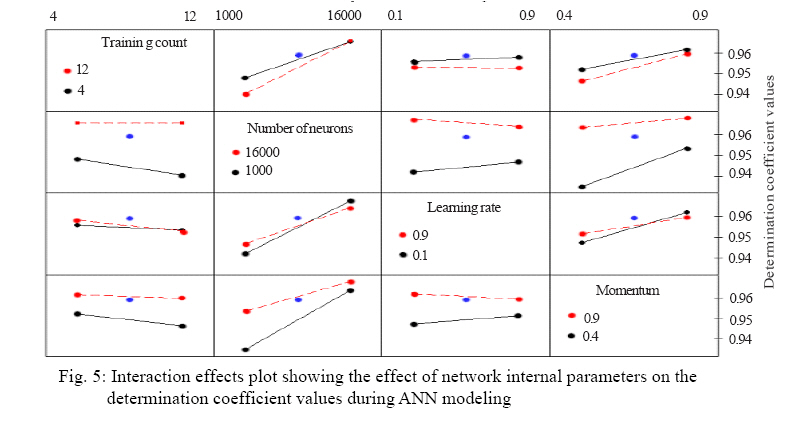
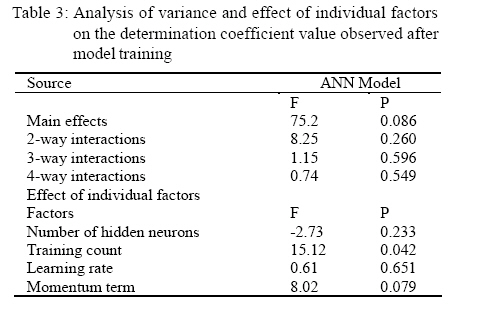
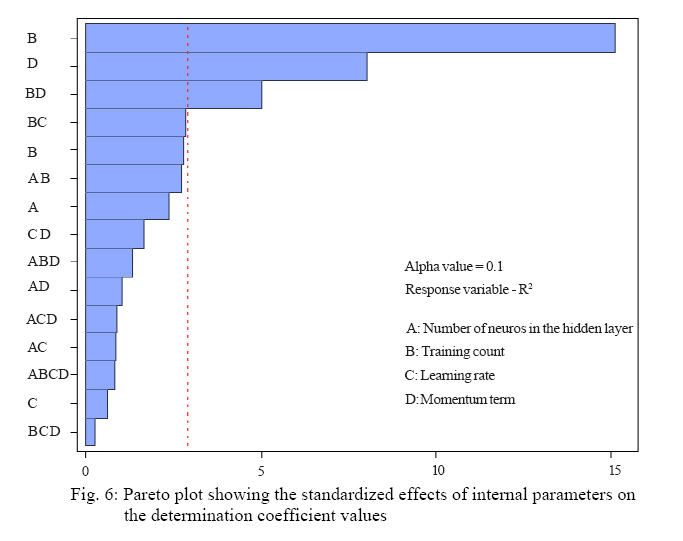
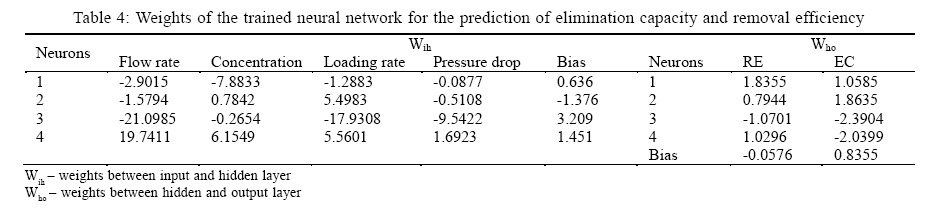
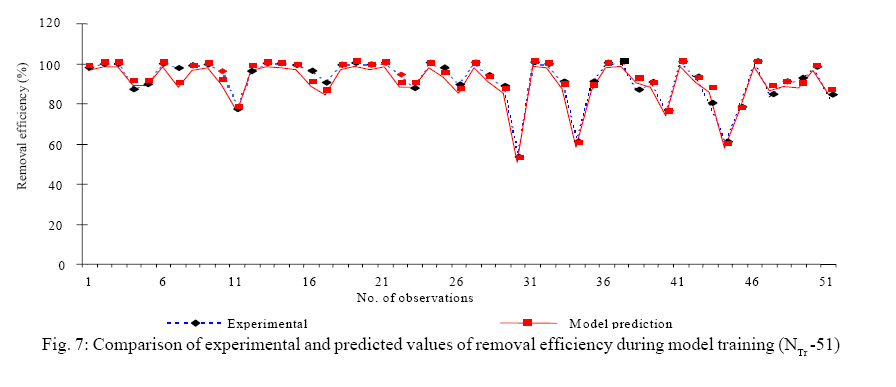
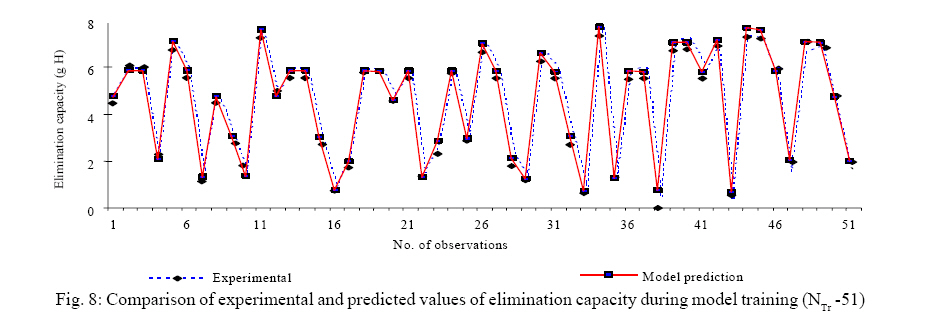
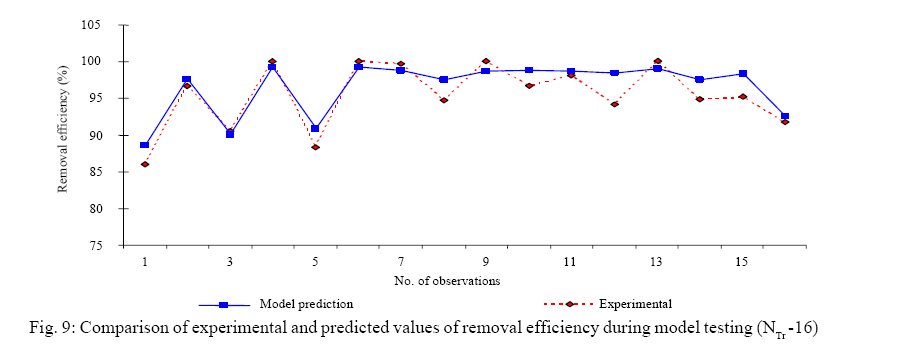
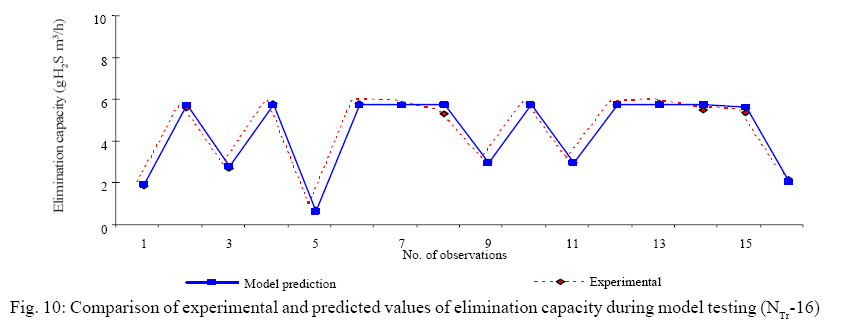
Where, Network parameters The internal parameters of the back propagation network namely epoch size, error function, learning rate (η), momentum term (μ), training count (Tc) and transfer function are to be appropriately selected to obtain the best network architecture that gives high predictions for the performance variables. In this study the number of neurons in the input layer (NI=4) and output layer (N0=2) were chosen based on the number of input and output variables to the network. A detailed study on the effect of internal network parameters on the performance of back propagation networks and the procedure involved in selecting the best network topology has been described elsewhere (Maier and Dandy, 1998). However in most instances, literature suggests the use of a trial and error approach where the performance goal is set by the user. In this study, the best values of the network parameters were chosen by carrying out simulations performed using the 2k full factorial design (Montgomery, 1991; Gopal et al., 2002). The 2k design is of particular significance in exploring the effect of many factors on the response variable for a particular system. It provides the smallest number of runs with which `k' factors can be studied in a complete factorial design (In this study, k=4, thus 16 simulations were done with center point replicates). Determination coefficient (R2) values were taken as the response variable and the setting that yielded the maximum R2 value in the test data was taken as the best network parameter. Softwares used ANN based predictive modeling was carried out using the shareware version of the neural network and multivariable statistical modeling software, NNMODEL (Version 1.4, Neural Fusion, NY) and full factorial design was carried out by the statistical software MINITAB. RESULTS AND DISCUSSION Experimental The initial loading rates during the starting phase for the biofilter treating H2S was 1 g H2S/m/h. at a concentration of 12 ppm and an empty bed residence time (EBRT) of 51 sec. Further, during every step increase in the loading rates, it was observed that the biofilter took about 2 or 3 days to adapt to the new concentration and reached a new steady state value shortly. The removal profiles thus obtained are shown in Figs. 2 and 3 as a function of the inlet concentrations and loading rates. Initially, when the loading rates were less than 1 g H2S/m/h. the RE increased gradually from 45 to nearly 100%, which indicated good activity of the immobilized cells to treat H2S vapors. The loading rate of H2S was gradually increased to 1.7 g/m3/h. on the 6th day of continuous operation. The response was a sudden decline in the RE from 99 % to 85 % followed by a new steady state at the end of the 10th day where the RE was 99 %. However, when the loading rate was increased to 2.5 g/m3/h., the RE dropped again to nearly 80 %. The response of the immobilized cells was rapid as evident from the decline of RE and the same performance (99 %) was later reached within 5 days of continual operation at the given condition. The input was changed in 7 steps up to a loading rate of 8 g H2S/m/h., during which the RE remained constant at 82 %. It has been shown that H2S metabolism by heterotrophic sulphur oxidizing bacteria is a detoxification process and high inlet concentrations have often been reported to decrease the H2S removal efficiency (Chung et al., 1996). The microbes were not able to sustain this higher load and did not exhibit a marked increase in oxidizing H2S effectively. In the later stages of operation, when the loading rate was held constant at 6 gH2S/m/h. the RE was 100%. After 60 days of operation, the inlet loading rate was increased significantly to 13 g/m3/h. by varying both the concentration and flow rate. It was found that there was a noticeable decrease in the RE values (52%). The elimination capacity profiles were almost linear till an inlet load of 8 g H2S/m3/h., which indicates that the biofilter performed with 100 % efficiency till this critical load. However, for higher initial concentration and higher flow rate used in the later steps, the elimination capacity of the filter bed increased at a slower rate, becoming nearly constant at inlet loads beyond 8 g H2S/m3/h. ANN based modeling To model the performance of the biofilter, neural based simulations were carried out using the standard back error propagation network. The experimental data collected from the biofilter was suitably divided into the training and test data set, pre-processed and randomized before carrying out simulations. The model was evaluated with the test data and the effect of network parameters on the R2 value was used as a measure to choose the best network architecture. Effect of network internal parameters The different range of values of network internal parameters used to train the network based on the factorial design of experiments are given in Table 2. The model predictions were used to compute the determination coefficient values. These values were then used by the software to obtain the main and interaction effects plot, which is shown in Figs. 4 and 5 respectively. The following interpretations were made from the main effects plot; (I) increasing the number of neurons in the hidden layer decreases the R2 value significantly (II) an increase in the training count from low (1000) to high levels (16000) displays significantly higher R2 value for the model (III) the effect of learning rate did not play a major role in increasing the R2 value, but it played a complementary role in speeding up the error convergence and (IV) the momentum term increased the R2 value when increased from lower to high levels. On the other hand, the interactions effects plot didn't show any regular interaction. However there were little interactions between learning rate and the number of neurons in the hidden layer. All other interactions were found negligible. Statistical analysis in the form of analysis of variance (ANOVA) was performed on the model and their corresponding F, P and T values are shown in Table 3. As indicated by the high F values (75.2) and low P values (0.086), the main effect of the variable was found to be highly significant than the 2-way, 3-way and 4-way interactions. Among the linear effect of the factors on the determination coefficient value, the training count and number of neurons in the hidden layer (NH) were found to be rich in significance than the other factors as seen from their T values (15.12 and -2.73). This was further manifested using the pareto plot that shows all the interactions and their effects on the response variable, namely determination coefficient (Fig. 6). The weight and bias term of the hidden layer connections obtained after network training is given in Table 4. The results from this study indicate that low learning rate (h - 0.1), high momentum term (a - 0.9), a training count of 16000 with 4 neurons in the hidden layer (NH) are favourable values of the internal network parameters to predict the RE and EC with high determination coefficient values (0.9157 and 0.9965). Predictive capability of the model The RE and EC values predicted by the ANN model is illustrated in Figs. 7 and 8 for the training data. It is quite apparent that, while predicting the RE and EC, the network was able to exactly map the data points. However, two or three data points were not adequately mapped by the network during training. This might have been caused by the step increase in loading rates where the microbes were reacclimatizing itself to attain new steady states. The reason for decreased performance could also be due to substrate inhibition, mass transfer limitations or also due to by-product accumulation within the encapsulated bio-media. After training, the network was provided with the separate set of data for testing the developed model. The results presented as EC and RE is illustrated in Figs. 9 and 10 respectively. A comparison between the EC and RE values predicted by the model with the experimental values reveals the predictive capability of the model. The model was able to adequately identify the low and high peaks in the EC and RE values. The R2 values obtained during training and testing were greater than 0.91, which indicated that the predictions are accurate with best network architecture of 4-4-2. CONCLUSION A laboratory scale immobilized cell biofilter evaluated to remove H2S vapours showed RE higher than 90% at loading rates less than 8 g H2S/m3h. This study explores the application of ANN as a performance prediction tool for a biofiltration process. The ANN model showed the ability to predict the extreme operating conditions and address the performance with R2 values greater than 0.91 for the training and test data set. The best network architecture (4-4-2) during effective training of the model was determined by 2k factorial design. The results from this study suggest that neural networks can capture and extract complex relations among the easily measurable parameters in a biofiltration process and predict the performance. Future research directions would target implementation of online sensor based neural network model to measure and control pollutant loads for optimal performance of biofilters. ACKNOWLEDGEMENTS The authors would like to acknowledge the research grants received from the Ulsan Regional Environmental Technology Research Center in South Korea for carrying out this experimental and modeling based research work. REFERENCES
© IRSEN, CEERS, IAU The following images related to this document are available:Photo images[st08033f9.jpg] [st08033f8.jpg] [st08033f6.jpg] [st08033f1.jpg] [st08033f7.jpg] [st08033f3.jpg] [st08033t3.jpg] [st08033f5.jpg] [st08033f2.jpg] [st08033t4.jpg] [st08033t2.jpg] [st08033f10.jpg] [st08033f4.jpg] [st08033t1.jpg] |
| |||||||||
