 |
| About Bioline | All Journals | Testimonials | Membership | News |
|
||||||
|
||||||
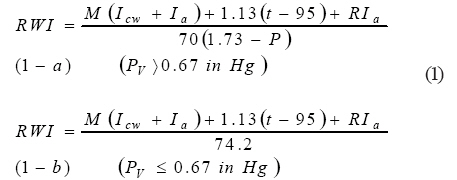
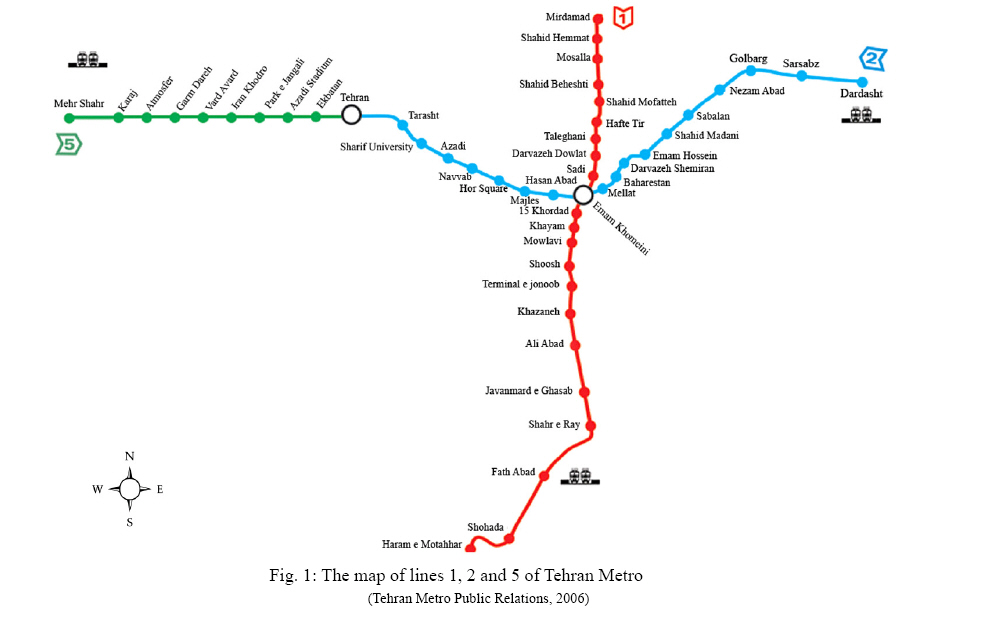
International Journal of Enviornmental Science and Technology, Vol. 5, No. 3, Summer 2008, pp. 297-304 Thermal comfort evaluation in Tehran metro using Relative Warmth Index 1 M. Abbaspour; 2 M. J. Jafari; 3* N. Mansouri; 3 F. Moattar; 3 N. Nouri; 3 M. Allahyari 1 Department of Mechanical Engineering, Sharif University of Technology and Graduate School of the Environment Received 1 March 2007; revised 28 March 2008; accepted 12 April 2008 Code Number: st08034 ABSTRACT Underground railway systems, can generate heat from their operations to raise the temperatures of carriages and the station substantially. This may lead to passenger discomfort and complain especially in warm weather conditions that prevail in Tehran if underground environment is not cooled. Transportation air conditioning Committee of American Society of Heating, Refrigerating and air-conditioning Engineers proposed the Relative Warmth Index for thermal comfort design and investigation in subway environment. In this research, thermal comfort at Tehran metro stations and carriages of lines 1 and 2 has been studied using this index. The measurements were taken during two periods of September 2006 and July 2007 at different zones of stations. For this purpose, temperature, relative humidity and air velocity were measured at different times. The status of the air-conditioning systems together with passenger traffic was also recorded. A total number of 231 measurements including 114 and 117 measurements were carried out in September 2006 and in July 2007 respectively. The measurements in September 2006 did not exceed the thermal limit. However, it did exceed in July 2007. In comparison, with thermal comfort level of metros all over the world, Tehran Metro stands in an acceptable condition, while the maximum capacity of air-conditioning systems was not used, if so the thermal comfort condition would be better. Key words: Passenger discomfort, relative humidity, subway, underground railway INTRODUCTION Metro plays a significant role in present public transportation in order to improve the quality and to reduce the road congestion, as well as to fill gaps of insufficient public transport and road surface capacity (Nieuwenhuijsen et al., 2007). Residents in most urban areas spend a considerable amount of time commuting which is estimated to be 7% of daily time (Jenkins et al., 1992). The concentrations of air pollutants in road transportation carriages are extraordinary high. Other researchers found them to be 5 times higher than in the general urban environment (Fernandez and Ashmore 1995; Tian Tian et al., 2007). Underground railway transportation has several advantages over the other public transportation systems. Generally speaking, metro trains need 5070% less energy for carrying the same amount of loads or passengers. As a result, indirect substantial profit from its application has caused it to have a worldwide development. Environmental control system of the underground mass rapid transit (MRT) system must incorporate special design features in tunnel ventilation, smoke exhaust, air conditioning and so on which make it significantly more complicated than that of a commercial building (Shih-Cheng and Jen-Ho, 2004). Underground railway systems can generate enough heat from their operations to raise station and vehicle temperatures substantially (Overmeyer, 1961). This may lead to passenger discomfort and complain in warm weather conditions if the underground railway environment is not cooled. The heat generated by train motors, electric lighting, human body etc is so great that excessive temperatures would prevail in summer unless a volume of air in excess of that required for breathing is supplied (Ampofo et al., 2003 ; Glover, 2001). Most new transit systems are equipped with air conditioned carriages. The air conditioning hardware is of the vapor-cycle type resulting in great dissipation from the condensers of each air conditioning unit equal to 125% of the heat removed from the car interior. Since the power required per car for air conditioning may be as much as 50 kw, the energy and heat dissipation load of the air conditioners are significant contributors to the overall cooling load of subway system (SES, 1976). By 2007, Tehran metro had 90 km length, 51 stations and 3 lines in operation. Regarding its length, Tehran Metro stands among the first 24 metros in the world. By that year, totally 8110 km of constructed metros was utilized in the world in which Tehran underground shares 1.1% (Metro Bits' Website, 2008). Fig. 1 shows operating lines 1, 2 and 5 in Tehran metro. Four new lines are under construction in Tehran metro at present. Promoting the quality of comfort standards requires thermal comfort improvement at the metro environment to encourage people to use metro as the main public transportation system in Tehran. For this purpose, comprehensive studies on thermal comfort status and probable needs are required. Transportation Air Conditioning Committee of American Society of Heating, Refrigerating and Air-Conditioning Engineers (ASHRAE) proposed RWI for thermal comfort design and investigation in metro environment. Now, the application of RWI in design process of metro systems is a common practice but it has not been widely used to evaluate thermal conditions in operating underground railway systems. The RWI is a function of various parameters, including temperature, relative humidity, air velocity, individual clothing, and metabolic rate (SES, 1976; Ampofo et al., 2003). ASHRAE also proposed the thermal comfort classification table associated with RWI. Thus, it is possible to evaluate the thermal comfort status in metro environment using RWI. Other indices including predicted mean vote (PMV) and predicted percentage of dissatisfied (PPD) have been used by some researchers to evaluate an existing metro environment (Ampofo et al., 2004; Fanger, 1970; ISO 7730, 1994; Humphreys et al., 2002). Another similar study was conducted by Oakland on thermal comfort in trains and other enclosed spaces of London underground, looking in particular at high temperature in the tube environment. They found that, apart from temperature, relative humidity and air particulates play a significant role in thermal comfort of metro stations and carriages (Oakland Ltd, 2002). Arsenal research in Austria in 2002, organized a conference - Mobile Air Conditioning on the subject but none of the participants was able to define an acceptable thermal comfort criterion for an underground railway environment. Regarding metro design measures, RWI is suggested by many countries including USA (SES, 1976). This index considers all main parameters that affect thermal comfort in metro environment. The application of this index to evaluate present thermal status of Tehran metro is expected to indicate real thermal status of this environment and makes it possible to evaluate the design and execution of the existing system as well. MATERIALS AND METHODS This study was a part of a comprehensive research on air quality and thermal comfort in metro carriages and stations initiated by Tehran Metro Authority. The research plan was conducted to study lines 1 and 2 of Tehran metro in 2006 -2007. For this purpose, 6 stations and all carriages in lines 1 and 2 were studied. Total of 231 measurements carried out during two periods in September 2006 and July 2007. Considering that in September evaporating refrigerating systems and carriages' air-conditioners were not in full operation. September measurements were selected to evaluate thermal conditions in a maximized passenger period. The number of passengers using metro is usually maximized with inauguration of schools and educational institutes In September. July measurements were conducted to evaluate the air conditioning and ventilation system of metro in the warmest period of year. The measurement times were selected based on the hours of metro activity that was between 6:30 am and 23 pm. Temperature, relative humidity and air velocity together with air-conditioning flow rate were measured at different times in selected points in passenger carriages, driver cabins and stations, which include station entrances, ticket halls, three points on platforms, entrance and exit of air-conditioners. Six underground stations including, Mirdamad, Darvazeh Dowlat, Panzdah Khordad and Imam Khomeini stations, on line 1 and Azadi and Imam Khomeini stations on line 2 were selected for this study. A total number of 114 measurements have been done in September 2006 and 117 measurements in July 2007. Temperature and relative humidity were measured using a hygrometer LM-81 HT made by Lutron Company, Taiwan. It has a high accuracy, quick response within a time span and saving data in the memory for measuring time interval. Its accuracy for relative humidity was 0.1% and for temperature was 0.1 °C. A portable hot wire anemometer provided quick response and relatively high accurate reading even at low air velocities with digital readability, Tecpel AVM-714 made by Lutron Company, Taiwan, was used for measuring air velocity in selected points. Its small sensor and a ldong probe made it suitable for testing air conditioning ducts, entrances and diffusers. The resolution of readings was 0.1 m/s. All instrumentations used in this study were calibrated prior to each series of measurements. Finally RWI was calculated for each point by a method using the following equations (SES, 1976):
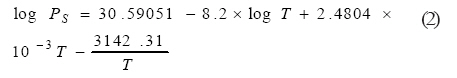
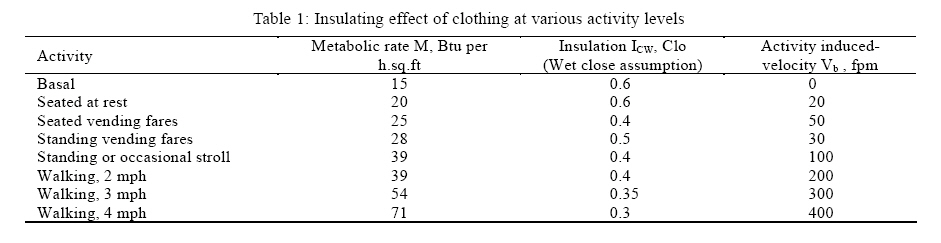
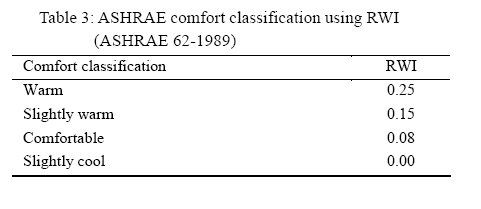
Where: M = metabolic rates, Btu/h.ft2 Icw = insulation of clothing based on wet cloth assumption, clo coeficient Ia = insulation effect of air boundary layer, clo coeficient t = dry-bulb air temperature,°F t - 95 = difference between dry-bulb temperature and average skin temperature just before a person feels uncomfortably warm, °F R = mean incident radiant heat from sources other than walls at room temperature, Btu/h. ft2 P = vapor pressure of water in air, in of mercury Saturated vapor pressure (PS) and vapor pressure (PV) at t were estimated using equations 2 and 3 (Chadderton 1997). Pv was less than 0.67 at all sites. Thus, RWI in the study came from relation (1a). Metabolic rate, insulation of clothing based on wet cloth assumption and activity induced velocity was driven out of Table 1. Table 3 shows the comfort classes based on ASHRAE recommendations using RWI. In present study, this table was used to evaluate thermal comfort in Tehran metro.
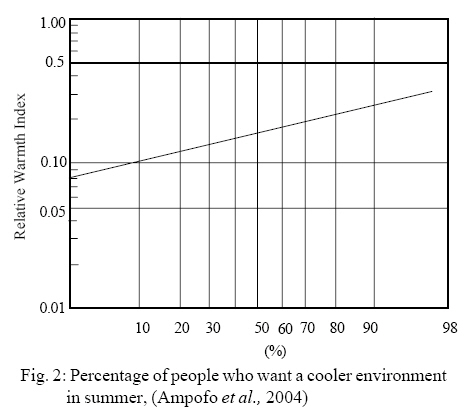
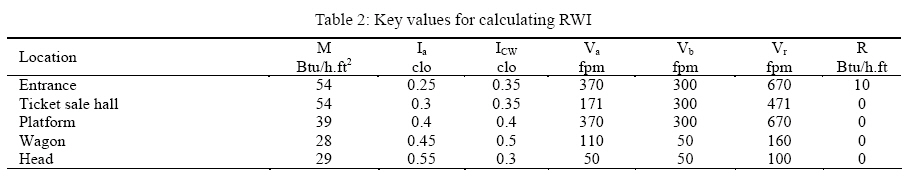
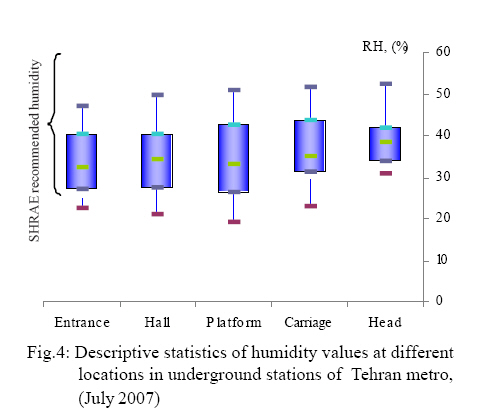
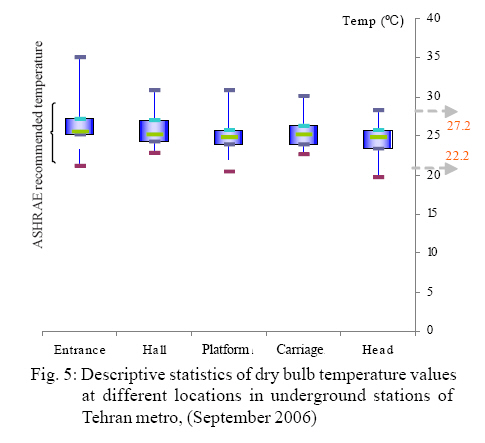
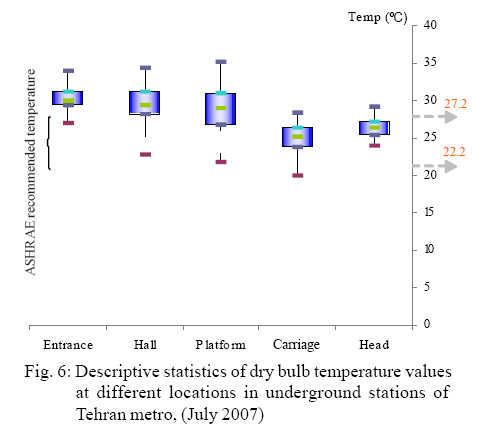
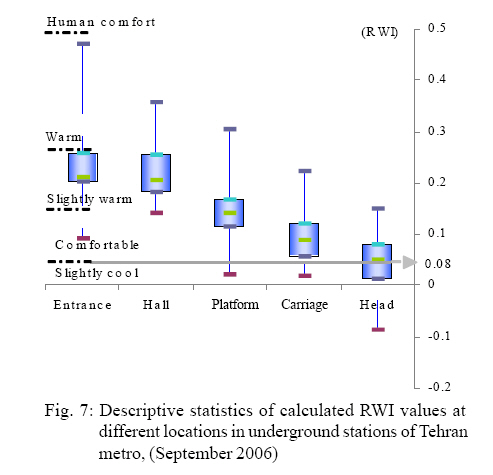
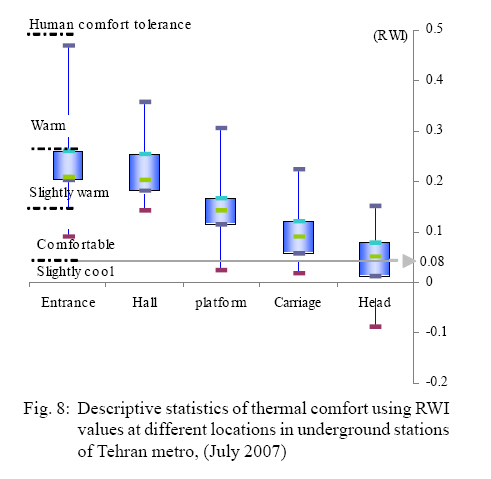
Pv = Psl - 1013.25 x 6.66 x 10-4 x (t-tsl) (3) Where: PS = Saturated vapor pressure at temperature t, kpa Psl = Saturated vapor pressure at wet bulb temperature tsl using equation 2, kpa PV = Vapor pressure at dry bulb temperatures, kpa T = Absolute temperature, K tsl = Wet bulb temperature, °C t = Dry bulb temperature, °C In this manner, a warmth level can be expressed quantitatively for various combinations of activities and conditions (Pribek, 1989a; Pribek 1989b). ASHRAE has made a frequency distribution of the percentage of test subjects who feel comfortable when exposed to the nominal ASHRAE comfort classifications. A quantitative relationship among ASHRAE comfort designations, the frequency distribution and RWI is shown in Fig. 2, which gives the percentage of people not feeling comfortable, those desiring a cooler condition, in environments with various RWI values (Ampofo et al., 2004). Table 2 shows selected and calculated values needed for calculating RWI using Eq. 1a and b at various locations in the underground stations (SES, 1976). RESULTS AND DISCUSSION Temperature, Relative humidity and calculated RWI values are presented as box plots. Spacing between different parts of the box helps to indicate variance, skewness and identify outliers. Each part represents one quartile of data distribution. The extreme lines represent maximum and minimum of data. The middle rectangle shows 50% of the data distribution. The descriptive statistics of relative humidity values at different locations during two periods of measuring time are shown in Fig. 1 and 4. The ASHRAE-55 standard recommends a range of 30% to 60% as the comfort levels for relative humidity (ASHRAE Standard 55-2004). The upper limit has been set considering corrosion effect of humidity, its effect on growth of micro organisms and condensation in cooler environments rather than comfort issues. The Fig. 3 and 4 show that in September 2006, not only the relative humidity in almost all of the measurements was lower than upper limit of recommended range of ASHRAE-55 but also less than 25% of the measurements were classified as dry. The statistics show that in July 2007, the warmer the outside air the drier the inside environment has been resulted. Due to lower humidity in stations (below about 30% relative humidity) It is expected to dry out the nose, eyes and throat, leading to discomfortibility of passengers (Fig. 4). The Low humidity air in stations also allows dust to circulate in the air which may lead to throat/lung problems, eyes and nose sores, etc. Evaporation from air washers installed in stations' ventilation system, peoples breathing and body evaporation are the main sources of humidity in the underground environment, but the measurements showed the lower rate of relative humidity in almost all of measuring points especially in warmer period such as July so more evaporation rates are required by air washers to normalize the relative humidity in stations in summer time. The lower difference between relative humidity on the platform and station entrance not only, approve the lower efficiency of the air washers to spray and evaporate water but also resulting in rising relative humidity and lowering the air temperature. Thus, it resulted on more discomfort in July 2007 rather than that of September 2006 in the stations. Fig. 5 and 6 show the descriptive statistics of dry bulb temperature values at different locations during two periods of measurements. However, higher dry bulb temperatures at the entrances of stations could be due to warmer conditions out side the stations, but the measurements in September 2006 were mainly found to be within the recommended range of ASHRAE standard values for dry bulb temperature. Whereas the mean values of dry bulb measurements in July 2007 were significantly higher than those of September 2006 and the ASHRAE standard values as well. It seems that the evaporative ventilation system did not operate as desired thus it couldn't cool down the stations environment satisfactorily in the outside warm condition such as July time. The high values of temperature in platforms, halls and station entrances approve this opinion well. In the other hand, dry bulb temperatures in carriages were lower than other points in the stations which show the good operation of carriage air conditioning system to prepare an acceptable environment for passengers. Fig. 7 and 8 show the descriptive statistics of calculated RWI values at different locations during two periods of measurements. Generally it can be concluded that although the thermal comfort in Tehran metro was relatively acceptable but ideal thermal comfort has not been achieved in the stations. This agrees with other researches (Ampofo et al., 2004), that believe the acceptable thermal comfort criteria say for an office may not be achievable in an underground railway environment. (ASHRAE insights, 2002; ASHRAE 62-1989, 1989; ASHRAE, Addendum to Standard 62-1989, 1989). Parker (1972) believes that dry bulb temperature, air velocity and relative humidity are important in passenger environment study but radiation is less important. (Bedford, 1936 ; Hickish, 1955) present study shows that in closed area such as carriages, as it is expected the air velocity does not play a significant role in thermal comfort as it is expected. According to Building Services Research and Information Association (BSRIA) report, in modern underground tube stations (MUTS) in about 97% of the time thermal condition was slightly cool to warm. Present study shows that thermal comfort in Tehran metro stations as MUTS, are warm. This shows that thermal comfort is not achievable in stations in hot summer days. Applying RWI values obtained for halls and platforms to Fig. 2 shows that, more than 98% of the people in halls and platforms of Tehran metro desire cooler environment in summer. Even in September, more than 80% of the people in halls and platforms prefer a cooler environment (Booth and Galliers, 2001). Thus, it is necessary to turn on more air conditioners in these periods of the year. Modification of the air conditioning systems installed at the stations is also suggested. The results show that, thermal condition in Tehran metro stations is similar to od underground tube stations (OUTS) in BSRIA report. Thermal condition in Tehran metro stations is also similar to Budapest underground in summer time which has been studied by (Ordody, 2000). He measured the thermal comfort in the passenger areas of five deep level stations, 20 30 m deep down from the surface, of the Budapest underground. He also measured dry bulb temperature, relative humidity and air velocity at typical areas in the occupied zones of the metro stations. During the measurements, however, the researcher reported that there was a case when the PPD went up to 80% (Ordody 2000; Aarnio et al., 2005; Overmeyer, 1961; Pribek, 1989). The calculated RWI values in underground carriages, compared with other studies indicate an acceptable and standard level of thermal comfort in Tehran underground carriages. In a study project carried out by Arsenal Research, commissioned by the Federal Ministry of Transport, Innovation and Technology of Austria, the real thermal situation of selected railway vehicles in everyday regular service has been investigated. All selected vehicles had air conditioning, some fully and others only partly. The aim of the investigation was to optimize passenger thermal comfort by studying the coactions of effective parameters such as air temperature, surface temperature, air humidity, air velocity, clothing and activity level. The final result has showed the thermal comfort condition to be slightly warm (Ampofo et al., 2004), but present study (Fig. 5, 6, 7, and 8) indicated suitable level of thermal comfort even in the warmest time of the summer in July. ACKNOWLEDGMENTS The authors wish to appreciate the General Manager of Tehran and Suburban Metro for his sincere assistance. REFERENCES
© IRSEN, CEERS, IAU The following images related to this document are available:Photo images[st08034f3.jpg] [st08034f4.jpg] [st08034f1.jpg] [st08034t1.jpg] [st08034f8.jpg] [st08034t2.jpg] [st08034f2.jpg] [st08034t3.jpg] [st08034f5.jpg] [st08034f7.jpg] [st08034f6.jpg] |
| |||||||||
