 |
| About Bioline | All Journals | Testimonials | Membership | News |
|
||||||
|
||||||
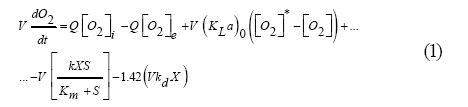
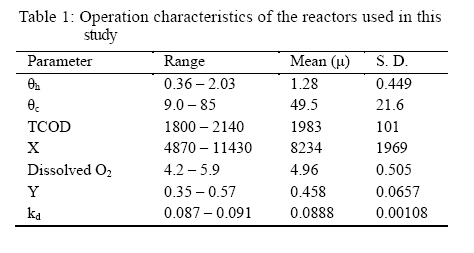
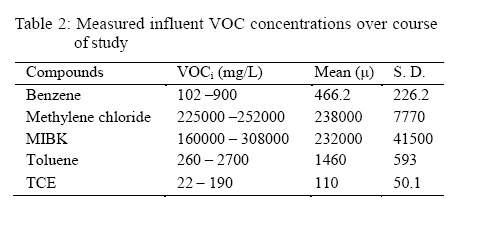
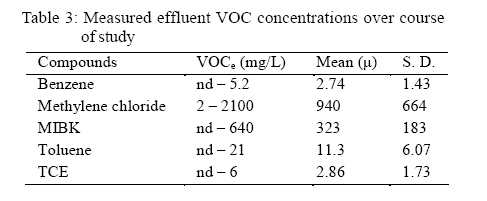
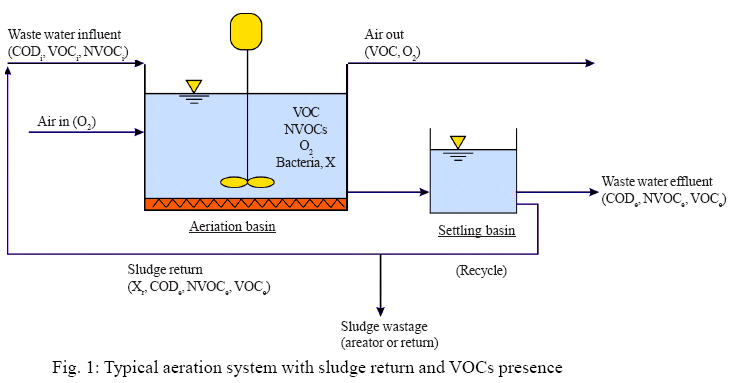
International Journal of Enviornmental Science and Technology, Vol. 5, No. 3, Summer 2008, pp. 353-360 Modeling of air stripping from volatile organic compounds in biological treatment processes 1 S. Soltanali; 2* Z. Shams Hagani 1 Department of Chemical Engineering, Faculty of Engineering, University of Tehran, Tehran, Iran Received 2 January 2008; revised 25 February 2008; accepted 12 March 2008; available online 1 June 2008 Code Number: st08040 ABSTRACT The removal of volatile organic compounds from biological treatment processes occurs through several mechanisms. These include biodegradation, adsorption onto solids, and air stripping or volatilization to the atmosphere. Volatilization results in fugitive emissions to the atmosphere, which is largely uncontrolled. Recent regulations have called for increased evaluation and control of inadvertent volatile organic compounds emissions from treatment processes. The use oxygen as a parallel volatile compound is extremely useful for prediction of volatile organic compounds removal by air stripping. In this study, the simultaneous biodegradation and air stripping of volatile organic compounds, based on steady state mass balance are examined and a general approach to estimating the dominant removal mechanism is developed. A Monte Carlo simulation technique was used to estimate air stripping over a wide range of operating conditions. Several volatile organic compounds were selected for this study. The results showed the values drived from the model correspond with the experimental data for benzene, toluene, methylene chloride, trichloroethylene, and methyl isobutyl ketone. Key words: Compounds, operating conditions, biodegradation, mass transfer INTRODUCTION Reduction of industrial emissions of volatile organic compounds (VOCs) is a part of a global strategy to reduce pollution due to tropospheric ozone (Granström and Månsso, 2008; Jafari and Ebrahimi, 2007; Butcher, 2005). Power plants, municipal waste combustors, motor vehicles, solvent use, chemical and food industries generate Volatile Organic Compounds (VOCs). They are also emitted from natural sources like forests. VOCs in the atmosphere have two major health impacts: some are directly toxic and can combine with nitrogen oxides to form ozone. Abatement methods for such emissions can generally be classified into four categories (Rahbar and Kaghazchi, 2005): (1) "Add-on" technology to destroy (incineration), recover (adsorption), or remove (adsorption wet scrubbing) VOC emissions from exhaust gases; (2) Reformulation of compounds to minimize organic solvent content, for example, low-solvent coatings (such as waterborne, high-solids and powder coating); (3) Process modifications and/ or improved housekeeping practices to reduce fugitive VOC; (4) Substituting of solvents that are less photo chemically reactive. Wastewater constituents can be categorized broadly as non-volatile organic compounds (NVOCs) or volatile organic compounds (VOCs). It has been long recognized that VOCs are inadvertently transferred to the atmosphere during aeration in wastewater treatment, i.e., fugitive emissions (Hsieh et al., 1993a; Roberts et al., 1984; ShamsHagani et al., 2007). This is a serious issue because these emissions are currently regulated and efforts to minimize volatilization affect the design and the operating parameters in biological treatments. As these factors are directly related to the cost and efficiency of the system, many investigations have been carried out to try to predict the amount of solute that is transported into the air. Previous studies were able to derive an empirical relationship between the oxygen transfer coefficients based on the relative aqueous diffusivity of oxygen and VOC. Studies showed the importance of the different parameters that affect aeration processes (Muller et al., 1981). Models for predicting VOC removal must include the biodegradation parameters and the physical parameters for volatilization (Magbanua et al., 1994; Hwa et al., 2000; Palmgren, 2001). However, these biological parameters are usually quite changeable and generally unknown under field conditions (Graydy et al., 1997; Magbanua et al., 1994). Therefore, deterministic models using both biological and physico chemical parameters are expected to show considerable errors. However, for existing operating systems, the reactor conditions are wellknown and frequently monitored. These continuously provide influent and effluent data for overall oxygen demand as BOD and/ or COD, dissolved oxygen, D.O., and the VOCs that are reported as the actual compound. Therefore, the known data can be used to determine the actual amount of oxygen transferred to the system, and utilized for biodegradation, which can result in a determination of the physical oxygen transfer parameters for the existing bio treatment processes. Additionally, these data may be used to estimate mass transfer coefficients for the VOCs. The purpose of this paper is to present a methodology to estimate the gas phase removal of ketone (MIBK), toluene and trichloroethylene (TCE), resulting from aeration under typical conditions of wastewater treatment by using the relationships between oxygen and VOCs. The model uses available data for known influent and effluent removed. Additionally, the technique includes uncertainty in estimating the rate parameters and stochastic inputs to predict the air stripping of VOCs. MATERIALS AND METHODS Data regarding biological uptake and volatilization of organic compounds were collected using a series of completely mixed reactors with gravity settlers for sludge return (Brown and Caldwell, 1999). Reactors were fed by actual wastewater from unnamed facilities that were spiked with various VOCs. Complete monitoring (influent and effluent COD and VOC concentration) was performed over the course of the experiments and occasionally the off-gas VOCs were captured in a Tenax column and the total mass of VOC adsorbed was measured to evaluate the VOCs removed by air stripping. A summary of the data characterizing the laboratory reactors is presented in Tables 1, 2, and 3. Each set of data was fit to a normal probability distribution for influent COD and VOC concentration and effluent COD and VOC concentration were defined by mean and standard deviation in Tables 1, 2, and 3. Normal probability distributions were also constructed for all uncertain parameters that were used in modeling. This was done using MS Excel software and the standard probability and statistics functions. The modeling was done in Excel by the Monte Carlo simulation technique using the random numbers generator in MS Excel software. The data generated by simulation were no longer a normal probability distribution due to the non-linear nature of the equations. These data were then analyzed by VTFIT software (A routine for fitting homogenous probability density functions), applying fourteen standard probability distributions and taking the best fit to the simulated data (Cooke, 1993). Oxygen is a volatile compound that is crucial to the operation of aerobic wastewater treatment processes, and the relationships between oxygen transfer parameters and VOC transfer parameters have been well established (Matter-Muller et al., 1981; Watson et al., 2001). A mathematical model is first developed by considering mass balance of oxygen around a completely mixed biological reactor, or aeration basin, as shown in Fig. 1. The mass balance for oxygen is then derived with respect to the aeration basin as a completely mixed biological reactor and can be expressed qualitatively or quantitatively as follows:
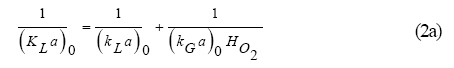
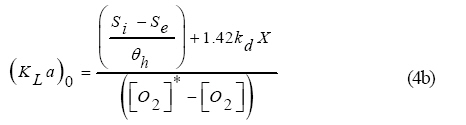
The factor 1.42 in the last term represents the conversion factor from biomass as volatile suspended solids to endogenous oxygen demand (Droste, 1997; Yan et al., 2008). In addition, the overall oxygen mass transfer coefficient, i.e. (KLa)0, represents two distinct resistances :liquid-film resistance "kLa" and gas-film resistance "kGa" or (Lewis and Whitman,1924; Munz and Roberts, 1989; Shih and Li, 2007):
Other scholars such as Munz and Roberts (1989) have found that the liquid phase controls resistance to mass transfer when the dimensionless Henry's constant exceeds 0.55, or for oxygen when HO2 = 22.82 >> 0.55:
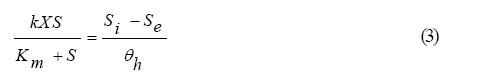
For biodegradation only the rate coefficients, k and Km, must be written as overall rate parameters for all oxygen demanding compounds, or as lumped oxygen demand parameters: BOD or COD, including NVOCs + VOCs. In addition, the biological rate coefficients, k and Km, are highly variable from compound to compound and case specific (Bielefeldt and Stensel, 1999). However, in this case, the Monod rate expression can be replaced by wellknown reactor operating parameters established from a mass balance on the substrate by assuming that the system stands at a steady state (Droste, 1997):
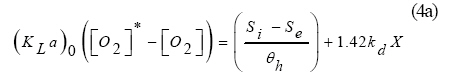
Eq. 3 represents the substrate removal rate from the process by biodegradation and can be used to estimate the oxygen actually transferred to the reactor. Then, Q[O2]i and Q[O2]e can be considered negligible compared to the oxygen demand in the reactor as long as Si-Se >> [O2]i and [O2]e, and Eq. 1 at its steady state can be simplified to:
This is also assumed that the NVOCs dominate the oxygen demand in the process, or that no significant removal of oxygen demand occurs through the air stripping of VOCs. The overall oxygen transfer coefficient, i.e. (KLa)0, can be estimated in terms of the other process operating parameters. After rearranging Eq. (4a):
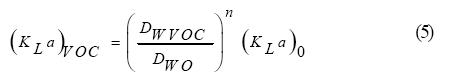
A relationship between the oxygen transfer coefficient and the overall mass transfer coefficient for any other VOC (KLa)VOC can be established (Roberts et al., 1984; Hsieh et al., 1993b; Munz and Roberts 1989):
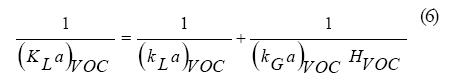
where, n = 0.1 to 0.8 (Roberts et al., 1984; Munz and Roberts, 1989). This equation is only true when the controlling mass transfer resistance for oxygen (liquid film controlled) is the same as the VOC, that is, both rates must be controlled by the liquid phase resistance (Munz and Roberts, 1989). As a criterion for liquid phase control, it has been suggested that dimensionless Henry's constant, HVOC > 0.55, is required. This would imply 95% of the total resistance due to the liquid phase when HVOC = 0.55. For those compounds that do not meet this criterion, i.e. HVOC > 0.55, a more general approach that considers the gas phase resistance (Eq. 2a) must be applied to the VOC:
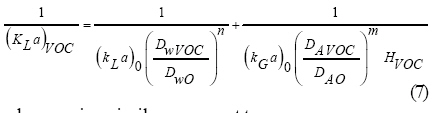
Then, this may be restated in terms of the diffusivities of oxygen and the VOC in water and air:
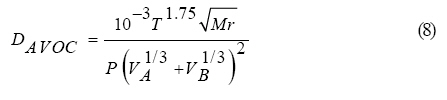
where, m is a similar exponent to n. Hayduk and Laudie reported an average error of 5.8% and this technique has been selected by others as the method of choice to determine diffusivities in aqueous solution (Weaver, 2005; Lymann, et al., 1982; Hayduk and Laudie, 1974). The diffusivities of VOCs in air were estimated, using the method of Fuller, Schetter and Giddings (Fuller et al., 1966):
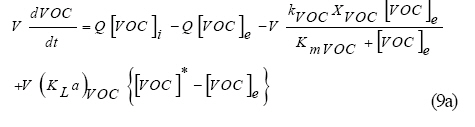
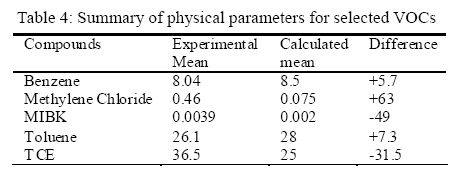
Jarvis and Lugg (1968) state that this is the most accurate method for chlorinated aliphatics, aromatics, alkanes and ketones and found that the estimated values deviated ±5% from measured values. A summary of pertinent physical properties for VOCs in this study are provided in Table 4. The overall mass transfer coefficient,i.e.(KLa)VOC, must be estimated for each VOC, based on the conversion of the oxygen mass transfer parameters to the VOC (Eq. 7). For oxygen, the liquid phase resistance controls the mass transfer, since oxygen is extremely volatile (HO2 = 22.92), or (KLa)0 = ( kLa)0. Then, (kLa)0 is known from the process operational data (Eq. 4b) and (kGa)0 / (kLa)0 for the system. Others have reported some values for (kGa)0 / (kLa)0 from 25 to 150 (MacKey and Leinonen, 1975; Leff and Fierer, in press). A mass balance around the aerator (specifically for a particular VOC) can also be developed under similar conditions as oxygen:
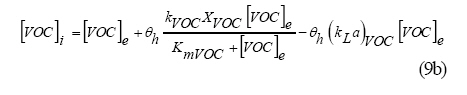
where, all parameters are the same as those in Eq. 1, unless they are specifically in terms of the concentration of VOC as the VOC, (not BOD OR COD), and XVOC only implies the specific biomass that biodegrades the VOC. Then, at the steady state, Eq. 9a is simplified by assuming the same operating conditions as previously assumed for oxygen. Except for VOC*~ 0, this would typically be true for surface aeration systems, but not necessarily for bubble aeration:
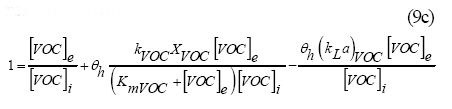
Then, divided by [VOC]i, the equation can be rearranged to:
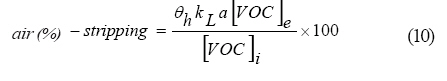
Now, each term on the righthand side represents a specific removal mechanism. The first term is a fraction of VOC removal by effluent wastage, the second term is a fraction of VOC removal by biodegradation and the third term is a fraction of VOC removal by air stripping. Thus, if [VOC]i and [VOC]e are two measured values, the biodegradation term does not need to be strictly known, and the volatilized friction can be expressed as:
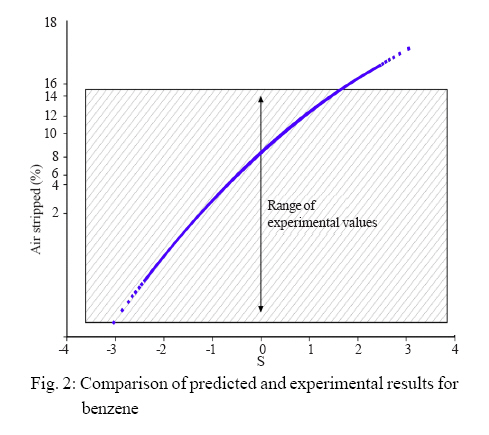
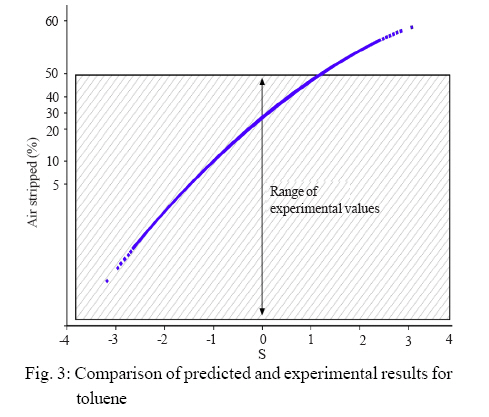
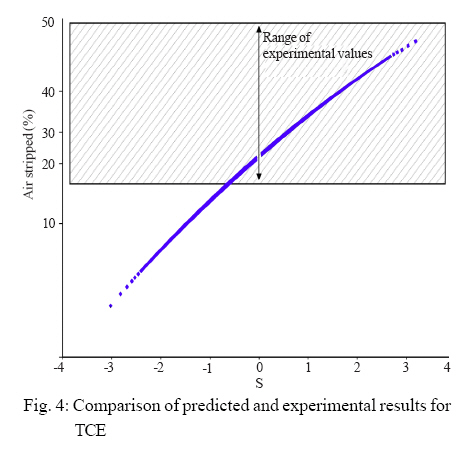
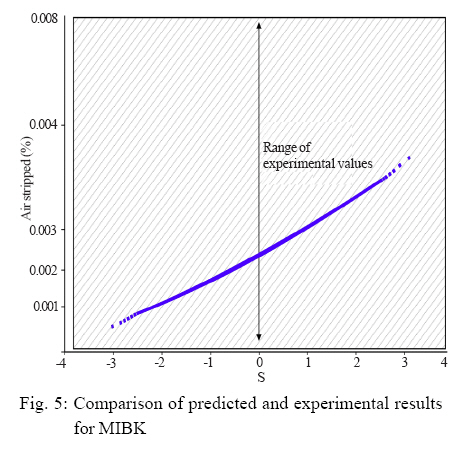
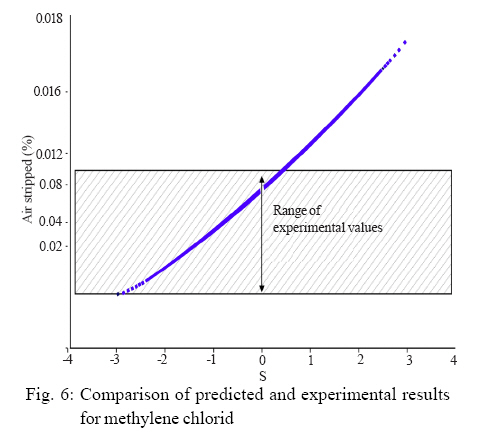
This technique eliminates the uncertainty in the biodegradation rate parameters and does not require a simultaneous calculation of biodegradation and air stripping to determine the effluent VOC concentration. Instead, this technique uses the measured effluent data for existing processes. In this way, one level of uncertainty the fraction biodegraded is removed and the model is simplified. RESULTS AND DISCUSSION The actual air stripping of each VOC was calculated over 1000 trials and the resulting distributions of data were analyzed by using VTFIT. The data were neither normally or lognormally distributed and the closest fit corresponded to a log-Pearson type (III) distribution. The data were then plotted by using the log-Pearson type (III) plotting position: log y = log The values of K were taken from the values supplied by Viessman and Lewis (2002). Values other than those directly supplied were found by using a nonlinear regression of the given Pearson coefficients. Once plotted, the values on the y axis (Pearson plotting position) were converted back to actual numbers (% air stripping in this case) to provide a useful scale for viewing. The predicted air stripping results are presented in Figs. 3, 4, 5, and 6 for benzene, toluene, TCE, methylene chloride and MIBK, respectively. A comparison between the simulated data and measured experimental data fits within the predicted distribution for benzene, toluene, TCE and the mean value from the distribution (s = 0) falls within the experimental values for benzene, toluene and TCE as well. The predicted distribution fits within the experimental data for MIBK indicating a good agreement as well. To further summarize the agreement between the predicted and measured air stripping, the mean values are extremely close. This validates the stochastic model predictions for volatile compounds (such as benzene, toluene, TCE, and methylene chloride) and nonvolatile ones (MIBK). CONCLUSION A stochastic model, was based on the steady state mass balance, which used to estimate the amount of solutes transferred to the atmosphere for VOCs, including benzene, toluene, TCE, methylene chloride and MIBK during aerobic biological treatment. The model used known influent and effluent data for CODand VOCs to estimate mass transfer parameters and the air stripping of VOCs. A Monte Carlo simulation technique was used to estimate air stripping over a wide range of operating conditions. The results showed that the model values agreed well with the experimental data for benzene, toluene, methylene chloride, TCE, and MIBK. In addition, the technique of using widely available operating data to estimate the parameters simplified the modeling, which, In other words, it eliminated the need to simultaneously estimate the biodegradation of VOCs. Nomenclature DAVOC: molecular diffusivity of VOC in air, cm2/s DAO: oxygen diffusivity in air, cm2/s DWVOC: molecular diffusivity of VOC in water, cm2/s DwO: oxygen diffusivity in water, cm2/s HO2: dimensionless Henry`s low constant for oxygen HVOC: dimensionless Henry`s low constant for VOC K: pearson frequency factor K: maximum specific substrate uptake coefficient, d-1 (KLa)0: overall oxygen mass transfer coefficient, d-1 (kLa)0: liquid phase oxygen mass transfer coefficient, d-1 (kGa)0: gas phase oxygen mass transfer coefficient, d-1 (kLa)VOC: liquid phase VOC mass transfer coefficient, d-1 (kGa)VOC: gas phase VOC mass transfer coefficient, d-1 kd: endogenous biomass decay coefficient, d-1 Km: Monod half- saturation coefficient, mg/L Mr: (MA+MB) / (MAMB), where MA and MB is the molecular weight of air and VOC, respectively, g/mol [O2]*: dissolved oxygen saturation concentration, about 9 mg/L for wastewater in equilibrium with air, at 20 ° C, mg/L [O2]I, [O2]e, [O2]: influent, effluent, and reactor dissolved oxygen concentration, respectively, mg/L P: pressure, atm Qi, Qe: flow rate into and exiting the process respectively, L/d S: reactor organic substrate concentration as BOD or COD, mg/L Si, Se: influent and effluent substrate concentration, mg/L T: temperature, K V: aerator volume, L VA ,VB: the molar volume of air and VOC, respectively, cm3/L X: biomass concentration in the reactor as volatile suspended solids, mg/L Y: result values Greek Symbols èh: hydraulic residence time, d-1 ó: standard deviation of the logy values REFERENCES
© IRSEN, CEERS, IAU The following images related to this document are available:Photo images[st08040t3.jpg] [st08040f5.jpg] [st08040t5.jpg] [st08040f4.jpg] [st08040f3.jpg] [st08040t1.jpg] [st08040f6.jpg] [st08040t2.jpg] [st08040f1.jpg] [st08040f2.jpg] [st08040t4.jpg] |
| |||||||||
