 |
| About Bioline | All Journals | Testimonials | Membership | News |
|
||||||
|
||||||
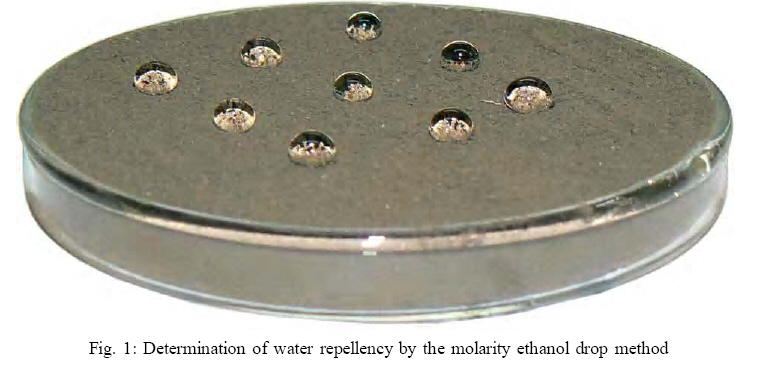
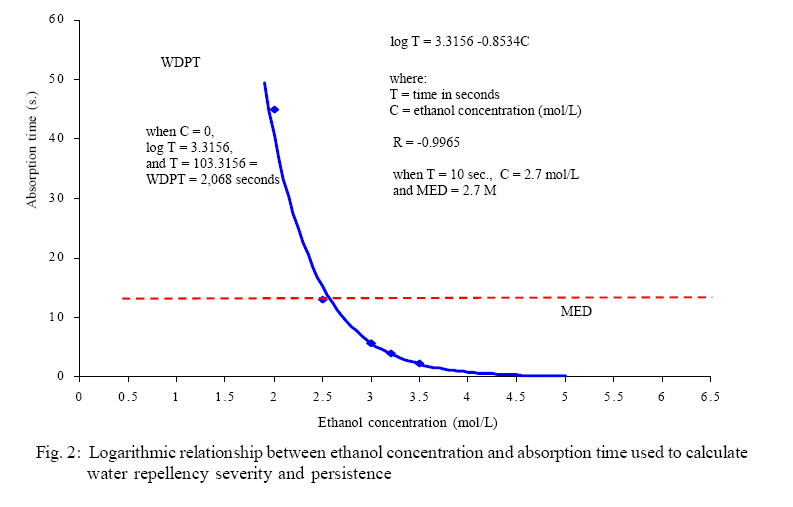
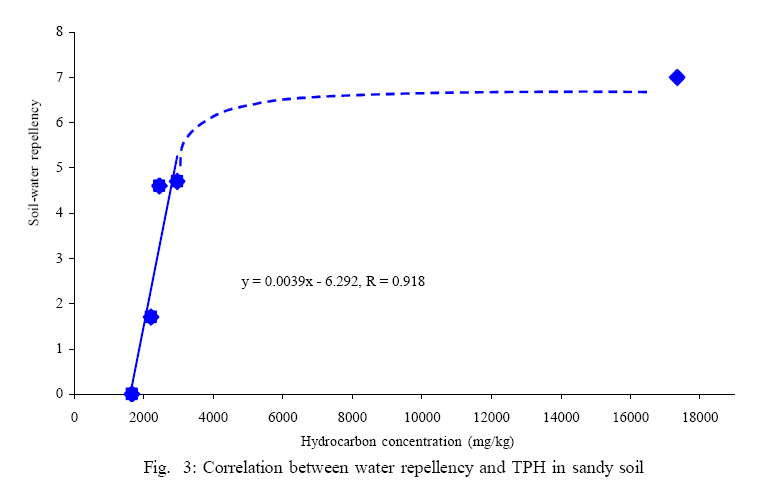
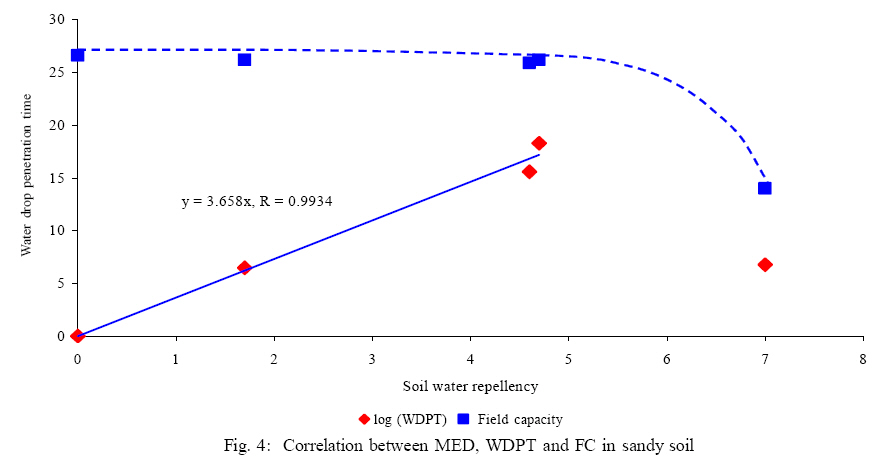
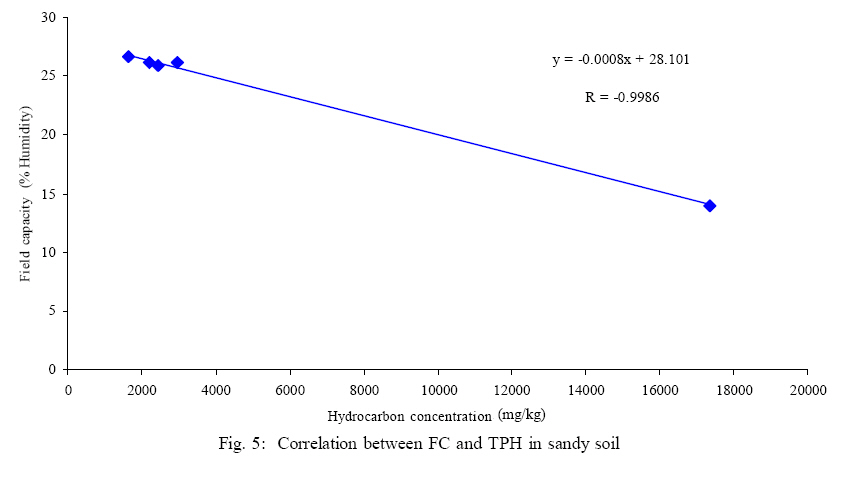
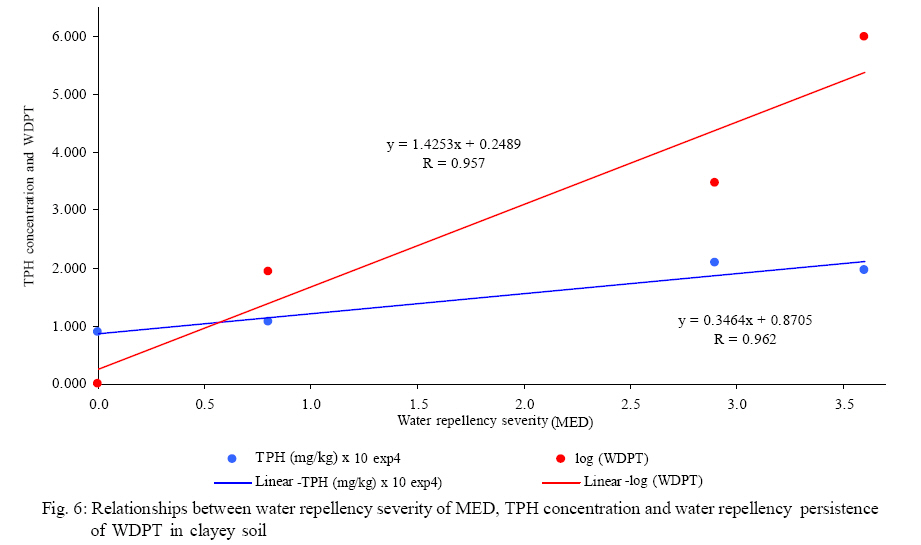
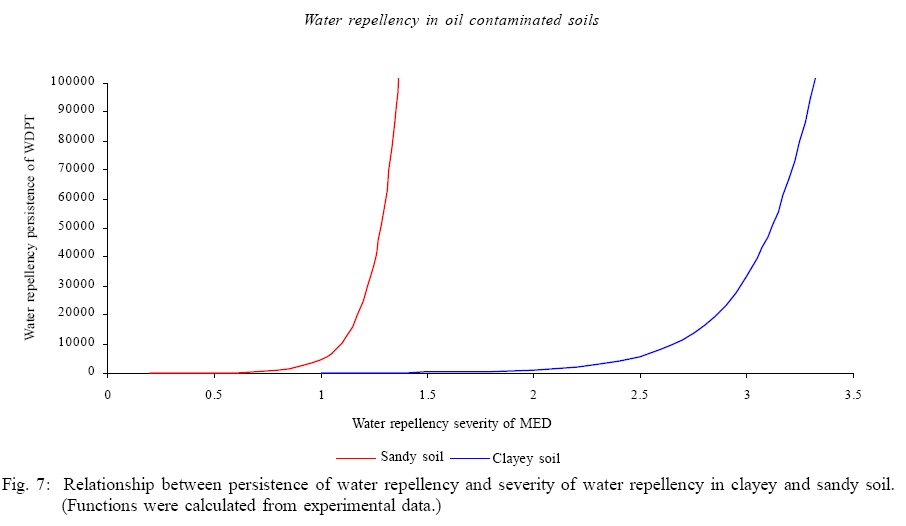
Water repellency in oil contaminated sandy and clayey soils 1* R. H. Adams; 1 F. J. Guzmán Osorio; 2 J. Zavala Cruz 1 Laboratorio de Biorremediación, División Académica de Ciencias Biológicas, Universidad Juárez Autónoma de Tabasco. Carretera Villahermosa-Cárdenas Km 0.5, Villahermosa, Tabasco, México Received 17 May 2007; revised 17 June 2008; accepted 24 July 2008 Code Number: st08049 ABSTRACT Two sites from a humid tropical environment were studied with respect to soil water repellency caused by hydrocarbon contamination. Samples were analyzed for water repellency (molarity ethanol droplet method), total petroleum hydrocarbons, acute toxicity (Microtox) and field capacity. At both sites, water absorption times were logarithmically related to the molarity ethanol drop value (R > 0.95). In a sandy soil collected from an old separation battery which had been bioremediated, field capacity was strongly related to hydrocarbon concentration (R = 0.998); and at 10,000 mg/kg the calculated field capacity was only 75 % of the baseline. Water repellency was related to hydrocarbon concentration asymptotically and plant growth limiting values (severity > 3.0) were observed at low concentrations (2,400 mg/kg), even though toxicity was at, or below background levels. Bioremediated soil at this site had hydrocarbon concentrations only 1,300 ppm above background, but had extreme water repellency (severity = 4.6 4.7). Soil water repellency was also measured in a clayey, organic rich floodable soil, in a multiple pipeline right-of-way colonized by water tolerant pasture and cattails. Water repellency was associated with total petroleum hydrocarbon concentration (R = 0.962), but was not related to field capacity or toxicity. In this low-lying site, the water repellency observed in the laboratory is probably not representative of field conditions: samples taken at the end of the ten week dry season (and only four days before the first rains) showed ample moisture (> 80 % field capacity). Key words: Hydrophobicity, total petroleum hydrocarbons, field capacity, toxicity, cleanup standards INTRODUCTION Water repellency is the reduced ability of a soil to reabsorb water after an extended dry period. In the oil industry, it has been observed in old catastrophic spills in Alberta, Canada, in soils without any obvious indication of contamination (odor, color, consistency) and with very low hydrocarbon concentrations (Roy and McGill, 1998). Water repellency in soils appears to be related to several factors such as extended drought, sandy texture and soil burning. In hydrocarbon contaminated soils, water repellency tends to show up in soils that suffer from a long drought sometime after the spill event, or which are very dry at the moment a spill occurs (Roy et al., 2003). In this situation it appears that as the soil dries out, the soil surfaces usually covered with a thin film of humidity, become covered with hydrocarbons. Later, these surfaces are not available to interact with water as the soil is re-hydrated causing water repellency. Soil water repellency has been observed in soils of all textures as well as organic rich soils, but there appears to be a greater probability of it developing in sandy soils (Doerr et al., 2000; Blake, 2002, Jaramillo, 2006). This is probably due to reduced field capacity in these soils: they are more likely to dry out completely than soils with a finer texture and greater field capacity. Water repellency has also been associated with forest fires (DeBano, 1981; Dekker and Ritsema, 2000). It is unsure if this is due to the drying out of the soil caused by burning, or the production of very recalcitrant hydrocarbons on the surface of the soil particles resulting from burnt resins. It is probable that burning of oil spills in upland soils would also result in the formation of water repellency by this method. In this study the possible water repellency in two soils from a tropical humid climate that varied considerably with respect to texture, history of contamination, and remediation were evaluated. The purpose was to determine what influence these factors may have on soil which suffers from oil contamination, and what soil restoration strategies would be appropriate in a tropical climate. MATERIALS AND METHODS Site selection and characteristics This study was conducted with samples collected on 21 February and 29 May, 2007. Samples were collected on soils from two sites in the Tonala River delta, in the southern Gulf of Mexico region, in a humid tropical climate (average temperature ~ 26 ºC, average precipitation ~ 1800 mm; West et al., 1987). It forms part of the Cinco Presidentes Petroleum Production Unit (Pemex Exploration and Production). The sites varied considerably with respect to soil texture, organic matter, and history of oil contamination and remediation. The first site is located at 18º 12' 47''N, 94º 00' 42''W in a coastal sandy fringe near separation battery No. 5 in the Cinco presidentes oil field, and has been described previously by Zavala Cruz et al. (2005) as a dystri-hortric Anthrosol. It is a man-made soil composed of sandy fill, poor in fertility but used for the cultivation of pasture. At this site we collected background soil (no previous history of contamination), contaminated soil and bioremediated soil. The bioremediated soil did not present any odor, color or consistency indicative of petroleum contamination. None-the-less, this soil was completely disaggregated and presented water repellency in the field as observed during a light rain. The bioremediated soil was colonized by a low lying grass which was much shorter in height than pasture in nearby uncontaminated areas (~5 cm height vs. ~30 cm). The second site is located at ~18º 04' 40''N, 94º 02' 38''W in a low-lying, marshy area, in a multiple pipeline right of way near the gas processing plant at La Venta, Tabasco, Mexico. It has been described as an anthraquic Gleysol by Rivera Cruz and Trujillo Nárcia (2004). It is a floodable soil, of a clayey nature, with a high organic matter content, which has been altered from its natural state (marsh) due to the cultivation of pasture. This site presents problems with chronic leaks of crude petroleum according to the site owner, which was also observed by an odor typical of relatively fresh spills in some samples. No water repellency was observed in the field. The vegetation is an association of cattails and pasture adapted to marshy conditions which maintains its vigor even during the end of the dry season. Sample collection Surface samples were collected (0-25 cm) with a straight shovel at several distances from the contamination source. Samples were placed in plastic bags and transported to the laboratory immediately. Water repellency Water repellency was measured by the molarity ethanol drop (MED) method which determines the molarity of ethanol in water which permits the water to be absorbed by a dry screened soil sample in less than 10 s. (Letey et al., 2000; Roy and McGill, 2002). Small droplets of solutions with different concentrations of ethanol were placed on the surface of the samples, and the time for absorption into the soil was measured. Soil was oven dried at 45 ºC and screened (mesh size 16, 1.19 mm.), prior to testing. To increase precision, the relationship between absorption time and ethanol molarity was graphed and the logarithmic function was determined. From this relationship the ethanol molarity corresponding to a penetration time of 10 s. was calculated (Figs. 1 and 2). From the molarity vs. absorption functions obtained, the water drop penetration time (WDPT); (Letey et al., 2000) was also calculated for each sample using an ethanol molarity of zero. WDPT value is considered to be a measure of water repellency persistence. Hydrocarbon concentration The total petroleum hydrocarbon (TPH) concentration in soil was determined by US Environmental Protection Agency (EPA) method 418.1, using perchloroethylene as extraction solvent and incorporating sample cleanup with silica gel to remove naturally occurring organic compounds (EPA, 1997). Total petroleum hydrocarbons were measured with an Infracal TOG/TPH analyzer-Wilks Enterprise. Toxicity Toxicity was measured using the microtox bioassay performed on samples diluted with deionized water (1/10). This test uses bioluminescence of Photobacterium phosphoreum (reclassified as Vibrio fischerii) as an indicator of toxicity. Acute toxicity was measured with the microtox system using a microbics model 500 analyzer (SECOFI, 1996). Field capacity (FC) Water retention was determined in free draining samples by weight difference after drying in an oven at 60 ºC as per Zavala Cruz (2004). RESULTS AND DISCUSSION Hydrocarbon concentration in sandy soil TPH concentration at this site was variable.The control area was approximately 30 m. from the most contaminated area and had no prior history of petroleum contamination according to the property owner. None-the-less, the concentration of TPH in this area was 1,660 mg/kg (dwt.). In a sample intermediate in distance between the control area and the most contaminated part of the site (but which had not been treated), the TPH concentration was 2,200 mg/kg. In this part of the site there was no obvious difference in plant growth or vigor with respect to the control area. The samples from the bioremediated area had concentrations only slightly higher (2,450 2,960 mg/kg) and did not show any observable effect of hydrocarbon contamination such as odor, color or stickiness. The most contaminated sample found at the site had a relatively high TPH concentration (17,350 mg/kg) however, indicative of essentially contaminated, untreated soil. Water repellency in sandy soil The severity of soil water repellency, as measured by the MED method varied between zero (in the control soil), 1.7 in the slightly contaminated soil, ~4.6 in the bioremediated soil, and 7.0 in the most contaminated part of the site. The water repellency was asymptotically related to the hydrocarbon concentration as shown in Fig. 3. At lower concentrations of TPH, where MED < 3, this function was essentially linear (R = 0.918). In this range, the TPH concentration was also related logarithmically (R = 0.957) to the persistence of water repellency, in this case, the WDPT values calculated from the ethanol molarity vs. absorption curves originally used to calculate MED. The severity of the water repellency was also logarithmically related to the WDPT (R = 0.993), except in the most contaminated soil (MED = 7.0; Fig. 4). From the TPH vs. MED function, a value of 2,400 mg/kg was calculated to result in very severe water repellency according to the scale proposed by King (1981). With increasing water repellency (MED=0; approx. 5), only slight changes were observed with respect to field capacity (Fig. 4). In this range, there was less than a 1.5 % reduction in field capacity, while the water repellency persistence increased from zero to nearly 2 × 10¹⁸ s. From these data it is evident that at this site with sandy soil, the water repellency caused by hydrocarbon contamination is of much greater significance than losses in field capacity. Field capacity in sandy soil The field capacity in the control, slightly contaminated soil, and bioremediated samples was nearly constant at ~26 % humidity, although a trend for slight decline was observed. In the very contaminated sample a large reduction in FC was observed, down to FC = 14 % humidity. When the results of FC were graphed with respect to TPH concentration, a linear relationship was observed (R = - 0.998), showing important losses in FC at higher concentrations (Figs. 4 and 5). At a TPH concentration of only 3,200 mg/kg, a 10 % loss in field capacity is calculated by this function, and at a concentration of 10,000 mg/kg, a loss of nearly ¼ is calculated. Toxicity in sandy soil The acute toxicity as measured by the Microtox method in this soil ranged from 10 to 11.4 toxicity units (TU = 1/CE50) in slightly contaminated, bioremediated and highly contaminated samples, and up to 18.9 TU in the control sample. Toxicity measured by this method did not appear to be related to TPH concentration, water repellency or field capacity. Hydrocarbon concentration in clayey soil The hydrocarbon concentration measured at the site with clayey soil varied with distance from the contamination source. In the sample farthest from the source, which had no visible evidence of hydrocarbon contamination in the field, such as odor, color, or consistency, a TPH concentration of 8.950 mg/kg was measured. This sampling point also presented a complete absence of water repellency and was considered a control sample. It is possible that part of the concentration being measured was due to natural organics not of petroleum origin. Rivera Cruz and Trujillo Nárcia (2004) reported organic matter concentrations for this site between 3 and 84 %. At sampling points closer to the source, the TPH concentration increased sequentially to between 10,600 - 20,980 mg/kg. Water repellency in clayey soil The water repellency, as measured by the molarity ethanol drop method in this clayey soil varied from zero in the control sample up to 3.6 in contaminated samples nearer to the hydrocarbon source. There was a strong positive relationship (R = 0.962) between TPH concentration and water repellency (Fig. 6). The water repellency severity was also logarithmically related to the water repellency persistence (R = 0.957). However, the repellency as measured in the laboratory, is probably not representative of water repellency in the field. Due to the low-lying location and marshy aspect of this site, even during the dry season there was adequate moisture at the site. At the end of the 10 week in dry season and four days before the first rains, the soil at this site was still moist and had > 80 % field capacity; the pasture and marshy vegetation did not show any obvious signs of water stress. Jaramillo (2003 and 2006), also observed this phenomenon in some Andean soils in which the natural soil temperature was very different from the temperature used in the laboratory for soil drying (15 ºC vs. 35 ºC or 105 ºC). In that study, water repellency was measured in some soils in the laboratory, but was not observed in the field, probably due to temperature differences. In our study, this difference is probably due principally to the low-lying, marshy nature of this site, which does not dry out even in the driest season of the year. Field capacity in clayey soil Field capacity at this site was very high, ranging from 46.6-52.2 % humidity, characteristic of a clayey soil with a high organic matter content (Rivera Cruz and Trujillo Nárcia, 2004). Interestingly, at this site the sampling locations closer to the contamination source and with greater TPH concentration, had greater field capacity. The FC was directly correlated to TPH concentration (R = 0.960), but increasing instead of decreasing with higher hydrocarbon concentration. Rivera Cruz and Trujillo Nárcia (2004) found increasing organic matter contents at higher TPH concentrations at this site, and according to their data, there is a correlation of R = 0.979 between TPH and organic matter concentrations. It is well established that soil organic matter is one of the main soil components which contribute to FC (Bohn et al., 2001). Therefore, it is very likely that the relationship observed in the study between increasing FC with increasing TPH concentration is primarily due to higher organic matter concentrations in the lower parts of the site. In the lower-lying, marshier parts of the site, it is more likely that spilled hydrocarbons will accumulate due to surface flow from slightly higher areas. Likewise, in marshier areas the ratio between the primary productivity of the vegetation vs. organic matter degradation will favor organic matter accumulation. This is because these parts of the site remain flooded with water for more time throughout the year, creating anaerobic conditions for longer periods. Under such anaerobic conditions, the biological degradation of organic matter is reduced, and the ratio of primary productivity vs. organic matter respiration is more favorable for organic matter accumulation. Thus, there is probably not a causal relationship between FC and TPH concentration, rather both are associated positively with the marshier parts of the site. Toxicity in clayey soil Soil toxicity in the clayey soil varied from background (10 UT) in samples with ~1 % TPH (including the control sample which did not show any water repellency) up to 12.2 UT and 32.5 UT in samples closer to the contamination source and with TPH concentrations of ~2 % (19, 580 mg/kg and 20,981 mg/kg). Apart from this general tendency, no concrete relationship between toxicity, TPH concentration, water repellency or field capacity was observed. Relationship between water repellency severity and water repellency persistence in sandy and clayey soils In both the sandy soil and clayey soil a logarithmic relationship was observed between the severity of water repellency of MED vs. the persistence of water repellency of WDPT. The severity of MED is a measure of how difficult is it to overcome water repellency (such as with the use of surfactants), while the persistence of WDPT is a measure of long it takes for water to be absorbed into dry soil. A comparison of these relationships in the sandy soil and clayey soil is shown in Fig. 7. As seen in this Fig. 7, the increase in WDPT with respect to MED is much more exponential in sandy soil vs. clayey soil. A value of MED = 2 in the clayey soil corresponds to a WDPT of ~1000 s., but in the sandy soil it corresponds to a WDPT of ~2,000,000 s. This is important with respect to the measurement and mitigation of soil water repellency. In sandy soils, a high MED value is of much greater significance than in a clayey soil. The sandy soil with the same MED value as a clayey soil will show much greater persistence of water repellency. The time water takes to infiltrate the soil will be much greater, thus causing less infiltration, greater surface run-off, more erosion and drier soil with reduced ability to support vegetation. However, in sandy soils the water repellency can be overcome more easily using surfactants. For soils with a value of WDPT = 100,000 s., the repellency can be overcome in sandy soil by using a surfactant that will produce the equivalent of MED 1.3, however, in the clayey soil one would need to add enough surfactant to produce the equivalent of MED 3.5, more than two and one-half times more surfactant. As seen from this relationship, the WDPT is a more important measure of probable water repellency without treatment, while the MED is a measure of the difficulty encountered in overcoming water repellency using surfactants. In soils that present moderate to severe water repellency, the WDPT is difficult to measure due to the very long times involved and changes in size of the water droplet due to evaporation. In contrast, the MED value is relatively easy to measure. Its precision can be improved by measuring the absorption time in several drops at the same ethanol concentration and repeating this at different concentrations. In the study better repeatability, using ethanol concentrations that produced absorption times of about 5 to 100 s. was observed. When the average absorption times are graphed with respect to the ethanol molarities, a logarithmic relationship is produced with typically very good correlations (|R| > 0.95). From the equation produced, [log (absorption time) = (coefficient A)*(ethanol molarity)], the WDPT can be calculated for ethanol molarity = 0 s. and the MED can be calculated for absorption time = 10 s. This method was determined, with better precision, both WDPT and MED as well as the absorption time vs. ethanol molarity relationship for each sample. Soil water repellency with respect to clean up standards From this study several issues arise with respect to soil cleanup standards. Government agencies in many countries (including state governments in the USA, in Venezuela and Indonesia), currently regulate the cleanup of oil contaminated sites based almost exclusively on hydrocarbon concentration, using 10,000 mg/kg TPH as the standard (LDNR, 1986; Mathews et al., 1997; Hamilton and Sewell, 1999; Infante, 2001; McMillen et al., 2002; Hernández-Valencia and Mager, 2003; Wisono, 2006). However, in this study it is observed that this level may result in serious deterioration of the soil and its ability to sustain plant growth. Severe water repellency was observed at a bioremediated site with a calculated TPH concentration of only 2,400 mg/kg. Likewise, at a TPH concentration of 10,000 mg/kg, a considerable reduction (~25 %) was calculated for the sandy soil based on the TPH vs. field capacity function (R = -0.998). Furthermore, the relationship between TPH concentration and water repellency or FC is variable among different soils. From such observations it is clear that these kinds of water-soil effects cannot be predicted categorically according to TPH concentration for all soil types. it is recommended to use water repellency, field capacity, and other soil fertility parameters, as well as toxicity, referenced to background levels, as alternative cleanup standards (Adams et al., 2006; Adams and Zavala, 2008; Li et al., 1997, Martínez and López, 2001; Salanitro et al., 1997). CONCLUSIONS Oil contaminated soil may present water-soil effects such as water repellency and reduced field capacity, even in bioremediated soil and even at relatively low (< 1 %) TPH levels. The persistence of water repellency was much greater in the sandy soil with respect to the clayey soil (about 6 times greater WDPT at similar TPH concentrations). None-the-less, the water repellency was easier to overcome using surfactants in the sandy soil, by about two and one-half times. In both soils, a positive linear relationship was found between TPH concentration and water repellency, except for the most heavily contaminated sampling points. Due to the variable nature of these relationships in different soil types, it is not possible to predict water repellency at all sites based only on TPH concentration. Therefore, it is recommended to use water repellency as one of many alternative cleanup standards, based on background levels at each particular site, using the MED method to calculate WDPT as determined in this study. Precaution needs be exercised to assure that the soil water repellency observed in the laboratory reflects actual water repellency effects in the field. ACKNOWLEDGEMENTS The authors would like to thank Mrs. Delfina Pérez Córdova, Mr. Armando Gonzáles and Mr. Pascual Corzo for allowing access to their properties and for orientation with respect to the history of site-specific oil contamination, and Mr. José Abisenas Alvarez Rivera and Mr. Alejandro Córdova Alvarado for assistance with field sampling and laboratory analyses. REFERENCES
© IRSEN, CEERS, IAU The following images related to this document are available:Photo images[st08049f7.jpg] [st08049f3.jpg] [st08049f1.jpg] [st08049f6.jpg] [st08049f5.jpg] [st08049f2.jpg] [st08049f4.jpg] |
| |||||||||
