 |
| About Bioline | All Journals | Testimonials | Membership | News |
|
||||||
|
||||||
International Journal of Enviornmental Science and Technology, Vol. 5, No. 4, Autumn 2008, pp. 455-462 Land assessment for flood spreading site selection using geospatial information system 1 *A. A. Alesheikh; 2 M. J. Soltani; 3 N. Nouri; 3 M. Khalilzadeh 1 Department of Geodesy and Geomatics Engineering., K. N. Toosi University of Technology Tehran, Iran Received 3 May 2008; revised 19 June 2008; accepted 28 July 2008; available online 1 September 2008 Code Number: st08050 ABSTRACT Irregular patterns of precipitations from temporal as well as spatial perspectives not only cause destructions but also waste surface water resources. Hence, controlling surface water and leading the flood to underground stores improve the efficiency of water usage. Selecting appropriate sites for optimal use of water floods is one of the most important factors in recharging underground water tables in dry lands where the agricultural and rangelands are vulnerable. Traditional methods of site selections are, however, time consuming and error prone. This paper attempts to; analyze existing schemes of site selection; introduces an appropriate method of locating flood-spreading sites using Geospatial Information System; implements the strategy in a case study; and scientifically assesses its results. The study area of this research is Samal sub-basin covering 31571.7 ha of Ahrom basin in Boushehr province. In the present research, factors pertain to earth sciences (quaternary units, slope and landuse) and hydrology (runoff infiltration rate and aquifers' depth) are considered. Information layers are weighted, classified and integrated through several models such as boolean logics, index overlay and fuzzy logics. The results are then checked against the existing sites to estimate their accuracy. The results of this research demonstrated that fuzzy logic operators including gamma=0.1, gamma=0.2 and products of fuzzy logics yield the best when compared to control fields and therefore, the models are introduced as the most suitable site selection strategies for flood spreading. Key words: Index overlay, fuzzy logics, recharging underground water, boolean logics INTRODUCTION Water consumption was estimated 2200 m3 per person in 1990 in Iran, while it is predicted that in 2025 there will be 726 to 860 m3. Consequently, Iran is a country facing water crises in the near future. Iran is located in a dry and semi-dry land with annual precipitation of about 250 mm. More than 50 % of precipitations take place in winters while less than 15 % occur in summers (Rafee et al., 2008). Thus, most of the rivers are dry in the mid springs until mid fall range. Underground water substitutes the water shortage. Overuse of underground water resources decrease the ground water level in many aquifers. According to recent studies on water resource development in Iran, the total amount of annual precipitation is about 430 billion m3, of which about 20 % is lost in the form of flash floods to the playas and seas. Artificial recharge is needed to challenge the water shortage issues in Iran (Khairkhah, 2005). Spreading floodwater can also decrease the damage that the episodic flows cause to human life, settlements and agriculture (Ghayoumian et al., 2005). Geospatial information systems (GIS) can be effectively used in the gathering, weighting, analyzing, presenting spatial and attribute information to facilitate any location endeavor (Alesheikh et al., 2005; Longley et al., 2005). GIS provides various tools to incorporate new models for any spatial processes (Amiri et al., 2006; Hosseinali and Alesheikh, 2008). Numerous spatial data integration strategies have been developed, some of which are highly specific and solve a reduced class of problems with various levels of uncertainties (Mobasheri et al., 2008). GIS can easily integrate various information layers, such as topography, geology and hydrology to provide a better prediction on the potentials of flood spreading sites (Farajzadeh et al., 2007). Application of remote sensing (RS) and GIS in site selection for artificial recharge and flood spreading management have been the topic of several researches (Chopra and Sharma, 1993; Saraf and Choudhury, 1998; Mehrvarz and Kalantari, 2007). Krishnamurthy and Srinivas (1995) discussed the role of geological and geomorphological factors in groundwater exploration. Krishnamurthy and Kkumar (1996) determined appropriate areas for artificial recharge through weighting several GIS layers. Chopra and Sharma (1993) assessed groundwater potentials through analysis of different landforms and geomorphologic features. The study includes investigation on land use, vegetation cover, slope, geomorphology and soil hydrologic groups. Geophysical investigations (Young et al., 1999) and field infiltration tests (Abu-Taleb, 1999) have been used for selection of artificial recharge sites in limited areas. Flood spreading and aquifer management are practiced in Iran since 1830. In addition, the identification of suitable sites for flood spreading as an artificial groundwater recharge technique have been practiced in recent years (Zehtabian et al., 2001). The basic pre-requisite for site selection is the determination of weights and rating values representing the relative importance of factors and their categories (Tsiporkova and Boeva, 2006). Boolean logic, index overlay and fuzzy logics are models to integrate spatial data. Mathematical concepts for spatial data integration A model is an abstraction of real world in which several parameters interact. Usually the more the factors are chosen, the more precise the results are. Abundance of factors and data cause the project expenditures to increase leading to sophistication of models. The best model is the one presenting the best results with the least factors. Many factors must be considered in order to locate areas for spreading floods, which are effective according to their priorities. The most useful integration models are: Boolean models The weight of any information layer in this method is based on one and zero logic i.e., any unit of flood distribution area is considered either good or bad. The three most commonly used boolean operators are AND, OR, and NOT. According to set theory, AND extracts commons and OR deals with subsets. In boolean logic, an AND operator between two information layers indicates the areas that contain both conditions. An OR operator finds places that contain either of the conditions. A NOT operator negates the conditions (Brown, 2003). Index overlay In index overlay method, each class of maps is
given a different score allowing for a flexible
weighting system. The table of scores and the map weights
can be adjusted to reflect the judgment of experts in
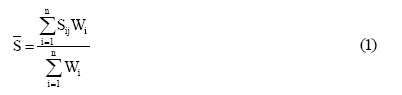
the domain of the application under consideration (Bonham-Carter, 1994). At any location, the
output score
Where, Two subclasses of index overlay may be identified as:
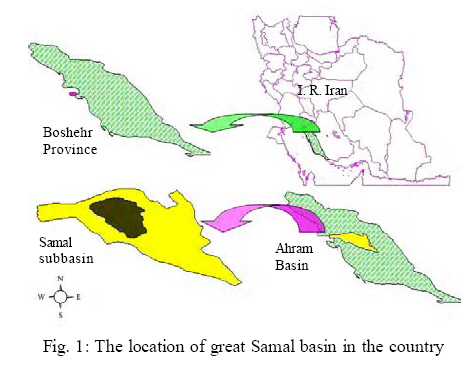
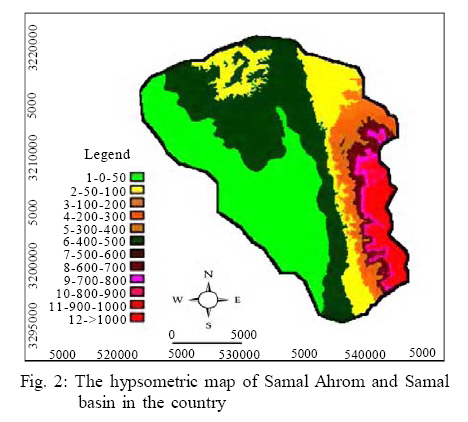
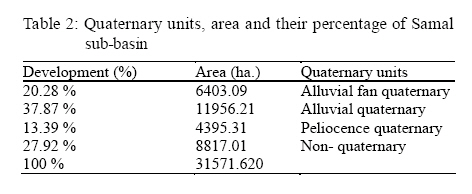
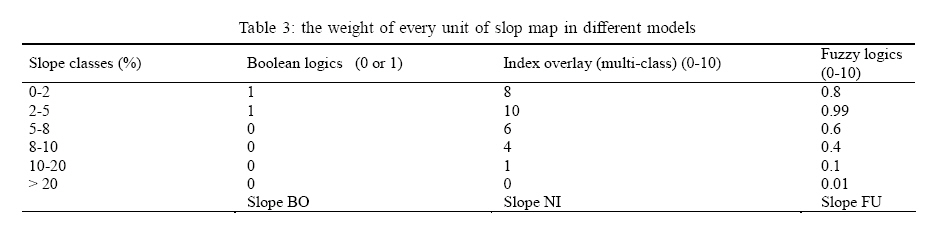
Fuzzy logics model Classic boolean logics is binary, which indicates a site is suitable or not. Fuzzy logics, introduced by Zadeh who permits the notion of nuance (Zadeh, 1965). Apart from being suitable, a flood-spreading site may be anything from almost hardly suitable to match. Fuzzy operators, such as fuzzy AND, fuzzy OR, fuzzy algebraic product, fuzzy algebraic sum and fuzzy gamma operator can be used to integrate spatial information layers. AND operator is equivalent to logical intersection and selects the minimum value from its two operands. Fuzzy AND operator is very sensitive and more accurate than OR operator. Fuzzy algebraic product calculates the multiplication of all membership values. The result tends to be very small with this operator, due to the effect of multiplying several numbers less than 1. The output is always smaller than or equal to the smallest contributing membership value and is therefore, "decreasive". Fuzzy sum operator is the complementary to the algebraic product, and therefore, the result is always larger (or equal to the largest) contributing fuzzy membership value. The effect is therefore, "increasive". Fuzzy gamma operator combines fuzzy algebraic sum and fuzzy algebraic product by means of gamma operation (Metternicht and Gonzalez, 2005). This is defined in terms of: Combination = (fuzzy algebraic sum) γ + (fuzzy algebraic product) (1-γ) (2) Where, γ is a parameter, chosen in the range of [0, 1] . When γ is equal to one, the combination is the same as the fuzzy algebraic sum and when γ is zero, the combination is equal to the fuzzy algebraic product. Judicious choice of γ produce output values that ensure a flexible compromise between the "increasive" tendencies of the fuzzy algebraic sum and the "decresive" effects of fuzzy algebraic product. The study area The study area of this research is Samal a sub-basin of Ahrom basin which is located in the central part of Bushehr Province, southern part of Iran, covering an area of 315.71 km2 that stretches between 28° 53', 21" and 29° 06', 40" latitude and 50° 52', 30" and 51° 07', 27" longitude. The study area in Fig. 1 shows Samal sub-basin. The area is located in a semi arid location with a water supply problem. The annual average precipitation is 260.1 mm. of which 143.9 mL in winter, 78.6 mL in autumn, 36.9 mL in spring and 0.7 mL in summer. This research has been done in 2002-2003 period. The maximum altitude of the basin is about 1100 m. and the minimum one is 20 m. The slope average of the area is approximately 6 %. Observations from the closest synoptic station reveal that the average temperature is 24.5 °C and the prevalent wind blows from northwest. The minimum monthly potential of evaporation and perspiration is recorded on December and its maximum is on July. Fig. 2 demonstrates Samal hypsometric map. There is no permanent or seasonal river in the area, so all the rivers are torrential ones dividing the basin into twelve hydrologic sub basins. The vegetation in the area includes many specious of Sisyphus, Calotropetum and Locoweed. In some parts, even Prosopis Koelzania is seen. MATERIALS AND METHODS In the first stage, factors affecting the areas for artificial recharge through flood spreading are identified. Based on previous research findings, information availability and priorities of factors, six parameters of slopes, capabilities of lands, geology (quaternary units), infiltration rate, alluvium thickness and land use were selected for further processes (ASCE, 2001). The data sets used in this research included a landsat thematic mapper (TM) acquired on 1991; four 1: 50,000 topographic maps, a 1:100,000 geologic map; a 1:25,000 map and 30 control points collected in the field. All data processing is done in ELWIS software environment. Data preparation In order to make the information layers ready for GIS analysis, three distinct procedures were exercised:
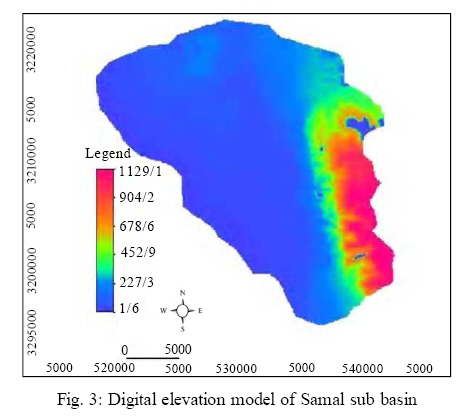
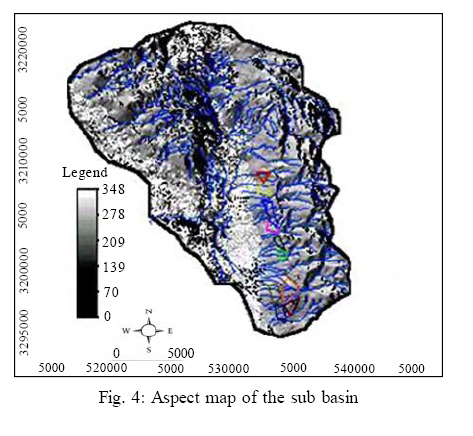
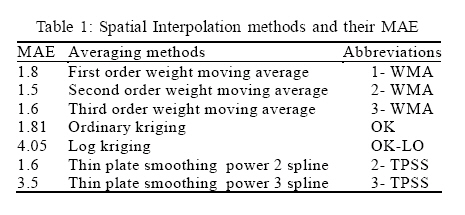
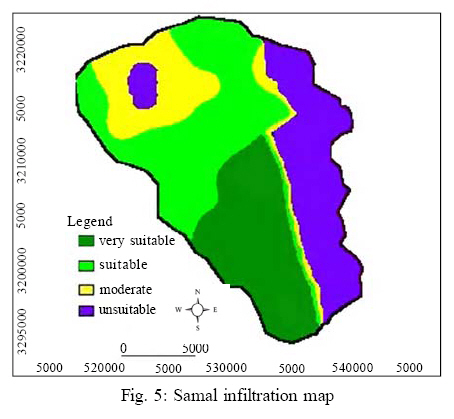
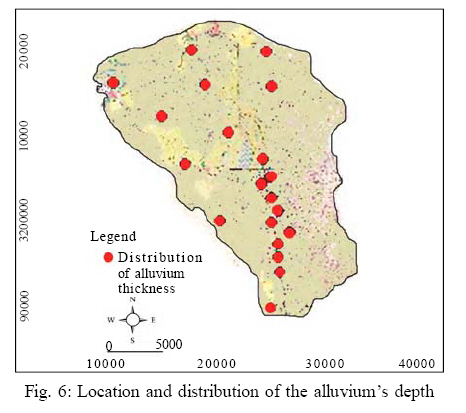
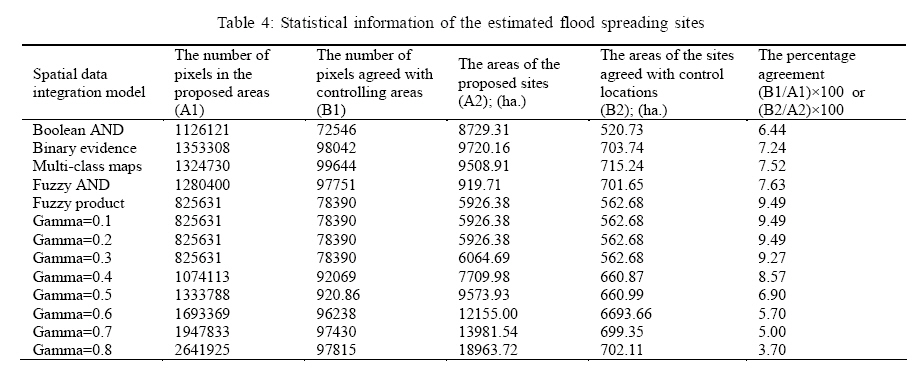
Slope Slope is a fundamental contributing factor in the selection of flood spreading areas. Water velocity is directly related to land slope. On steep slopes, runoff is more erosive and can easily remove detached sediments down the slope (Faucette et al., 2003). The experience from 36 flood spreading stations in Iran have shown that the most suitable area for flood spreading must have a slop less than 5 %. In order to provide slope layer of the area, 4 sheets of 1:50000 maps were mosaiced and the contour lines were digitized. Based on the generated vector map, digital elevation model (DEM) together with aspect map of the area is produced. Fig. 3 presents DEM of the area while Fig. 4 illustrates the slope direction map overlaid on the streams network and the spreading sites. Infiltration rate Infiltration rate restricts the entrance of water into the soil or porous material (Liu et al., 2001). The restriction often occurs at the soil surface. The most important parameters influencing infiltration rate are physical characteristics of the soil and the cover on the soil surface. In order to generate the map of infiltration rate, field works as well as the reports of controlling water resources of Ahrom-Boushehr were used. In this research, double ring method is used to measure the infiltration rate of field sites (Gregory et al., 2005). Spatial interpolation is performed to create a continuous surface (Raster map) from the measured point data (Schabenberger and Gotway, 2005). Three methods of spatial interpolations were practiced in this research, namely; kriging (ordinary and log ones), weighted moving average (WMA) in first and second orders and thin plate smoothing spline (TPSS) with second and third orders. Cross-Validation technique was applied to assess the results. Mean absolute error (MAE) was used to identify the goodness-of-fit. The most appropriate method should have the least MAE - the closer this factor is to zero, the more precise the method is. The outcome is demonstrated in Table 1. As it is reported, WMA of power 2 enjoys the least MAE and as such it is selected as the most accurate interpolation method (MAE=1.5). A raster map of Samal infiltration rate, which is generated by second order WMA, is shown in Fig. 5. Alluvium thickness A suitable site for flood spreading is the place with thick alluvia fan (Ghayoumian et al. 2007). In order to generate the alluvium thickness layer, 10 observational wells are used. Ten extra well sites are also used to validate the results of spatial interpolation. In this case, an ordinary kriging that lays the least MAE is used to generate a raster map of alluvium thickness. Fig. 6 presents the location and distribution of the wells in addition to alluvium thickness. Land capability This layer was extracted from 1:250,000 maps that belong to the Water and Soil Research Department of Bushehr. Geology (quaternary units) Quaternary unconsolidated sediments were separated from consolidated formations using a geological map of the Oil Ministry scaled at 1:100,000 in order to identify suitable areas for artificial recharge through flood spreading. The areas are digitized and a vector layer is generated. Table 2 displays the quaternary units and its geometric characteristics of the study area. Land use In this research, land use map was used to remove the agricultural lands from the estimated flood sites. Landsat TM image is used to produce a landuse map. The initial spectral classification of the image is performed by conventional maximum likelihood classification (MLC) using equal prior probabilities (Alesheikh and Sadeghi, 2007). To ensure that the data used for training are independent from testing, data collected from 30 randomly distributed points in the study area are used (Alesheikh et al., 2007). Weighting information layers Appropriate areas for flood spreading are determined through weighting five thematic layers: slopes, lands capability, quaternary units, infiltration rate and Alluvium's depth. Landuse layer is used to extract agricultural area from candidate sites. Weights are assigned based on several experts' knowledge. For instance, Table 3 presents the weights assigned to every unit of slope map in various combinatorial models. Integration of spatial data layers All classes of the thematic layers were integrated and analyzed in a GIS environment. To ascertain model validity, the generated site was verified by applying the model to existing flood spreading stations in the region. With regard to the gathered information layers and the research objectives, only boolean AND operator is exercised in this project to demarcate the potentials of flood spreading sites. In order to determine the candidate site using binary evidence maps, all the information layers are weighted in the range of 0 to 10. The weights were assigned in the following order: 10 for slope, eight for infiltration rate, seven for alluvium's depth and six for lands capability and quaternary units. In addition to the above weightings, in multi class maps all the subclasses are also weighted according to their importance. Once combined, an area with a greater number will be a better site. Various fuzzy operators are also applied to integrate information layers, namely fuzzy AND operator, fuzzy algebraic product, fuzzy algebraic sum and fuzzy gamma operator. Land capability map was obtained through fuzzy AND operator. The areas for flood distribution have been extracted from γ = 0.1 to γ = 0.9 in this research. RESULTS AND DISCUSSION In order to assess the models, the estimated maps of flood distribution area were overlaid on the maps of existing ground water recharge sites. Pixels within the good and very good classes were considered in this evaluation. Table 4 presents a summary of the model assessment. The table includes the area of the estimated sites, its intersection with the control places and the match percentage. From the Table 4, it can be found that:
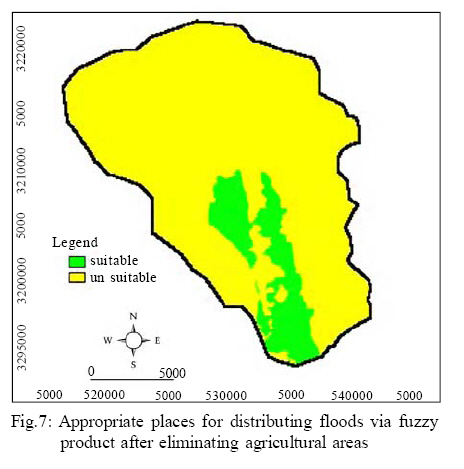
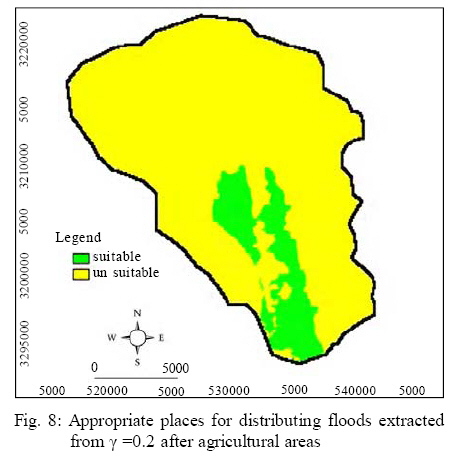
Based on the model assessments, Fig. 7 depicts the results of applying fuzzy product operator and Fig. 8 presents the proposed area based on gamma=0.2 (after eliminating agricultural areas). CONCLUSIONS This study demonstrated how GIS could be used to determine appropriate sites for flood spreading. In this research, several data integration models have been assessed; namely, boolean logics, index overlay and fuzzy logics. Governing parameters of site selections are identified as slopes, capabilities of lands, geology (quaternary units), infiltration rate, alluvium thickness and land use. The later factor is used to extract agricultural area from the selected sites. Weighting parameters are of vital importance to the estimation, as such all parameters are weighted based on several experts' opinions. As the gamma operator (0.1-0.2) in fuzzy logic model have the most overlap with the control zones, this model is presented as the best one among the models for the study area. More research should be conducted on the model sensitivity to various parameters. More sample points and better satellite image resolutions can improve the accuracy of the results. A comprehensive spatial decision support system can help better identify the success and failures of similar projects. REFERENCES
© IRSEN, CEERS, IAU The following images related to this document are available:Photo images[st08050t4.jpg] [st08050f2.jpg] [st08050f4.jpg] [st08050f1.jpg] [st08050f7.jpg] [st08050f6.jpg] [st08050f8.jpg] [st08050f5.jpg] [st08050f3.jpg] [st08050t2.jpg] [st08050t3.jpg] [st08050t1.jpg] |
| |||||||||
