 |
| About Bioline | All Journals | Testimonials | Membership | News |
|
||||||
|
||||||
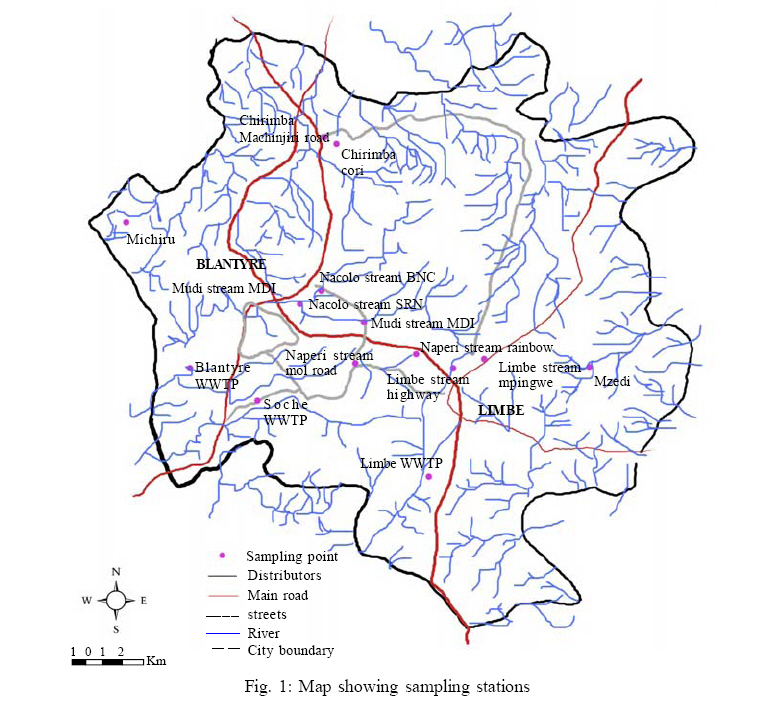
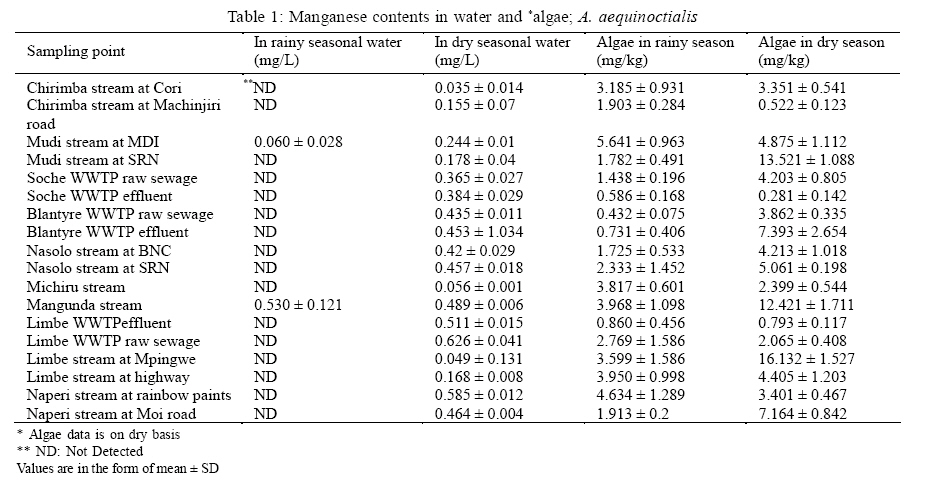
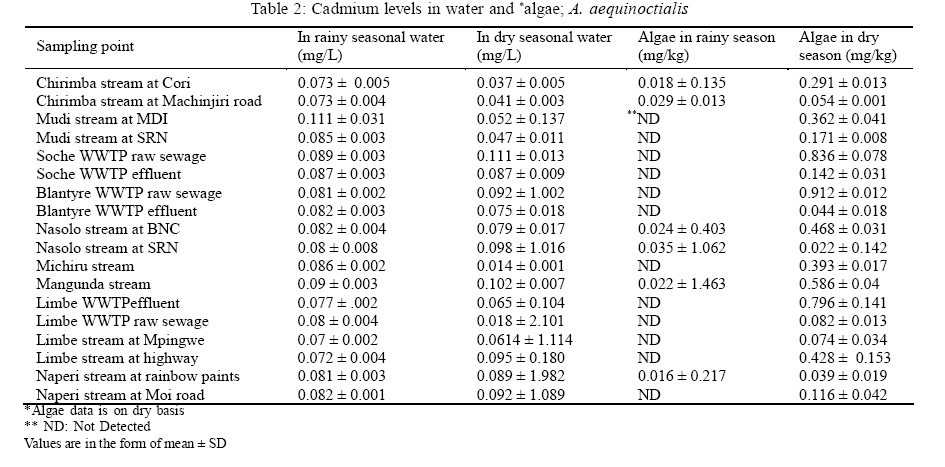
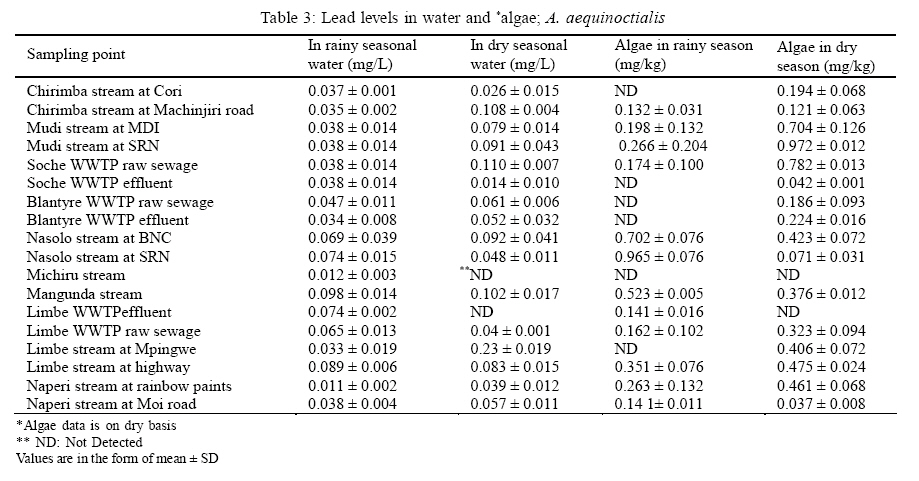
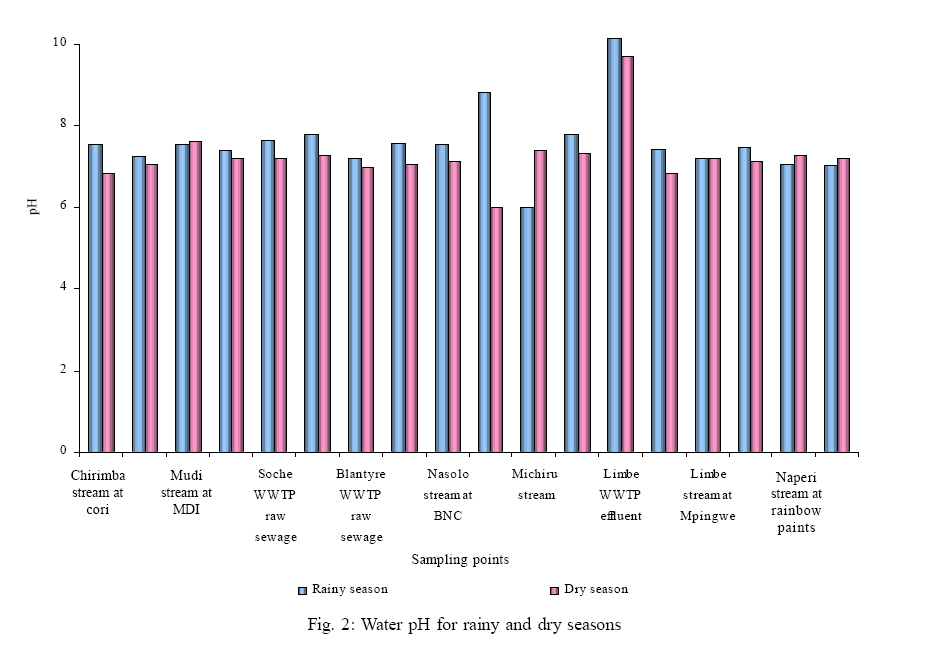
International Journal of Enviornmental Science and Technology, Vol. 5, No. 4, Autumn 2008, pp. 471-478 Levels of cadmium, manganese and lead in water and algae; Spirogyra aequinoctialis 1* C. C. Kaonga; 2 S. S. Chiotha; 2 M. Monjerezi; 2 E. Fabiano; 3 E. M. Henry 1 Physics and Biochemical Sciences Department, University of Malawi, The Polytechnic, P/Bag 303, Chichiri, Received 3 April 2008; revised 24 May 2008; accepted 18 July 2008 Code Number: st08052 ABSTRACT This study assessed the ability of filamentous green algae; Spirogyra aequinoctialis to accumulate manganese, cadmium and lead from water. Water pH was also determined. Samples of S. aequinoctialis and their respective water environments were taken from designated sampling points in the city of Blantyre and Malawi during the rainy and dry season in order to capture seasonal variations. The concentration of metals in S. aequinoctialis were higher than in the corresponding water environment in both seasons, but lower in the rainy season than the dry season. In the rainy season the concentrations were (in S. aequinoctialis and (water)): Mn 0.432- 5.641 mg/L (ND- 0.530 mg/L), Cd ND- 0.016 mg/L (0.07- 0.111 mg/L) and Pb ND- 0.965 mg/L (0.011- 0.098 mg/L). In the dry season the concentrations were: Mn 0.281- 16.132 mg/L (0.035- 0.626 mg/L), Cd 0.22- 0.912 mg/L (0.014- 0.111 mg/L) and Pb ND- 0.972 mg/L (ND- 0.23 mg/L). This study has shown that S. aequinoctialis has the capability of accumulating manganese, cadmium and lead. Therefore it can be used as a biological indicator for long term heavy metal water pollution monitoring. Key words: Heavy metals, accumulation, biological indicator, pollution, environment INTRODUCTION Malawi is a country located in Southern Africa and Blantyre is its industrial and commercial capital. The recent government policy is to change Malawi from a consuming to a producing nation. This will involve increase in agricultural production and industrial development (GoM, 2005). This means that as industrial and agricultural activities increase, pollution by heavy metals will likely increase. The majority of rivers of the world have been modified by human activities, which is widely recognized as the cause of global-scale habitat loss and degradation in the lotic environment (Nakano and Nakamura, 2006; Arnold and Beristain, 1993). This degradation of rivers could be due to agricultural and industrial activities. Studies done in Malawi have already shown heavy metal pollution in soils and water resources (Mumba et al., 2008; Sajidu et al., 2006; Msonda et al., 2003; Lakudzala et al., 1999; Zembere et al., 1999). This therefore shows that there is a need of looking at long term monitoring hence the use of the filamentous green algae; Spirogyra aequinoctialis in this study was observed. Although there are a number of organisms that can be used as indicators, invertebrates and periphyton (attached algae) are often used. Invertebrates are easy to collect, easy to identify in a laboratory, often live for more than one year, have limited mobility and are integrators of environmental condition. Examples of invertebrates commonly used as indicators are earthworms, midges and stoneflies. Periphyton are used because there is a naturally high number of species, they offer a rapid response time to both exposure and recovery, identification to a species level by experienced biologists is possible, ease of sampling, tolerance or sensitivity to specific changes in environmental condition are known for many species (United States Environmental Protection Agency (USEPA, 2005; Zaborski, 1998). Monitoring the distribution of toxins in the environment is important because it provides data required for planning, it helps in the determination of the health and condition of a particular environment, it provides a means to record environmental changes and trends over time and it helps in focusing conservation efforts by relevant authorities towards decision making (Roth et al., 1997; SWFWMD, 2006; NARAP, 2002). Studies done elsewhere have shown that algae have the ability of accumulating pollutants from the environment. Heavy metal tolerance has been demonstrated for green algae like Chlorella and Scenedesmus (Pinto et al., 2003), which is the most diverse group of algae, with more than 7000 species growing in a variety of habitats (Speer, 1998). In addition to the uptake of nutrients, algae can also take up toxic compounds such as heavy metals (Page et al., 2006; Qiming et al., 1999; White and Broadley, 2003). Bachofen et al., 2004, indicated that heavy metals in benthic algae and aquatic macrophytes give an average impact and may give more information than water measurements in intervals. Topcuoglu et al., 2003, showed that if pollutants levels in the environment decrease with time, therefore do the levels in algae. On the other hand if there is an increase in pollutants like heavy metals in the environment, then in algae the levels also increase. MATERIALS AND METHODS This study was carried out in two phases, first, during wet season (7th to 11th December, 2006) and secondly during dry season (14th to 18th July, 2007). Malawi, in common with greater part of south central Africa, has two main seasons during the year, which are the dry and the wet season. The wet season lasts from November to May and the remainder of the year is dry, with temperatures increasing until the onset of the next rains (BCA, 1995). Fig. 1 shows the sampling points which fell into two major categories, which were; streams and wastewater treatment plants (WWTP). Most of these streams pass through the major industrial areas except for Mangunda stream, which originates at Mzedi hill and passes through a dumpsite and Michiru stream, which originates from a forest reserve. Michiru stream was taken as a reference point. Algae sampling A total of eighteen algae samples were collected for each season. The samples were collected in 100 mL plastic bottles (DARES, 2004). The algae samples were chilled in a refrigerator pending analysis (NSW, 2002). Water sampling Water samples were collected at an area where algae; S. aequinoctialis were found. A total of forty three water samples were collected for each season. At each sampling point, water samples were collected in triplicates for heavy metal analysis and a single sample for pH analysis. Water samples were stored in 1 L polyethylene bottles and 1.5 mL concentrated nitric acid (AR) was added to those samples where heavy metals would be determined (APHA, 1985). Concentrated nitric acid is added to the water samples because it leads to a drop in pH therefore the loosely bonded ions can be released from suspended particulate matter. This will increase the metal content of water samples. Determination of metals in algae; S. aequinoctialis samples Algae samples were air dried (Hoffman, 1996). The air dried algae samples were then dry ashed in a furnace after adding nitric (AR) and hydrochloric acid (AOAC, 1990). Thereafter the sample was made up to 50 mL with distilled water in a volumetric flask. The samples were prepared in triplicates and blank and standard samples were used to check accuracy of analysis. The concentration of heavy metals was determined by running samples on AAS (Perkin Elmer, Analyst 700). Determination of metals in water samples Water samples were digested using concentrated nitric acid (AR). The sample was mixed and 50 mL was transferred to a beaker to which 5 mL concentrated nitric acid was added and brought to a boil on a hot plate to the lowest volume possible (15 to 20 mL). Filtration was done after digestion. The filtrate was then diluted to volume with distilled water in a 50 mL volumetric flask (APHA, 1985). The concentration of heavy metals was determined by running samples on AAS (Perkin Elmer, Analyst 700). Determination of water pH Water pH was determined by using the standard method as in APHA (1985) and buffers of pH 4 and 9 were used to calibrate the pH meter (Glass electrode pH meter model 601A Orion Research digital ionalyzer with pH reading to 0.01 in the range 0 to 14). The pH was measured on the same day of sampling. RESULTS AND DISCUSSION Manganese levels in water and algae The range of manganese concentration in water samples (rainy season) was from below detection limit to 0.530 mg/L. In dry season it was 0.035 - 0.626 mg/L (Table 1). Water samples indicated significantly higher levels of manganese in dry than rainy season (p < 0.05) which could be attributed to dilution. Mangunda stream manganese levels (rainy season), was the only one above Malawi Bureau of Standards (MBS, 2005) (0.05- 0.1 mg/L) and World Health Organization (WHO, 2006), (0.5 mg/L) drinking water standards. The possible source of manganese for Mangunda stream is surface runoff from the dumpsite or the sediments which could be in anoxic condition. In the dry season 83 % of the sampling points showed manganese levels above MBS range with 17 % above WHO standards. The possible sources of manganese pollution for the areas that showed levels above standards in the dry season are metal manufacturing industries, power plants, fertilizers and wastes. In the rainy season, the range of manganese concentration in filamentous green algae; S. aequinoctialis was 0.432 - 5.641 mg/kg while in the dry season it was 0.281-16.132 mg/kg (Table 1). S. aequinoctialis samples indicated significantly higher levels of manganese in the dry season than in the rainy season (p < 0.05). Water and S. aequinoctialis samples manganese levels were not strongly correlated (r = 0.298 for rainy season and r = -0.215 for dry season). However S. aequinoctialis samples indicated significantly higher manganese levels when compared to water samples for both seasons (p < 0.05). The concentration of manganese in both water and S. aequinoctialis at Michiru stream, which is in a forest reserve was not different from most of the places, however it was not among the highest values indicating that the other sampling places could have been polluted by anthropogenic sources. The possible sources of manganese for Michiru stream are deposition and rocks. The highest level of manganese in S. aequinoctialis recorded at Limbe stream at Mpingwe could be from fertilizers since there are gardens close to the stream. The water and S. aequinoctialis results agreed with studies done elsewhere. Pederson and Vaultonburg (1996) found the mean level of manganese found in water sampled from Embarras river, Illinois, USA to be in the range 0.082 0.464 mg/L while in attached algae sampled in the same area to be 391 4260 mg/kg. The possible source of higher manganese levels in the sampling area is the application of artificial fertilizers. Cadmium levels in water and algae Cadmium concentration range in water samples (rainy season) was 0.07 0.111 mg/L while in the dry season it was 0.014 0.111 mg/L (Table 2). Water samples indicated no significant differences for rainy and dry season cadmium levels (p > 0.05). In both seasons all the sampling points indicated water cadmium levels above MBS (0.003 0.005 mg/L) and WHO (0.003 mg/L) standards for drinking water. The possible sources of cadmium pollution for the streams in Blantyre are metal processing operations, burning fossil fuels, making and using phosphate fertilizers, and disposing of metal products. The filamentous green algae (S. aequinoctialis) rainy season cadmium concentration range was from below detection limit to 0.035 mg/kg while in the dry season it was 0.22 0.912 mg/kg (Table 2). S. aequinoctialis samples indicated significantly higher levels of cadmium in the dry season than in the rainy season (p < 0.05). Water and S. aequinoctialis samples cadmium levels were not strongly correlated (r = -0.255 for rainy season and r = 0.296 for dry season). In comparing water samples to S. aequinoctialis samples cadmium for both seasons, there were significant differences (p < 0.05). Water samples had high cadmium levels in the rainy season while in the dry season the levels were higher in S. aequinoctialis. The high cadmium values in water samples for rainy season could have come from surface runoff and sediments. The concentration of cadmium in both water and S. aequinoctialis at Michiru stream was not different from most of the places. This could be attributed to deposition and rocks. The highest level of cadmium in S. aequinoctialis at Blantyre WWTP (raw sewage) is from industries. This is because Blantyre WWTP handles industrial wastewater. It was only dry season water and S. aequinoctialis results of cadmium that agreed with studies done on the river Danube. Chmielewska and Medved (2001) found mean cadmium levels in lagoon water situated on the left bank of the river Danube to be 0.005 mg/L and in green algae; Cladophora glomerata sampled in that water to be 0.1 mg/kg. The possible source of higher cadmium levels in the sampling area are the industries. Lead levels in water and algae The range of lead concentration in water samples (rainy season) was 0.011 - 0.098 mg/L while in the dry season it was from below detection limit to 0.23 mg/L (Table 3). Water samples indicated no significant differences for lead in rainy and dry season (p > 0.05). In the rainy season 44 % of the sampling points indicated lead levels above MBS (0.01 0.05 mg/L) and WHO (0.01 mg/L) drinking water standards while in the dry season it was 61 % of the sampling points. The possible sources of lead pollution for Blantyre streams are vehicle emissions, industries like those involved in the manufacturing of lead-acid batteries and waste disposal. In the rainy season, the range of lead concentration in filamentous green algae; S. aequinoctialis was from below detection limit to 0.965 mg/kg while in the dry season it was from below detection limit to 0.972 mg/kg (Table 3). S. aequinoctialis samples indicated no significant differences for rainy season and dry season lead values (p > 0.05). Water and S. aequinoctialis samples lead levels were strongly correlated in the rainy season (r = 0.570) than in the dry season (r = 0.473). S. aequinoctialis samples indicated significantly higher lead values for both seasons when compared to water samples (p < 0.05). In the rainy season the concentration of lead in water for Michiru stream was the second lowest and in dry season water lead concentration was below detection limit. In S. aequinoctialis for both seasons lead concentration at Michiru stream was below detection limit. This indicates that lead concentration for the other areas was due to anthropogenic sources. The high lead concentration at Mudi and Nasolo streams at SRN is attributed to industries. The water and S. aequinoctialis results agreed with studies done elsewhere. Chmielewska and Medved (2001) found the mean level of lead to be 0.023 mg/L in lagoon water situated on the left bank of the river Danube and 7.9mg/kg in green algae (C. glomerata) found in the same water. The possible source of higher lead levels in the sampling area are the industries. Water pH In the rainy season, the pH range for water samples was 5.99 10.13 while in the dry season it was 5.98 9.68 (Fig. 2). In comparing the rainy season and dry season values, the differences were insignificant (p > 0.05). These results were not very different from the studies done by Sajidu et al. (2006) who found the range of pH to be 6.63 ± 0.14 9.38 ± 0.20 in streams and wastewater treatment plants of Blantyre. In both the rainy and dry season 6% of the values did not fall within MBS (5.0 9.5) pH range while 11% of the values did not fall within WHO (6.5 8.5) standard pH range. In the rainy season, 6 % of the samples had low pH as compared to 22 % in dry season, which increases the availability of metals in water because it dissolves metal-carbonate complexes, releasing free metal ions into the water column (Connell et al., 1984). CONCLUSION The study found that the concentration of manganese, cadmium and lead in the filamentous green algae; S. aequinoctialis was on the higher side as compared to that in water. The results showed that S. aequinoctialis accumulates heavy metals and can therefore be used as a biological indicator which was in agreement to studies done in other countries on other algae species. Water samples were also compared against WHO and MBS standards whereby most of the values under this study were above limits. It was also found that the general trend was that of high heavy metal values for water samples in the dry season than in the rainy season. The low heavy metal levels in the rainy season were attributed to dilution. ACKNOWLEDGEMENTS The authors would like to thank University of Malawi, The Polytechnic for funding this study. Authors are greatly indebted to Blantyre City Assembly (especially S. Kuyeli, A. Simenti and J. Rashid) for allowing to collect samples in places that they use for their routine monitoring work. Thanks should also go to F. Masumbu, J. Kumphanda, I. Mtewa, C. Mkukumira, O. Mbotwa and R. Kondwani of University of Malawi, Chancellor College Faculty of Science, all laboratory staff at Geological Surveys Department and E. Kathumba of National Herbarium and Botanical Gardens for their technical support. Authors would like to also thank Mrs. E. D. Chirwa, a statistician of Chancellor College Faculty of Science for the help in data analysis. Finally thanks to B. Thole for the time he spent checking the document. REFERENCES
© IRSEN, CEERS, IAU The following images related to this document are available:Photo images[st08052t1.jpg] [st08052f2.jpg] [st08052t2.jpg] [st08052t3.jpg] [st08052f1.jpg] |
| |||||||||
