 |
| About Bioline | All Journals | Testimonials | Membership | News |
|
||||||
|
||||||
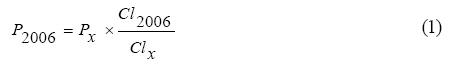
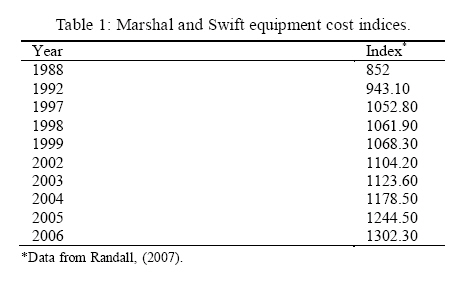
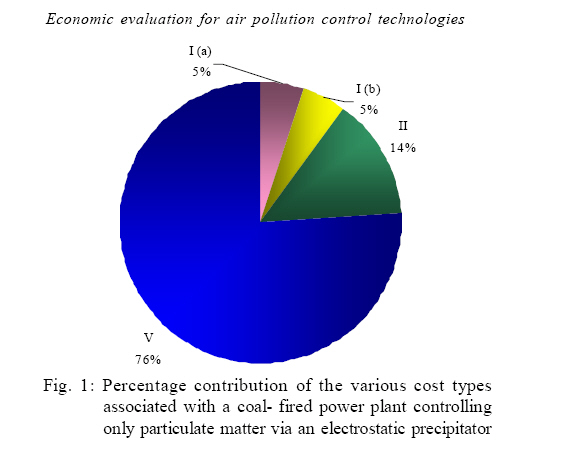
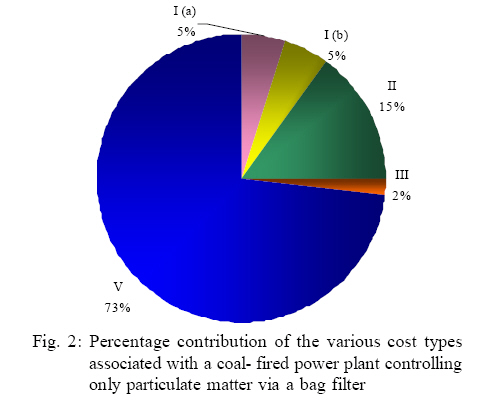
International Journal of Enviornmental Science and Technology, Vol. 5, No. 4, Autumn 2008, pp. 555-564 Short Communication Economic evaluation for air pollution control technologies selection in power plants processes 1 S. Soltanali; 2*Z. Shams Hagani; 3 M. Pazouki Yaftabadi 1 Department of Chemical Engineering, Faculty of Engineering, Tehran University, Tehran, Iran Code Number: st08062 ABSTRACT Air quality legislation is entering a transformation phase, shifting the concept of atmospheric emission control towards pollution prevention and emission minimization through a more integrated approach. This transformation, along with public pressure and increased foreign trade, is providing industries with incentives to consider their effect on the environment and to take action where required. To assist industries in determining what air pollution control technologies are best suited to power plants; an assessment of air pollution control technologies used in other countries was carried out. This assessment concluded that the best available technologies for power plants to control air emissions are electrostatic precipitators, low-NOX burners, selective catalytic reduction systems and wet flue gas desulphurization (limestone) systems. An assessment of the financial effects associated with air pollution control at power plants was conducted by completing a cost analysis. This analysis demonstrated that by increasing capital expenditure on control technologies by US$ 0.25 billion, the external costs associated with producing electricity can be reduced by almost US$ 0.5 billion. Formulation of external cost factors and the development of a software database for the information obtained from the different countries, will promote future technology selections. Key words: Environmental engineering group, environmental costing model, equipment costs, life cycle assessment, external cost INTRODUCTION In most large industrial facilities, combustion plants (power plants) are applied according to the owner's demands or requirements as either large utility plants or industrial combustion plants; providing electricity, steam or heat to industrial production processes (Saeedi and Amini, 2007; Patiño-Echeverri et al., 2007). For the purpose of this investigation, the focus was on large utility plants (power stations) that use coal in conventional steam-producing thermal power plants for the generation of electricity. Power plants generate a number of residues, wastes and large amounts of emissions to all environmental media (Rahbar and Kaghazchi, 2005; Thacker, 2006). The most important emissions to air from the combustion of coal are SOX, NOX, CO, particulates and greenhouse gases such as carbon dioxide (Javid and Lak, 2007; Soltanali and Shams Hagani, 2008; Karbassi et al., 2007). Other substances such as heavy metals, hydrogen fluoride (HF), hydrogen chloride (HCl), halide compounds, unburned hydrocarbons, non-methane volatile organic compounds and dioxins are emitted in smaller quantities (European IPPC Bureau, 2005; USEPA, 2005, Ardjmand et al., 2005). Good combustion practices and good combustion control along with energy efficiency measures (Karbassi et al., 2008) will aid in the prevention and control of air pollution emissions, regardless of the type of fuel used, the combustion method followed and the size of a facility (European IPPC Bureau, 2005; USEPA, 2005; Abbaspour and Soltaninejad, 2004; Cho and Michelangeli, 2008; Wang et al.,2008). It should also be noted that the type of flue gas desulphurization (FGD) technique used for the prevention and control of SOX depends on the type of combustion method, the output, and whether the plant is new or existing. Similarly for the prevention and control of NOX a combination of combustion modifications and flue gas treatment (FGT) can be used; depending on the output, the fuel used and whether the plant is new or existing (European IPPC Bureau, 2005; Cherp et al., 2003). The most important air emissions that have to be controlled from a coal-fired power plant are particulate matter (PM), sulphur oxides (SOX), nitrogen oxides (NOX) and to a lesser extent carbon monoxide (CO), certain heavy metals, hydrogen chloride (HCl) and hydrogen fluoride (HF). For the control of particulates from coal-fired power plants, electrostatic precipitators (ESP) and/or fabric filters can be selected. Both of these control technologies provide a removal efficiency of 99.9 % for particulates, and removal efficiencies of 90 % for heavy metals such as arsenic, cadmium, chromium, lead and nickel (Cooper and Alley, 2002; Giri et al., 2007). Both ESPs and fabric filters are recommended technologies for particulates and heavy metals removal by the UK and the EU and are in use in more than 7 (ESPs) and 12 (fabric filters) records from the RBLC database. For final selection the electrostatic precipitator was chosen as the control technology for particulates and heavy metals removal since the device is not as sensitive to high temperatures as fabric filters, and since ESPs have been proven to work effectively in power plants (Eskom Holdings Limited, 2002). Cyclones are also recommended for PM removal by the UK, EU and by records from the RBLC database, but should only be used as pre-cleaners upstream of the primary collection device; for example,an electrostatic precipitator, where dust loading is high. Controlling SOX emissions from coal-fired power plants should, where possible and economically feasible (Shams-Hagani et al., 2007), be controlled first and foremost by switching or changing fuel.This is recommended by the UK, EU and various RBLC records. Flue gas desulphurization (wet, semi-dry and dry) is the most highly recommended control technology for the control of SO2, being recommended by the UK and the EU and is in use in more than 14 RBLC records. Flue gas desulphurization technologies, such as spray dryers, can also effectively remove HCl and HF. For final selection wet flue gas, desulphurization with limestone was chosen as the control technology for SO2 and possibly HCl and HF emissions from coal-fired power plants. This control technology offers the highest removal efficiency (90- 98 %) (Cooper and Alley, 2002) and is the preferred technology for coal-fired electric utility power plants (USEPA, 2003a). For the prevention and control of NOX a combination of combustion modifications and flue gas treatment (FGT) can be used (European IPPC Bureau, 2005; Hrastel et al., 2007). Low-NOX burners were selected as the combustion modification to be used. Low-NOX burners are recommended by the UK and the EU and are in use in more than seven RBLC records. Low-NOX burners can reduce NOX emissions by 40-60% and can be used on both new and existing facilities (Cooper and Alley, 2002). The flue gas treatment that was selected is selective catalytic reduction (SCR). A SCR system is the recommended control technology for the UK and the EU and is in use in more than seven RBLC records. SCR systems are the most developed and widely spread FGT technology and can remove 60-90 % of NOX from flue gases (Cooper and Alley, 2002). Selective non-catalytic reduction (SNCR) systems are also recommended to a great extent but the removal efficiency is lower (40-60 %), the operating temperature is higher (900 °C 1000 °C) and the technology is not as well developed and wide spread as the SCR (Cooper and Alley, 2002; Chaaban et al., 2004). Good combustion practices and control is the only way to reduce carbon monoxide (CO) emissions from coal-fired power plants. Proper practices and control will ensure complete or near complete combustion, which consequently reduces CO emissions. The basis of the study was a hypothetical 3600 MW (six 600 MW units) power plant. The analysis was done over the time span of one production year, assuming 330 days of production, and it was assumed the power plant operates at 85 % capacity on average. It was further assumed that the air pollution control technologies operated at their full design control efficiency. MATERIALS AND METHODES The EEGECOST model The EEGECOST model was developed to promote environmental accounting in south Africa. The EEGECOST model (Environmental Engineering Group environmental costing model) is based on the principles of the total cost assessment (TCA) environmental accounting system. The objective of the model is to fully understand the cost significance of environmental and human health related decisions, activities and consequences over the whole life cycle of a product or process. The structure of the model and consists of five steps for analysis (De Beer and Friend, 2005): (1) objective statement and scope of analysis, (2) life cycle assessment, (3) cost inventory, (4) impact assessment, and (5) document results and assumptions. The model is a spreadsheet-based program and consists of pathways that the user must follow in specific analysis. These different pathways depend on the objective statement and scope of analysis, and the amount of data the user needs to acquire (De Beer and Friend, 2005). Compiling an objective is the first step of the EEGECOST model. This entails a background of the company and provides some informative value to the product or process being considered. The scope of analysis determines the time frame that is desired for the analysis and the type of cost comparison (De Beer and Friend, 2005). The next step of the EEGECOST model is the life cycle assessment (LCA) of the process or product being considered. The LCA is a procedure that is determined by a company's own specific guidelines. Therefore, the model does not support an LCA procedure in itself, but only the output of a relevant LCA is used as input to the model (De Beer and Friend, 2005). The LCA for environmental accounting systems entails coupling a quantitative value to environmental impacts associated with a project by (Little, 2000). Compiling an inventory of relevant energy and material inputs and environmental releases, evaluating the potential environmental and social impacts associated with identified inputs and releases, and interpreting the results to make informed decisions. Coupling a quantitative life cycle assessment to an environmental accounting system provides a comprehensive view of the environmental impacts of a project and a more accurate picture of the true environmental trade-offs, with associated financial effects (USEPA, 2001). During the third step of the EEGECOST model, output from the LCA of the process or product is allocated to cost types to be used in the environmental cost inventory. The model allocates environmental costs to the following cost types (De Beer and Friend, 2005): Type I: site costs, Type II: corporate costs, Type III: impact costs, Type IV: internal intangible costs, and Type V: external costs. Type I costs are further subdivided in Type I(a) non-recurring site costs and Type I (b) recurring site costs. After allocation to cost types, the output from the LCA is translated to an economic value. Economic values are calculated by recording/entering all relevant present and future environmental costs and revenues in cost inventory forms. These forms are categorized into the following environmental media groups (De Beer and Friend, 2005): air and climate, wastewater, soil and groundwater, noise and vibration, biodiversity and landscape radiation, and other costs. Since only the financial effects associated with air pollution and air pollution control was being considered in this cost analysis, use was only made of the air and climate environmental media group. The final report compiled by the EEGECOST model can be compiled according to a company's specific regulations, incorporating the reported values as given in the costs incurred by type form, the cost types by year form and the cost report form of the model (De Beer and Friend, 2005). Calculations The EEGECOST model was used to study the financial effects of controlling air pollution from a coal-fired power plant.The basis of the study was a hypothetical 3600 MW (six 600 MW units) power plant. The analysis was done over the time span of one production year, assuming 330 days of production, and it was assumed the power plant operates at 85 % capacity on average. It was further assumed that the air pollution control technologies operated at their full design control efficiency. Three different control regimes were analyzed with the aid of the EEGECOST model: Control regime 1: Hypothetical power plant with only control of particulate matter via an electrostatic precipitator (ESP) with 90 % operating efficiency. This was done efficiencies between 90 % and 99 %, and newer ESPs between 99 % and 99.9 % (USEPA, 2003e). Control regime 2: Hypothetical power plant with only particulate matter control in place in the form of a 99.9 % efficient bag house (fabric filter). This was done in order to represent a newer plant with a bag house employed for air pollution control. Control regime 3: Hypothetical power plant with full pollutant control in place in the form of the final selected control technologies: 99.9 % efficient ESP, 60 % efficient low-NOX burners, 90 % efficient selective catalytic reduction (SCR) system, and 98 % efficient wet flue gas desulphurization (FGD) system with limestone. The purpose of the cost analysis was to show that the external costs or damage costs would be greatly reduced if proper air pollution control technologies were utilized. Only the financial effects associated with air pollution and air pollution control were considered in the cost analysis. Since the costs that were obtained for the cost analysis were not all in $ value for the year 2007, the costs had to be adjusted to compensate for any price increases due to inflation and other factors. Cost adjustments were done using the Marshall and Swift equipment cost index Table 1.) and the following equation (Cooper and Alley, 2002):
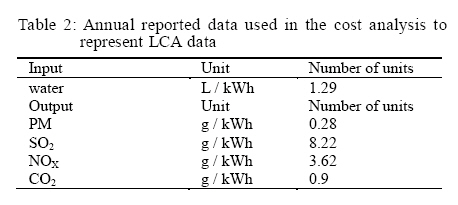
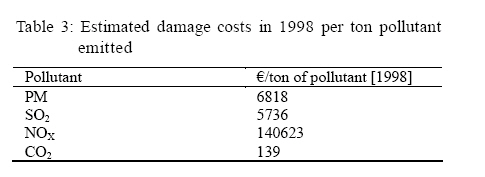
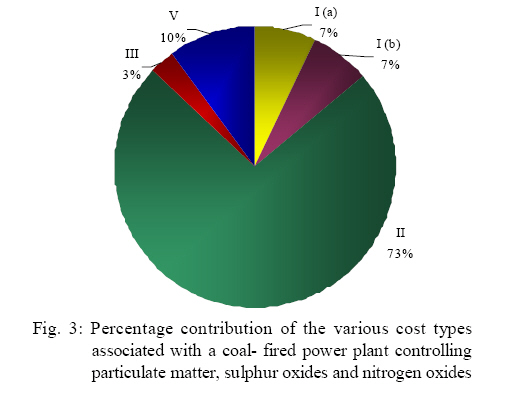
Since the most recent cost index available is for the year 2006, the cost analysis was done by adjusting costs for 2006. In some cases, the capacity of a required piece of equipment differed in capacity of a known piece of equipment with a known price. The following equation was used to adjust costs where necessary (Cooper and Alley, 2002): P2 =P1 (C2 /C1 )0.6 (2) The following costs were obtained from various literature sources and, where required, adjusted using (2) Eq. (1) and Eq. (2) These costs were then inserted into the EEGECOST model, following the sequential steps of the program. Equipment Costs Equipment costs were obtained by sizing literature costs based on a 3600 MW power plant, using efficiencies as stated. Electrostatic precipitator For this cost analysis two different electrostatic precipitators (ESPs), an older ESP with 90 % control efficiency and a new ESP with a control efficiency of 99.9 %, were used. The purchase cost of an ESP can be estimated as a function of the collection plate area as follows (Cooper and Alley, 2002): P = 962 A0.628 (3) The nett plate area can be calculated by using Eq. (4) (Cooper and Alley, 2002): A= (-Q / We) ln (1-η) (4) The delivered equipment cost (DEC) can be estimated with Eq. (5) and the total installed cost (TIC) can be estimated with Eq. (6) (Cooper and Alley, 2002): DEC = P × 1.18 (5) TIC = DEC × 2.22 (6) From Eq. (4) the nett plate areas for the two ESPs were calculated using a drift velocity of 6 m/min. and assuming the plate consisted of six 600 MW units, each treating 3333 m3/min flue gas(Eskom Holdings Limited, 2003): A90% = (-3333/6) ln (1-0.90) = 127921 m2 =13769 ft2 A99.9% = (-3333/6) ln (1-0.90) = 387364 m2 =41308 ft2 Since both the 90 % and the 99.9 % ESPs nett plate areas are less 50000 ft2; Eq. (3) can be used to calculate the purchase costs as follows: P90%= US$ 382307 per 600 MW unit P99.9%= US$ 762158 per 600 MW unit Using equations (5) and (6), the total installed cost (TIC) calculated: TIC90%= US$ 1001492 per 600 MW unit TIC99.9%= US$ 1996548 per 600 MW unit For a 3600 MW power plant the total installed cost is: TIC90%= US$ 6008953 Unfortunately, estimates for operating costs for ESPs are not widely available. However, one reference stated that the annual operating cost of a unit treating 1416 m3 / min gas was $ 220000 in 1998 (STEP, 2005). This cost was adjusted to a unit treating 200000 m3 / h. (3333 m3 / min) flue gas with Eq. (2): Poperating = 220000(3333/1416)0.6 = US$ 367740 per 600 MW unit in 1988. Adjusting the 1988 operating cost to the 2006 value, Eq. (1) was used: Poperating, 2006 = 367740(1302.3 / 852) = US$ 562100 per 600 MW unit. Fabric Filter The purchase cost of a bag house system (fabric filter) can be estimated as a function of gross cloth area. Eq.(7) was used to calculate the gross cloth area of the bag house system (Cooper and Alley, 2002): GCA = Q / V (7) From data, a gross cloth area of 58858 ft2 for a 600 MW unit was calculated. Since the gross cloth area is greater than 30000 ft2 but smaller than 70000 ft2, a large shaker bag house was selected and Eqs. (8) to (10) used to estimate the purchase cost of a bag house (Cooper and Alley, 2002): BBP= US$ 96230+ US$ 3.33 × GCA (8) SSA= US$ 51280 + US$ 1.43 × GCA (9) INS = US$ 26330 + US$ 0.57 × GCA (10) The total purchase cost of the bag house system is the bag house price plus the cost of the bags. Shaker loop top bags were selected and the bag price was estimated with Eq. (11) (Cooper and Alley, 2002): BP = 0.63 × GCA (11) With the gross cloth area available, the bag house price was calculated with Eqs. (8) to (11): BBP = US$ 96230 + US$ 3.33 × 58858 = US$ 292226 per 600 MW unit in 1998, SSA = US$ 51280 + US$ 1.43 × 58858 = US$ 135447 per 600 MW unit in 1998, INS = US$ 26330 + US$ 0.57 × 58858 = US$ 59879 per 600 MW unit in 1998, and BP = 0.63 × 58858 = US$ 37080 per 600 MW unit in 1998. The total bag house purchase cost is: P = BBP+SSA+INS+BP = US$ 524632 per 600 MW unit in 1998 The delivered equipment cost (DEC) can be estimated with Eq. (12) and the total installed cost (TIC) can be estimated with Eq. (13) (Cooper and Alley, 2002): DEC = P × 1.18 (12) TIC = DEC × 2.19 (13) Using Eq. (12) and (13), TIC = US$ 1355755 Adjusting the 1998 cost to the 2006 value, Eq. (1) was used: TIC2006 = 1355755(1302.3 / 1060.90) = US$ 1434528 per 600 MW unit. Low NOX burners Low-NOX burners appear to be very cost effective, yielding 40 %-60 % reductions at a capital cost of about 6-9 $/kW (STEP, 2005; Cooper and Alley, 2002). Based on the calculated capital cost of US$ 27 million, the capital cost in 2006 was US$ 33272237. Selective catalytic reduction system The capital costs for selective catalytic reduction (SCR) and selective non-catalytic reduction systems (SNCR) have significantly declined in the last 20 years, due to improved designs and more familiarity with the technology (Cooper and Alley, 2002). The capital cost of a SCR in 1997 was estimated at between 44-66 US$/kW with a 70-80 % control efficiency (STEP, 2005; Cooper and Alley, 2002), and the operating cost of a SCR system in 1997 was estimated between 1.60-3.25 US$/MWh (STEP, 2005). Based on the calculated capital cost of $ 198 million, the capital cost in 2006 was US$ 243 million and with the operating cost calculated at US$ 59 million, the operating cost in 2006 was US$ 72 million. Wet flue gas desulphurization with limestone The technology of flue gas desulphurization (FGD) systems is now more advanced than it was in the 1970s, and costs have decreased. Nevertheless, FGD systems still represent a huge investment, as much as 20 % of the capital cost of a new coal-fired power plant (Cooper and Alley, 2002). The capital cost for a FGD system can be estimated at between 100-250 US$/kW and the operating cost at between 20-50 US$/kW (USEPA, 2003a). Based on the calculated in 2002, capital cost of US$ 630 million, the capital cost in 2006 was US$ 7.4 million and with the operating cost calculated at US$ 126 million, the operating cost in 2006 was US$ 149 million. Life cycle assessment (LCA) Life cycle assessment data is specific to every plant and every situation. However, since this analysis is based on a hypothetical 3600 MW plant, annual reported data representing a number of power plants was used. Typically, life cycle data is more complete, but for the purpose of this analysis, the annual reported data given in Table 2. was used to represent LCA data for the hypothetical plant. Other inputs to the process, for example coal and electricity, were not available as intrinsic values and the total cost spent on primary energy was used to determine these relevant costs. The data shown in Table 2 was converted to mass values for one production year. In order to calculate the pollutants emitted for each control regime, the yearly mass values were reduced according to the applicable removal efficiency of the control technologies in place. For Control regime 1 no reductions were applied since it was assumed that the data in Table 2. applies to a power plant with a 90 % efficient ESP already in place. External costs Adjustment of estimated damage costs (Table 3) using Eq. (1): PSO2, 2006 = 6818(1302.3 / 1061.90) = € 8361.5 PNOx, 2006 = 5736(1302.3 / 1061.90) = € 7034.56 PPM, 2006 = 14063(1302.3 / 1061.90) = € 17246.7 PCO2, 2006 = 139(1302.3 / 1061.90) = € 170. Other costsInsurance for environmental liabilities Insurance for environmental liability includes the annual contribution to insurance against traditional damage to persons, goods and biodiversity caused by dangerous and potentially dangerous activities and, insurance for transportation of hazardous materials (De Beer and Friend, 2005). An amount of US$ 1.8 million was allocated for pollution control costs, rehabilitation and any future closures based on a 3600 MW power plant for one production year. The EEGECOST model automatically allocates insurance costs as Type II costs. Provisions for environmental management These costs include future expenses related to, for example, remedial activities, equipment repairs and governmental and public hearings that can result due to an accidental event; for example, air emission releases due to control equipment breakdown (De Beer and Friend, 2005). An amount of US$ 12.2 million was allocated for non-current liabilities like future pollution control costs and future rehabilitation costs. This cost is based on a 3600 MW power plant for one production year. Any provisions are automatically allocated as Type III costs by the EEGECOST model. Research and development Research and development accounts for extra expenses related to internal environmental related research and development projects. Research and development costs can be allocated as either Type I or Type II costs, based on the company's own regulations (De Beer and Friend, 2005). For the purpose of this cost analysis 40 % was allocated to Type I costs and 60% was allocated to Type II costs. An amount of $ 0.3 million was allocated for research and development for a 3600 MW power plant for one production year. General direct costs Direct costs represent direct capital outlay and include raw materials like primary energy and water and any other auxiliary materials that become part of the product. Direct costs can be allocated as either Type I or Type II costs, based on the company's own regulations (De Beer and Friend, 2005). For the purpose of this cost analysis 40 % was allocated to Type I costs and 60 % was allocated to Type II costs. An amount of $13.6 million is paid annually for water and an amount of $139.7 million is paid annually for primary energy, which includes coal and electricity. A further amount of $ 12 million is paid annually for other materials. These costs were all based on a 3600 MW power plant for one production year. RESULTS AND DISCUSSION The purpose of this cost analysis was to show specifically the financial effects of controlling air pollution. This was done by inserting all aforementioned costs into the EEGECOST model and consequently comparing the external costs (Type V) of the different analyses. Special attention was paid external costs since it was assumed that, apart from the extra expenditure on control equipment; all other costs would stay fairly constant for the different analyses. External costs are furthermore becoming more relevant since these costs are not taken into account when making decisions but are real to members of society (European Commission, 2001). Valuing external costs therefore allows these values to be included and considered during decision making (European Commission, 2001). For control regime 1, a hypothetical 3600 MW power plant was analyzed for one production year. All the costs were inserted into the EEGECOST model and the model automatically assigned the costs to the different cost types. In all analyses, a discount rate of 12 % was used for Type I to IV costs, which are internal to the company, and a discount rate of 3 % for Type V costs, which are external to the company. It is important to note that in the cost analysis attention was only on the financial effects of air pollution and air pollution control. The percentage contribution by cost type for a 3600 MW coal-fired power plant for one production year with Control regime 1 is shown in Fig. 1. Type V costs (external costs) contribute 74 %, and Type II cost, which is mostly the capital cost of the control equipment, contribute 14 %. The external costs seem exaggerated since the only large capital expenditure in the analysis is that of the ESP. For Control regime 2 the same hypothetical 3600 MW power plant was analyzed, but in this analysis the air pollution control device was a 99.9 % efficient fabric filter (Fig. 2). There is little difference between Control regime 1 and 2; with an external cost reduction of only 1%. This can be contributed to the fact that the two control devices are fairly similar in efficiency and capital expenditure. In the last analyses the hypothetical 3600 MW power plant was analyzed with Control regime 3 in place. All the major pollutants are being controlled to some extent, except for carbon dioxide (CO2). Fig. 1 shows the percentage contribution by cost type for a 3600 MW coal-fired power plant for one production year with control regime 3. The external costs are significantly reduced by 64 % if all the major air pollutants are controlled. However, it is also important to note that Type II cost have now increased to 73 %. From Fig. 1, 2, 3 the external costs were reduced by almost 64% by controlling all the major air pollutants through increasing the capital expenditure on control technologies with 58 %. The percentage contribution of the external costs are so high since these costs have to be carried by individuals, the environment and society every year, while the capital expenditure on air pollution control technologies are depreciated over their depreciable life. Furthermore, only the effect of air pollution and controlling air pollution are included in the analyses. CONCLUSION The future of air quality legislation is standing on the verge of a major transformation, shifting the concept of atmospheric emission control towards pollution prevention and emission minimization through a more integrated approach. This transformation, along with increased foreign trade, is providing industries with incentives to consider their effect on the environment and to take action where required. The knowledge and experience gained from other countries in this regard is a valuable asset and was used to determine what technologies are best suited to power plants, gasification and refining processes. Therefore, with the information sourced from other countries the following conclusions were made regarding the best available technologies or techniques suited to power plants: an electrostatic precipitators for particulates and heavy metal control, low-NOX burners for reducing nitrogen oxide formation in the boiler or furnace, selective catalytic reduction systems for NOX control, and wet flue gas desulphurization with limestone for SOX control. A cost analysis conducted for a power plant with selected air pollution control technologies in place demonstrated that the selected technologies worked well to reduce the external cost associated with producing electricity by almost $ 0.5 billion. This reduction in external cost was brought about by increasing the capital expenditure on control technologies by $ 0.25 billion. Even though the cost of controlling air pollution is high, it resulted in a considerable reduction in external cost that normally has to be carried by the environment, society and individuals. Nomenclature A nett plate area [ft2] BBP basic bag house price [US$, 1998] BP bag price [US$, 1998] C1 capacity of known equipment C2 capacity of new equipment Clx cost index for relevant year x Cl2006 : cost index for 2006 GCA gross cloth area [ft2] INS insulation add on [US$, 1998] P purchase cost, [US$, 1998] Px cost index in year x P1 price of known equipment P2 price of new equipment P2006 cost in 2006 Q volumetric flow rate [ft3/ min or m3/ min.] SSA stainless steel add on [US$, 1998] V maximum filtering velocity [ft / min.] We drift velocity [ft / min or m / min.] Greek Symbols η collection efficiency REFERENCES
© IRSEN, CEERS, IAU The following images related to this document are available:Photo images[st08062t2.jpg] [st08062f3.jpg] [st08062f2.jpg] [st08062t1.jpg] [st08062t3.jpg] [st08062f1.jpg] |
| |||||||||
