 |
| About Bioline | All Journals | Testimonials | Membership | News |
|
||||||
|
||||||
International Journal of Enviornmental Science and Technology, Vol. 6, No. 2, Spring, 2009, pp. 175-182 Impact of discharge wastewater effluents on the physico-chemical qualities of a receiving watershed in a typical rural community E. O. Igbinosa, A. I. Okoh Applied and Environmental Microbiology Research Group (AEMREG), Department of Biochemistry and
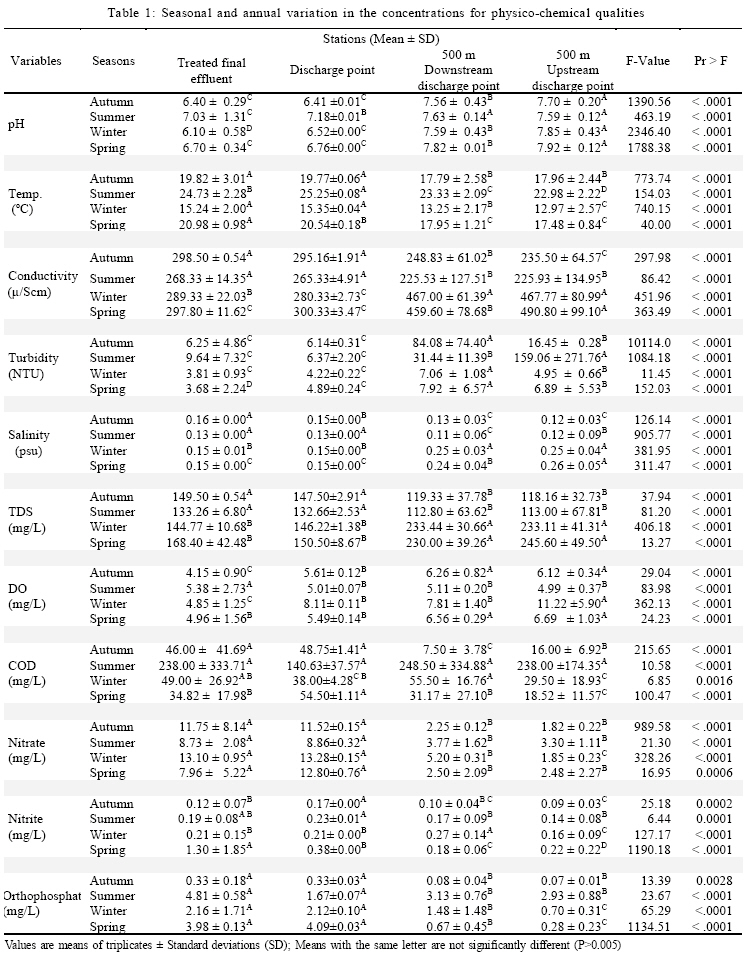
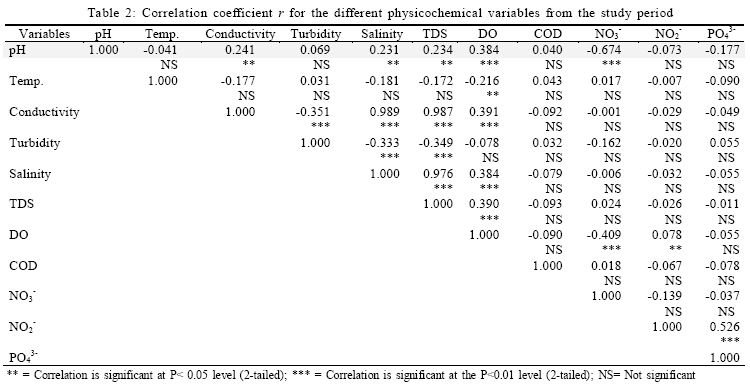
Microbiology, University of Fort Hare, Private Bag X1314, Alice 5700, South Africa Received 11 December 2008; revised 19 January 2009; accepted 22 February 2009 Code Number: st09018 ABSTRACT The qualities of the treated final effluents of a wastewater treatment plant located in a rural community of the Eastern Cape Province of South Africa were assessed over the duration of 12 months. Parameters measured include pH, temperature, electrical conductivity, salinity, turbidity, total dissolved solid, dissolved oxygen, chemical oxygen demand , nitrate, nitrite and orthophosphate levels and these were simultaneously monitored in the treated final effluents and the receiving watersheds using standard methods. Unacceptably, high levels of the assayed parameters were observed in many cases for chemical oxygen demand (7.5-248.5 mg/L), nitrate (1.82-13.14 mg/L), nitrite (0.09-1.3 mg/L), orthophosphate (0.07 - 4.81 mg/L), dissolved oxygen (4.15-11.22 mg/L) and turbidity (3.68-159.06 NTU) during the study period and are severally outside the compliance levels of the South African Guidelines and World Health Organization tolerance limits for effluents intended for discharge through public sewers into receiving watersheds. The study has revealed that there was an adverse impact on the physico-chemical characteristics of the receiving watershed as a result of the discharge of inadequately treated effluents from the wastewater treatment facility. This poses a health risk to several rural communities which rely on the receiving water bodies primarily as their sources of domestic water. There is need for the intervention of appropriate regulatory agencies to ensure production of high quality treated final effluents by wastewater treatment facilities in rural communities of South Africa. Keywords: Orthophosphate, nitrate, chemical oxygen demand, dissolved oxygen, conductivity, total dissolved solid INTRODUCTION Sewage discharge is one of the problems presently facing South Africa and several efforts are being vigorously pursued to control it. Water contaminated by effluents from various sources is associated with heavy disease burden (Okoh et al., 2007) and this could influence the current shorter life expectancy in the developing countries compared with developed nations (WHO, 2002). In developing countries, most of which have huge debt burdens, population explosion and moderate to rapid urbanization, people rely heavily on water sources of doubtful quality in the absence of better alternatives, or due to economic and technological constraints to adequately treat the available water before use (Aina and Adedipe, 1996; Calamari and Naeve, 1994). The scarcity of clean water and pollution of fresh water has therefore led to a situation in which one-fifth of the urban dwellers in developing countries and three quarters of their rural dwelling population do not have access to reasonably safe water supplies (Lloyd and Helmer, 1992) Assessment of water and wastewater is very crucial to safeguard public health and the environment (Okoh et al., 2005; 2007). However, water quality data on fresh and marine waters in South African are still sparse and uncoordinated. Therefore, monitoring these parameters is important for safety assessment of the environment and human public health in particular (Okoh et al., 1996; 2007). Morrison et al. (2001) reported the impact of Keiskammahoek sewage treatment plant on the Keiskamma River water quality while Fatoki et al. (2003) have recently evaluated the physicochemical quality of Keiskamma River and in the impoundment downstream in Eastern Cape, South Africa and concluded that the level of electrical conductivity, nitrate, orthophosphate and oxygen-demanding substance were above the South Africa guideline values. Sewage discharges are a major component of water pollution, contributing to oxygen demand and nutrient loading of the waterbodies; promoting toxic; algal blooms and leading to a destabilized aquatic ecosystem (DWAF and WRC, 1995; Morrison et al., 2001; WRC, 2000). The problem is compounded in areas where wastewater treatment systems are simple and not efficient, as is the case in most rural communities in the Eastern Cape Province of South Africa. In this study, the impact of the treated final effluents of a rural wastewater treated facility has been evaluated in the Eastern Cape Province of South Africa on the physicochemical quality of the receiving watershed. MATERIALS AND METHODS Plant description and study site The wastewater treatment facility is situated at geographical coordinates of 32o50' 36' S, 26o55' 00' E and approximately 1 km East of Alice town in the Eastern Cape Province of South Africa. The plant which has a design capacity of the plant is 2000 m3/day receives domestic sewage, some light industrial wastewater, as well as run-off water and treatment is based on the activated sludge system. The treated final effluent is discharged into the Tyume River. Sampling Water samples were collected from the treated final effluent, discharge point, 500 m downstream and upstream of the discharge point. Samples were collected monthly between August 2007 and July 2008. Samples were collected in glass containers, pre-cleaned by washing with non-ionic detergents, rinsed in tap water, 1:1 hydrochloric acid and finally with deionised water. Before sampling, the bottles were rinsed three times with sample water before being filled with the sample. The actual samplings were done midstream by dipping each sample bottle at approximately 20-30 cm below the water surface, projecting the mouth of the container against the flow direction. The samples were then transported in cooler boxes containing ice to the Applied and Environmental Microbiology Research Group (AEMREG) Laboratory at the University of Fort Hare, Alice for analyses within 2 to 4 h after collection. Physicochemical analysis All field meters and equipments were checked and calibrated according to the manufactures specification. pH, temperature, electrical conductivity, total dissolved solids (TDS), salinity and dissolved oxygen (DO) of the samples were determined onsite using a multiparameter ion specific meter (Hanna instruments, version HI9828). The turbidity was measured onsite using a microprocessor turbidimeter (HACH Company, model 2100P). The concentrations of orthophosphate as P, nitrate, nitrite and chemical oxygen demand (COD) were determined in the laboratory by the standard photometric method (DWAF, 1999) using the spectroquant NOVA 60 photometer (Merck Pty Ltd). Samples for COD analysis were digested with a thermo reactor model TR 300 (Merck Pty Ltd.) and then analyzed by the spectroquant NOVA 60 photometer (Merck Pty Ltd.). Blank determinations were performed for COD, nitrate, nitrite and orthophosphate and results were adjusted for blank measurement in the presented results. New standards were created for each parameter during every measuring month. Statistical analysis The obtained data were subjected to descriptive statistical analysis (95 % confident limit). The general linearized model (GLM) of SAS was used to generate analysis of variance (ANOVA), means, standard error and range. Duncan multiple range test (DMRT) was used to test differences among all possible pairs of treatments. Correlation was performed using Proc Corr procedure of SAS (SAS version 8, SAS Institute, Cary, NC). Results and Discussion The results of the physicochemical qualities of samples from the different points are as shown in Table 1. The pH regimes vary significantly (P < 0.05) in the sample points throughout the study period and ranged from 6.40 to 7.70 during autumn; 7.03 to 7.63 during summer; 6.10 to 7.85 during winter and 6.70 to 7.92 during spring. In particular, pH of the treated final effluent varies between 6.10 and 7.03. Generally, the obtained pH values fall within the World Health Organization standard of 7.0 to 8.5 and the water quality ranges 6.5 to 8.5 for drinking water and water meant for full contact recreation, respectively (DWAF, 1996b; WHO, 1984; 1989). The EU also sets pH protection limits of 6.0 to 9.0 for fisheries and aquatic life (Chapman, 1996). The neutral to alkaline pH values obtained in most sampling points is similar to that reported elsewhere (Morrison et al., 2001). The temperature profile of the treated final effluent and receiving waterbody varies significantly (P < 0.05) and ranged from 17.79 to 19.82 °C during autumn; 22.98 to 24.73 °C during summer; 12.97 to 15.24 °C during winter and 17.48 to 20.98 °C during the spring. The treated final effluents in particular had temperature ranges of 15.24 to 24.73 were below 25 °C, which is the recommended limit for no risk according to the South African water quality guidelines for domestic use (DWAF, 1995). Based on these guidelines, the temperature of the effluent does not appear to pose any threat to the homeostatic balance of the receiving water bodies, in conformity with the report of Jaji et al. (2007). The electrical conductivities of the water samples generally varied significantly (P < 0.05) and ranged from 225.53 to 490.80 µ/Scm throughout the study period with the treated final effluent samples ranging between 268.33 and 298.50 µ/Scm (Table 1). Higher conductivities were observed upstream and downstream of the discharged points in winter and spring seasons, suggesting that there could be other point sources pollution entering into the receiving waterbody that resulted in the high values. The South African guideline for conductivity in effluent that could be discharged into the receiving waterbodies is 250 µ/Scm (Government Gazette, 1984) and based on this guideline, the effluent quality does not appear to be compliant with the regulation for electrical conductivity. The South African acceptable limit for conductivity in domestic water supply is 70 µ/Scm (DWAF, 1996a). This limit was exceeded in the receiving waterbody. Thus, the parameter does give concern and it could make the water unsuitable for direct domestic use. The conductivity values obtained in this study is similar to the findings of previous study on the nearby Keiskamma River (Fatoki et al., 2003). The turbidity profile varies significantly (P < 0.05) amongst the sample points throughout the study period and ranged from 6.25 to 84.08 NTU during autumn; 9.64 to 159.06 NTU during summer; 3.81 to 7.06 NTU during winter and 3.68 to 7.92 NTU during spring season (Table 1). In particular, turbidity of the treated final effluent varies between 3.68 and 9.64 NTU, but there is no standard for turbidity of effluent discharge in South Africa (Government Gazette, 1984). The turbidity values obtained from the stations in all seasons was higher than WHO standard of 5 NTU (WHO, 2004). None of the receiving waterbody met the South African guideline of 0 to 1 NTU for turbidities in water for domestic use (DWAF, 1998). These values are grossly exceeded in the water samples and it disqualifies the receiving waterbody for direct domestic use. Also, the excessive turbidity in water can cause problem with water purification processes such as flocculation and filtration, which may increase treatment cost (DWAF, 1998). There may be a tendency for an increase in trihalomethane (THM) precursors, where highly turbid waters are chlorinated. High turbid waters are often associated with the possibility of microbiological contamination, as high turbidity makes it difficult to disinfect water properly (DWAF, 1998). However, the turbidity values were generally lower during the winter and spring seasons compared to summer and autumn. The increase in values during the summer and autumn season could be attributed to surface runoff and erosion carrying soil/silt (Morokov, 1987). The turbidity values obtained in this study were higher than those reported for Umtata River and Keiskamma River in South Africa (Fatoki et al., 2001; 2003). The salinity of the water samples generally varied from 0.11 to 0.26 psu throughout the study period with treated final effluent samples ranging between 0.13 and 0.15 psu (Table 1). Although there are no set standard for salinity level for effluent discharge into the aquatic ecosystems in South Africa. The water quality criteria for South African coastal zones (SANCOR, 1984) put the acceptable range of salinity in marine ecosystem for all biological activity at 33-36 psu, while Whitfield and Bate (2007) gave a multipurpose limit of ~0 psu for freshwater and ~35 psu for marine waters. Some of the impacts of excess salinisation on water resources include reduced crop yield, increases formation of scale and added corrosion in domestic and increased requirements for pretreatment of water for selected industrial use such as boiler feed water (DEAT, 2000). The total dissolved solid (TDS) profile of the treated final effluent and receiving waterbody samples vary significantly (P < 0.05) and ranged from 118.16 to 149.50 mg/L during autumn season; 112.80 to 133.26 mg/L during summer season; 144.77 to 233.44 mg/L during winter season and 168.40 to 245.60 mg/L during spring season (Table 1). The treated final effluents in particular had TDS ranges of 133.26 to 168.40 mg/L and these fell within the allowed limits of 0 to 450 mg/L (DWAF, 1996d). These TDS concentrations automatically influenced the quality of the received waterbody. Elevated TDS can be toxic to freshwater animals by causing osmotic stress and affecting the osmoregulatory capability of the organisms (McCulloch et al., 1993). The dissolved oxygen profile throughout the seasons varied significantly (P < 0.05) and ranged from 4.15 to 6.26 mg/L during autumn; 4.99 to 5.38 mg/L during summer; 4.85 to 11.22 mg/L during winter and 4.96 to 6.69 mg/L during spring season. In general, the treated final effluent varies between 4.15 and 5.38 mg/L. The DO content in treated final effluent which was observed to deplete faster than DO from the receiving waterbody could be attributed to the presence of degradable organic mater which resulted in a tendency to be more oxygen demanding. The DO values obtained from this study are similar to those reported elsewheres (Fatoki et al., 2003; Jaji et al., 2007; Obire et al., 2003). Dissolved oxygen is an important factor used for water quality control. The effect of waste discharge on a surface water source is largely determined by the oxygen balance of the system and its presence is essential in maintaining biological life within a system (DFID, 1999). Dissolved oxygen concentrations in unpolluted water normally range between 8 and 10 mg/L and concentrations below 5 mg/L adversely affect aquatic life (DFID, 1999; Rao, 2005). DO standard for drinking purpose is 6 mg/L whereas for sustaining fish and aquatic life is 4-5 mg/L (Rao, 2005). The DO value from this study fell short of the recommended standard. For water quality variable such as dissolved oxygen, water quality criteria are set at the minimum acceptable concentration to ensure the maintenance of biological function. The chemical oxygen demand (COD) of the water samples generally varied from 18.52 to 248.50 mg/L throughout the study period with the treated final effluent samples ranging between 34.82 and 238.00 mg/L (Table 1). The values obtained in all seasons were higher than the South African guideline for COD in effluents to be discharged into the receiving waterbody which is 30 mg/L (Government Gazette, 1984). Higher levels of COD were observed upstream and downstream of the discharge points in summer. The increased of COD concentrations during summer season could be attributed to run-off washed into waterbody. This is undesirable since continuous discharge of effluent has impacted the receiving waterbody to some extent and this may have negative effects on the quality of the freshwater and subsequently cause harm to the aquatic life especially fish, downstream (Morrison et al., 2001). When this present result was compared with results of COD of the treated final effluent and receiving waterbodies from developed countries, it was observed that the concentrations of COD differ as reported by UNEP (1993). According to Ogunfowokan et al. (2005), this increase in COD could be attributed to an increase in the addition of both organic and inorganic substance from the environment, as well as organic contaminant entering the systems from the municipal sewage treatment plants. In the same light, one observation agrees with the previous works of Fatoki et al. (2003) and Morrison et al. (2001) who reported that the contribution of COD to the effluent and receiving waterbodies in South Africa appears to be significant. Nitrate, the most highly oxidized form of nitrogen compounds is commonly present in surface and groundwater because it is the end product of aerobic decomposition of organic nitrogenous matter. Unpolluted natural waters usually contain only minute amounts of nitrate (Jaji et al., 2007). The mean nitrate concentrations in each season are shown in Table 1. In this study, the nitrate-N concentrations ranged between 1.83 and 11.75 mg/L during autumn season; 3.30 and 8.73 mg/L during summer; 1.85 and 13.10 mg/L during winter and 2.48 and 7.96 mg/L during spring season. In the treated final effluent, it varied from 7.96 and 13.10 mg/L (Table 1) and changed significantly (P < 0.05). The South African guideline for nitrate in sewage effluent is 1.5 mg/L NO3- as N (Government Gazette, 1984). The effluents did not meet this standard. It is important to note that nitrate level in the treated final effluent could be a source of eutrophication for receiving water as the obtained values exceeded the recommended limit. The effluent from the treatment works could be considered as a source of nitrate into the receiving waterbody. The high nutrient levels in the upstream discharge point of the receiving water may be as a result of diffuse sources from settlement and agricultural runoff. The nitrite profile of the water samples generally varied from 0.09 to 1.30 mg/L throughout the study period with the treated final effluent samples ranging between 0.12 and 1.30 mg/L (Table 1) and differ significantly (P < 0.05), high nitrite levels were found in effluent zone than in receiving waterbody. The total nitrite levels obtained during the study period exceeded the regulatory limits and thus nitrite is considered to pose a problem to communities when the receiving waterbody are used for domestic purposes. This may give rise to methaemoglobinemia (Fatoki et al., 2003). However, it is important to note that the nitrite from the treated final effluents could be a source of eutrophication for the receiving water bodies as the values obtained from the wastewater treatment plant exceeded the recommended limits for no risk of 0 to 0.5 mg/L as N (DWAF, 1996d). The orthophosphate P contents varied from 0.07 to 0.33 mg/L during the autumn season; 2.93 to 4.81 mg/L during summer; 0.70 to 2.16 mg/L during winter and 0.28 to 3.98 mg/L during spring season. The treated final effluent particularly had orthophosphate ranges between 0.33 and 4.81 mg/L (Table 1) and differs significantly (P < 0.05). High phosphate levels were found in effluent zone than in receiving waterbody. The possible reason could be a consequence of dilution effect. However, the level of phosphate in water systems that will reduce the likelihood of algal and other plant growth is 5 µg/L (DWAF, 1996c). Other investigators have pointed out that eutrophication-related problems in temperate zones of aquatic systems begin to increase at ambient total P concentrations exceeding 0.035 mg/P. In warm-water systems, the values range between 0.34 and 0.70 mg/P (Rast and Thornton, 1996). These represent nutrient threshold levels beyond which there will be a corresponding increase in the risk and intensity of plant-related water quality problems (OECD, 1982). Generally, the phosphate-P values were higher during summer season compared to other seasons, for the downstream and upstream of the discharge points. This could be attributed to phosphorus in runoff from domestic, municipal and agricultural waste (non-point sources) flowing into rivers, as well as washing along the riverside with detergent (Correll, 1998). Rapin et al. (1989) reported that introduction of tertiary wastewater treatment and ban on phosphate in detergent in Switzerland led to a decline in phosphorus concentration in Lake Leman. Comparison of the result obtained in this present study from the receiving watershed with some receiving waterbodies, e.g. Keiskamma River (0.03 to 2 mg/L) (Morrison et al., 2001), Osun River (0.064 mg/L) (Olajire and Imeokparia, 2001) and Mukuvisi River (0.9-11.7 mg/L) (Mathuthu et al., 1993) showed higher phosphate concentrations than that obtained in this study. In water quality studies, nitrogen and phosphorus are the nutrients most commonly identified as pollutants. Nitrogen in the form of ammonia (NH3) and nitrates (NO3-) and phosphorus are essential nutrients to plant life, but when found in excessive quantities; they can stimulate excessive and undesirable plant growth such as algal blooms. Eutrophication could adversely affect the use of rivers and dams for recreation purposes as the covering of large areas by macrophytes could prevent access to waterways and could cause unsightly and malodorous scum which could lead to the growth of blue-green algae and release toxic substances (cyanotoxins) into the water systems. These substances are well known to cause the death of farm livestock (Holdsworth, 1991) and this must be a matter of concern in the Eastern Cape as these receiving waterbody are used for drinking by the farm livestock. Moreover, it is well known that eutrophication could increase the treatment cost of drinking water through filter clogging in water treatment works (Murray et al., 2000). The correlations among the physicochemical properties were studied and results presented in Table 2. There was no significant correlation observed between pH and changes in temperature. But pH with conductivity, salinity, TDS and DO exhibited a significant positive correlation (r = 0.241, 0.231, 0.234, 0.384 at P < 0.05, respectively). pH with NO3- indicated a negative correlation (r = -0.674, P < 0.01). Temperature and DO were negatively significantly related (r = -0.216, P < 0.05). Also, conductivity exhibited negative significant correlation with turbidity (r = - 0.351, P < 0.01) and positive significant correlation with salinity TDS and DO (r = 0.987, 0.987 and 0.391 at P < 0.01, respectively). This will help to understand the nature of these physicochemical variables and their species speciation in the effluent and receiving watershed. It is generally known that an increase in concentration of pollutants will occur during low flows when point sources dominate. This was observed in few cases in the downstream of discharge point during winter and autumn seasons. It was also observed that non-point sources of pollution contributed to the upstream discharge point of the receiving water across the seasons. The results obtained in this study also suggest that some of the measured pollutants have localized impacts which then get diluted downstream. Other pollutants such as turbidity and pH appeared cumulative during the summer and spring seasons. While rainfall may dilute and weaken the effects of point source pollution, it also increases the contribution of non-point sources or diffuse pollution through land runoff from agricultural fields and leachates from refuse dumps (Jaji et al., 2007). However, a close inspection of the overall data indicates that the classical dilution of point sources during high flows did not occur. The results of the analyses for most parameters did not show the expected trends in water quality from upstream to downstream stations on the receiving water. It is expected that the concentration of most downstream discharge point should be higher than that of upstream discharge point. This is not the case in this study. CONCLUSION This study was carried out to evaluate the impact of the treated final effluents of a typical wastewater treatment plant in a rural community of the Eastern Cape on the receiving watershed. The results revealed that the treatment plant exhibited effluent qualities that meet acceptable standard in some parameters, like pH and total dissolved solid (TDS). It was also observed that the effluents fell short of standard requirements that are critical to the provision of clean and safe water such as organic waste (measured as turbidity DO, COD, orthophosphate, nitrate and nitrite). The results of this study therefore show that the effluent could pose significant healthy and environmental risk to rural communities who rely on the receiving water as their source of domestic water purpose without treatment and may also affect the health status of the aquatic milieu in the receiving water. The study showed a need for a continuous pollution monitoring programme of the surface waters in rural setting in Eastern Cape Province of South Africa. In addition, the provincial government and all agencies concerned with environmental matter in South Africa should evolve measures to check and ensure that discharge effluents comply with laid down rules and regulations. Finally, the study has revealed that there was an adverse impact on the physico-chemical characteristics of the receiving watershed as a result of the discharge of inadequately treated effluents from the wastewater treatment plant. ACKNOWLEDGEMENTS The authors are grateful to the National Research Foundation (NRF) of South Africa for financial support (Grant Ref: FA2006042400043). REFERENCES
© IRSEN, CEERS, IAU The following images related to this document are available:Photo images[st09018t2.jpg] [st09018t1.jpg] |
| |||||||||
