 |
| About Bioline | All Journals | Testimonials | Membership | News |
|
||||||
|
||||||
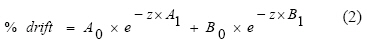
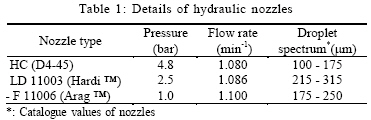
International Journal of Enviornmental Science and Technology, Vol. 6, No. 2, Spring, 2009, pp. 191-196 Comparison of field and model percentage drift using different types of hydraulic nozzles in pesticide applications *N. Yarpuz-Bozdogan; A. M. Bozdogan Department of Agricultural Machinery, Faculty of Agriculture, University of Cukurova, 01330, Adana, Turkey Received 14 August 2008; revised 4 January 2009; accepted 12 February 2009 Code Number: st09020 ABSTRACT In pesticide applications, small droplets are desired for better coverage and uniform distribution. Yet, small droplets have a problem: Drift, the movement of droplets off-target. Low drift nozzle produces fewer drift-prone droplets, < 100 µm, compared to standard hydraulic nozzles. In pesticide applications, standard hydraulic nozzles, hollow cone and flat fan nozzles are generally used by farmers. These nozzles have broad droplet spectrum and high proportion drift-prone droplets. Sample of drifted droplets and measurements in field conditions are expensive and can be time-consuming. However, models can be applied to predict drift without field measurement. In this study, model and field measurement of percentage pesticide drift were compared using different hydraulic nozzles, D4-45, F 11006 and low drift 11003 by gas chromatography equipped with a nitrogen-phosphorus detector. In the result of this study, for all nozzles, values up to 2 m and 3 m showed that there were statistically different according to German model and Dutch model, respectively. In the result of this study, percentage drift at 5 m compared to 1 m distance decreased approximately 15 folds in low drift 11003, 12 in F 11006 and 10 folds in hollow cone D4-45 nozzles in actual application and 5 folds in German and 9 folds in Dutch models. Keywords: Pesticide deposition, German model, Dutch model, low drift nozzle, flat fan nozzle, hollow cone nozzle INTRODUCTION Pesticides were extensively used in farmland after the discovery of DDT (dichlorodiphenyltrichloro- ethane) in 1939. About 3 billion kg of pesticides is applied each year with a purchase price of nearly $40 billion/y, worldwide (Pimentel, 2005). Despite the widespread application of pesticides at recommended dosages, approximately 35 % of potential crop production is lost to pests (Pimentel, 1992; 2005). An additional 15-20 % is lost to pests that attack the food between harvest and use (Downer and Hall, 1998; Pimental, 1992). Pesticides cause serious environmental and public health problems (Pimental, 1992). According to Council Directive 91/414/EC, pesticide damage should be assessed by considering 10 modules: Operator, worker, bystander, aquatic organisms, birds, earthworms, bees, beneficial arthropods, persistence in soil and leaching to groundwater (De Schampheleire et al., 2007). In pesticide applications, small droplets are desired for better coverage and uniform distribution. Therefore, small droplets are generally more effective than large droplets. Yet, small droplets have a problem: Drift, i. e. the movement of droplets off-target. The movement of droplets outside the intended area by air mass transport of diffusion is defined as drift by ASAE S327.3 (2007). Although, small droplets, < 100 µm, can move downwind, they can however easily be transported within a crop canopy by air turbulence and be deposited on leaves (Matthews, 2000). Even when a coarse spray, > 300 µm, is applied with most standard hydraulic nozzles, there will be a proportion of the spray volume emitted as small droplets which can drift (Matthews, 2000). Some researchers (Duvnjak and Miller, 1998; Holterman et al., 1997; Jones et al., 2002; Matthews, 2004; Murphy et al., 2000; Wenneker et al., 2005) found that coarse droplets produce less drift than fine droplets in low drift (LD) nozzles. According to EPPO (2003), the amount of drifting pesticide deposits as fall-out in the short range or transported through the air to greater distances from the treated area are determined by prevailing weather conditions. The seized by the drift are either deposited close to the treated area on soil or plants or transported in the atmosphere over longer distances, depending on their size (Epple et al., 2002) and meteorological conditions. Gil and Sinfort (2005) indicated that drifting spray is a complex problem in which equipment design and application parameters spray physical properties and formulation and meteorological conditions interact and influence pesticide loss. Zhong et al. (2003) conducted a study to evaluate the impact of naled on honey bees as a result of their exposure to aerial ultralow volume (ULV) applications of this insecticide during three routine mosquito spray missions. They indicated that insecticide deposit around the hives could be influenced by environmental factors, such as wind speed and site topography. Matthews and Hamey (2003) indicated that pesticide deposition at 1 m compared to 5 m downwind increased 7 fold at low wind speeds (about 1.5 m/s), but there was less than a two-fold increase at the highest wind speed (5.1 m/s). In high wind velocity, drifted droplets are transported further away. Kawahara et al. (2005) indicated that 30 m is the distance that finer particles ( < 100 mm) are expected to drift under 1 m/s wind. Snoo and Witt (1998) indicated that drift deposition increases with wind speed. They found that, in the sprayed situation and with a wind speed of 0.5 m/s, there was a maximum of 6.0 % drift deposition halfway down the ditch bank and no drift deposition in the ditch. At 3 m/s wind speed these values are 25.1 and 2.2 %, respectively. At 5.0 m/s wind speed, 7.2 % drift deposition was measured in the ditch. Farooq et al. (2001) found that near the nozzle, smaller droplets travel slower than coarse droplets. However, away from the nozzle, the smaller droplets have negative vertical velocities indicating that the droplets are traveling upwards. Moreover, they found that in the region below 75 mm from the nozzle exit, small droplets with low vertical velocity are separated from the coarse droplets with high vertical velocity. Therefore, it is difficult to sample of fine droplets on horizontal sampling surfaces in 5 m. Horizontal sampling surfaces are suitable for sampling of coarse droplets according to ASAE S561.1 (2004). In typical applications with boom type sprayers, droplets of 100 mm or less often drift out of the target and droplets of 50 mm or less diameters completely evaporate before reaching the target (Ozkan et al., 1997). Moreover, in spraying, droplet size decreases due to evaporation as air temperature increases and relative humidity decreases (Ravier et al., 2005; Smith and Thomson, 2003). Field measurements of spray drift are also expensive and time-consuming to conduct accurately (Miller, 1993). To compensate for such disadvantages, computer and mathematical models are developed and used by some researchers (Gil and Sinfort, 2005; Goering et al., 1972; Holterman et al., 1997; Smith et al., 2000; Thompson and Ley, 1983; Uçar, 2000). Such models have been developed to predict spray droplet trajectories both close to nozzles on a boom sprayer and in the drifting spray plume further downwind of the application site (Murphy et al., 2000). The advantages of verified field drift models are that drift deposit predictions for a variety of application conditions can be compared and estimations can quickly be obtained (Smith et al., 2000). The aim of this study was to compare the percentage pesticide drift of the two existing mathematical models (German and Dutch) with field measurements obtained from spray applications using different hydraulic nozzle types. MATERIALS AND METHODS Pesticide, nozzles and field experiments Malathion is an organophosphate was used as pesticide in the trials. Typical application rates for agricultural crops are 0.50-1.25 kg a.i./ha (The Pesticide Manual, 2003). In this study, 0.57 kg a.i./ ha of malathion was applied. Pesticide depositions were analyzed using gas chromatography equipped with a nitrogen-phosphorus detector (GC-NPD). Three different types of hydraulic nozzles were used: 1) Hollow cone nozzles (HC D4-45, TaralTM), generally used by farmers in Adana-Turkey in all pesticide applications; 2) Low drift flat fan nozzle (LD 11003, Hardi™ ) and 3) flat fan nozzles (F 11006, Arag™) (Table 1). The trials were carried out in Adana, Turkey. The trials were done on May 04, 2007. The application rate of trials was 200 l/ha. Only one field sprayer was used. The forward speed of the tractor on which the sprayer was mounted was 6.5 km/h and the power-take-off (PTO) rotational speed was 540 rev/min. Pesticide was sprayed 50 cm above the grassland in all trials, each of which was replicated three times. Meteorological conditions During the trials, the temperature, the relative humidity and the wind velocity were measured and recorded. Digital hotwire anemometer CE (Lutron™ AM-4204 HA) and digital humidity/type k thermometer CE (Lutron™ HT-3006 HA) were used for measuring meteorological conditions. Details of meteorological conditions are given in Table 2. Analysis equipment All chromatographic analysis were performed on a Agilent Company™ (6890 N) gas chromatograph with an autosampler automatic injector, equipped with nitrogen phosphorous detector (NPD) and a fused silica capillary column (Agilent HP-5 5 % phenyl methyl siloxane (30 m × 0.32 mm × 0.25 mm). The GC-NPD operating conditions for analyzing were as follows: Injector temperature, 220 °C; NPD temperature, 320 °C; oven temperature, 70 °C for 2 min, then 25 °C/min to 150 °C, then 3 °C/min to 200 °C, then 8 °C/min to 280 °C and holding for 10 min; injection volume, 1 mL; carrier gas helium and splitless, constant flow was at 1.5 mL/ min. The analytical procedure was applied according to GC methods (Pesticide Analytical Manual, 1999). Determination of percentage drift in models In this study, two types of drift models, German and Dutch, were used to predict drift at certain distances downwind the field. The German drift values make a distinction between the following categories: fruit early application, fruit late application and field crops. The Dutch drift values distinguish the categories potatoes, sugar beets, cereals, bare soil, fruit trees in leaf and leafless fruit trees (De Schampheleire et al., 2007). According to De Schampheleire et al. (2007), temporary and permanent grassland was accepted as field crops in German category and as bare soil in Dutch category. Equations of these models are used to calculate the drift values in function of the distance z downwind the field and are expressed as a percentage of the application dose. Percentage drift is presented by Eqs. 1 and 2 (De Schampheleire et al., 2007) as below: German model % drift = A× z B (1) Where, A and B are coefficients that depend on the crop and z is the distance between the field border and a point downwind the field (m). Dutch model
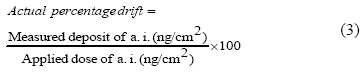
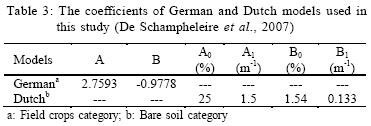
Where, A0, B0, A1 and B1 are coefficients that depend on the crop, and z is the distance between the last spray nozzle and a point downwind the field (m). In this study, the coefficients, as presented in Table 3, were used for both the German and Dutch models. Determination of actual percentage drift Actual percentage drift was calculated by Eq. 3.
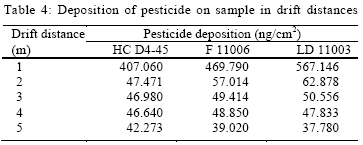
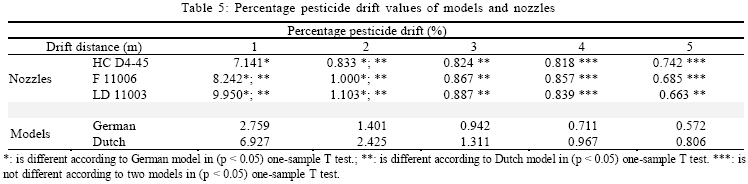
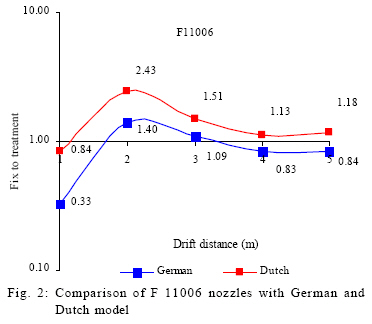
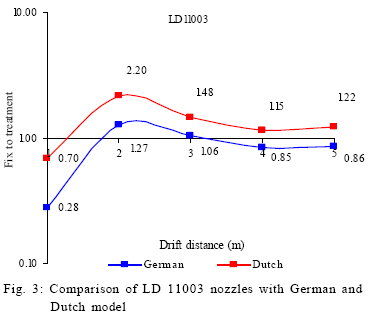
Drift sampling methods and analysis procedure According to ASAE S561.1 (2004), the sample line was approximately parallel to the wind direction (within ± 30 °). The spray line was perpendicular to the sample line. The sampling surfaces were horizontally located at the top of the soil surface in the downwind. The sampling surfaces were placed for sampling the quantity of pesticide depositing at 1 m intervals along the sample line. Distances of sampling surfaces were 1, 2, 3, 4 and 5 m from the last nozzle of the boom along the sample line. Surface area of cotton fabric, used for sampling material, was approximately 50 cm2 (7 × 7 cm). This surface area is suitable according to ASAE S561.1 (2004). After spraying, the samples were collected and placed in glass containers (500 mL) and brought from field to laboratory. In laboratory, samples were extracted using 100 mL volumes of methanol. The containers were shaken for 1 h in a water bath with a shaker at room temperature. A 2 mL fraction of each extract was sealed into a GC vial and stored in a refrigerator until analysis. Comparison of field and model percentage drift According to German and Dutch models, percentage drift of each nozzle was analyzed in one-sample T test, using a SPSS package computer programme (SPSS, 1993). Also, percentage pesticide drift of each nozzle in treatment was compared with German and Dutch models. If percentage pesticide drift rates between the model and the field values are an ideal ratio of 1, this is the best fit. Therefore, field values were fixed, as reference values, to show the difference obtained from the models. Then, bench values more than 1 indicates overestimation and that less than 1 indicate underestimation of the two models. RESULTS AND DISCUSSION In the trials, pesticide deposition (ng/cm) measured by GC-NPD of malathion on samples in drift distances is presented in Table 4. As shown in Table 4, in 1 m drift distance, the lowest drift deposition was obtained as 407.060 ng/cm in HC D4-45 nozzles and was found to be 1.15-1.39 folds lower than in F 11006 and LD 11003 nozzles, respectively. On the other hand, the highest pesticide deposition in 1 m was obtained as 567.146 ng/cm in LD 11003 nozzles. This value was 1.21- 1.39 folds higher than F 11006 and HC D4-45 nozzles, respectively. In last sampling surface, 5 m, deposition in LD 11003 was lower than F 11006 and HC D4-45, since, fine droplets are transported to far away distances by air stream. Moreover, pesticide deposition at 5 m compared to 1 m distance decreased approximately 15 folds in LD 11003, 12 in F 11006 and 10 folds in HC D4-45 nozzles. During HC D4-45 trials, the highest wind velocity was observed as 2.1 m/s. Therefore, small droplets are drifted to farther distances by atmospheric condition and its behaviour. HC D4-45 nozzles have fine spray quality for British Crop Protection Council (BCPC). Murphy et al. (2000) showed that drift decreased as sprays changed in quality from fine to coarse using BCPC scheme as expected. Liu et al. (2006) obtained that hollow cone nozzle showed the highest potential drift on the boom sprayer compared with a flat fan nozzle, a low drift nozzle and an air inclusion nozzle. Percentage pesticide drift values of models were determined for each drift distance via Eqs. 1 and 2 and values of nozzles were obtained via Eq. 3 using values in Table 4. These values are presented in Table 5. As seen in Table 5, percentage drift at 5 m compared to 1 m distance decreased approximately 5 folds in German and 9 folds in Dutch models and 15 folds in LD 11003, 12 in F 11006 and 10 folds in HC D4-45 nozzles. In all nozzles and models, the highest percentage pesticide drift was obtained in 1 m drift distance (Table 5). As seen in Table 5, in 1 m, percentage drift values of nozzles were higher than both models. The highest percentage drift value in nozzles was obtained by LD 11003 nozzles at 1 m. Coarse droplets deposit closer distances from treated field (Matthews and Hamey, 2003). Drift in 1 m is influenced by some factors such as forward speed of the sprayer, movement of boom, wind, etc. Complex air stream occurs in field conditions. In field conditions, attributes of droplets are not predicted due to complex weather conditions (Holterman et al., 1997), forward speed of sprayer (Van de Zande et al., 2005), vibration of boom (Lardoux et al., 2007), etc. As can be observed in Table 5, the highest field values were in 1 m drift distance. For all nozzles, values up to 2 m showed that there were statistically difference according to German model. After 3 m drift distance, there were no statistically difference between field and German model values for all nozzles. On the other hand, generally, values up to 3 m showed that there were statistically different according to Dutch model. Percentage drift of each nozzle was compared with the German and Dutch models (Figs. 1, 2 and 3). In these Figs. if percentage pesticide drift rates between the model and the field values are an ideal ratio of 1, this is the best fit. As seen in Fig. 1, HC D4-45 nozzles yielded the closest value as 0.97 for 1 m in the Dutch model. As seen from Figs. 2 and 3, in F 11006 nozzles and LD 11003, the closest field values of these nozzles to the German model were measured in 3 m drift distance as 1.09 and 1.06, respectively. As seen in Figs. 1, 2 and 3, values in 1 m drift distance were underestimation of the two models. However, after 1 m drift distance, values were overestimation of the Dutch model. The most important conclusion which can be derived from this study is that when operators will use D4-45 nozzles which are generally used in Turkey, they should consider the models to predict percentage pesticide drift values in pesticide applications. Yet, further studies may focus on the effects of these nozzles on biological efficiency regarding decision-making in pesticide applications. Additionally, since the sampling surface used in this study was horizontal, vertical sampling surface, combined with horizontal, should also be used for capturing more droplet samples. ACKNOWLEDGEMENT The authors wish to thank Research Assistant Gulin TABAKAN for statistical analysis. REFERENCES
© IRSEN, CEERS, IAU The following images related to this document are available:Photo images[st09020f1.jpg] [st09020f3.jpg] [st09020t5.jpg] [st09020t1.jpg] [st09020t2.jpg] [st09020t4.jpg] [st09020t3.jpg] [st09020f2.jpg] |
| |||||||||
