 |
| About Bioline | All Journals | Testimonials | Membership | News |
|
||||||
|
||||||
International Journal of Enviornmental Science and Technology, Vol. 6, No. 2, Spring, 2009, pp. 309-314 Predicting and identifying traffic hot spots applying neuro-fuzzy systems in intercity roads *M. Hadji Hosseinlou; M. Sohrabi Transportation Departement, Faculty of Civil Engineering, K. N. Toosi University of Technology, Tehran, Iran Received 22 May 2008; revised 28 December 2008; accepted 12 February 2009; available online 1 March 2009 Code Number: st09034 ABSTRACT Providing safety in roads for the purpose of protecting human assets and preventing social and economic losses resulted from road accidents is a significant issue. Identifying the traffic hot spots of the roads provides the possibility of promoting the road safety which is also related to investigate frequency and intensity of occurred accidents. Accidents are multidimensional and complicated events. Identifying the accident factors is based on applying a comprehensive and integrated system for making decisions. Therefore, applying common mathematical and statistical methods in this field can be resulted in some problems. Hence, the new research methods with abilities to infer meaning from complicated and ambiguous data seem useful. Therefore, along with identifying the traffic hot spots, adaptive Neuro-Fuzzy inference system is used to predict traffic hot spots on rural roads. In this process, a fuzzy inference system from Sugeno type is trained applying hybrid optimization routine (back propagation algorithm in combination with a least square type of method) and accident data of Karaj-Chalus road in Tehran Province. Then the system was tested by a complete set of data. Finally, the stated system could predict 96.85 % of accident frequencies in the studied blocks. Furthermore, the amount of effective false negative in all cases included only 0.82 % of predictions, which indicated a good approximation of predictions and model credibility. Keywords: Accident, safety, optimization, least square, sugeno, hybrid, back propagation INTRODUCTION In this modern world, human beings need more attempts to achieve a proper social, economical, cultural, welfare and political position. They try to use all possibilities to create relation to take advantage of all possible opportunities in each geographical situation. Therefore, roads play significant roles in economic affairs. More than 80 % of transportation is done through road transportation network in Iran, while the casualty statistics resulting from road accidents is very high and has more than 28000/y victims with their economic and social consequences. The statistics indicate thorough attempt in planning, constructing and safe operating of country roads, while supplying safety is not possible unless the traffic hot spots are identified within safety inspection plans in existing road networks. Identifying traffic hot spots has been one of the clamorous discussions in transportation and traffic. In the present research, traffic hot spot identification methods are briefly mentioned and then the ability of applied devices, processing and their results are explained. Various methods have been used in identifying the traffic hot spots due to many problems. The simplest way of locating is grading and categorizing them in descending trend according to accident frequencies and recording accidents used in this country. Although this method has clear advantages, efficiency of identifying real traffic hot spots has many capacities for development and promotion (Brown et al., 1992; Heydecker and Wu, 2001; Kim et al., 2006; Norden et al., 1956). In this traditional method, a filed data and historical records for attribution are essentially needed. A main part of researches emphasizes on overcoming this shortage and more development and optimization of identification methods (Petridou and Moustak, 2000; Tamburri and Smith, 1970). Therefore, many methods based on statistical mathematics, regression to the mean and Bayesian empirical methods have been developed (Mahal et al., 1982; Ng and Sayed, 2004; Wright et al., 1988). Briefly speaking, a broad range of submitted techniques for traffic hot spot identification (HSID) (including simple categorization of accident rate and frequency, controlling quality rate, identifying the area) have been applied using safety index/number and rate methods/accident patterns identification methods and various applications of Bayesian categorization in techniques with ability to improve identification methods of black spots according to the history of accidents and the ones expected through comparing with similar zones (Hauer et al., 2002; Li et al., 1994; Milton and Mannering, 1998; Tarko et al., 1996). The performed studies in this respect showed that applying simple methods of categorization with Bayesian methods can remarkably increase the capacity of accident data set. Therefore, collecting comprehensive information about accident history is required within research limitation and reference population (Cafiso et al., 1999; Davis and Yang, 2001; Roger et al., 2004). Shortages of this method are as follows: 1) They needed a macro reference population, 2) Selecting reference population was completely optional, 3) Reference population always includes required elements for identifying unsafe situations (Hauer and Persaud, 1984; Schluter et al.,1997;Washington and Cheng, 2005). It was found in studies that there may be two types of errors in identifying traffic hot spots which are false positive and false negative. False positive includes errors which may occur in identifying a point of research span. There is a safe condition area which is used in identifying of removing the faults. Since the error is for the purpose of assurance it is called false positive (Washington and Cheng, 2005). But false negative is an error because of which an originally traffic hot spot area is identified as a safe one. Since this error causes omission of some areas of research span which are traffic hot spots, it is called false negative (Washington and Cheng, 2005). To remove these shortages, lots of attempts have been done which lead to superiority of imperial methods resulting in Bayesian pattern (Hauer, 1992; Cheng and Washington, 2005; Sayed and Abdelwahab,1998). On the other hand, studying methods based on new mathematical science such as neuro-fuzzy system indicates that such tools with their unique abilities to infer meanings from ambiguous and deficient data can be useful in many transportation problems such as identifying traffic hot spots (Busch et al., 1995; Huang and Ren, 1999; Lee et al., 2003; Pappis and Mamdani, 1977; Sayed et al., 1995). The present research includes introduction, methodology, data collections and analysis, results and discussions and conclusion. This research was performed in K. N. Toosi University of Technology, (2007). MATERIALS AND METHODS According to what has been previously stated and concerning defective and confused records of accidents in Iran, it is tried to find successful results in identifying traffic hot spots by collecting existing data in adaptive neuro-fuzzy inference system and taking advantage of the capabilities of such system (Akiyama and Shao, 1993; Busch et al., 1995; Pappis and Mamdani, 1977; Teodorovic, 1999). Fuzzy and neuro systems are the best approximate reasoning and optimization tools in soft computing. Soft computing means a series of new calculative methods in computer, artificial intelligence and other applied sciences. Complicated research, modeling and analysis are required for all these fields for which the accurate scientific methods in past were not successful with their easily, analyzing and full solutions.
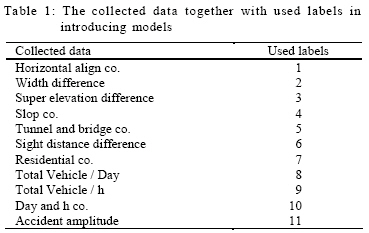
Now, regarding the complicatedness and ambiguity of a series of factors involving in accidents, modeling such process by common methods of mathematics (which have been broadly applied during the last 50 years) is very difficult by existing accident information throughout Iran. Therefore, developing neuro-fuzzy systems is more acceptable in such situations (Roger, 2004). Consequently by using MATLAB software and self organized algorithms in adaptive neuro-fuzzy inference system (ANFIS), Sugeno type of fuzzy inference system was used in present research applying optimization routine back propagating algorithm in combination with a least square type of method. Data collection and analysis To study the function of adaptive neuro-fuzzy system in identifying traffic hot spots, achievable data about occurred accidents for Karaj-Chalus two-lane major road is selected which is one of the main roads connecting the capital to the north of Iran. This road is among beautiful roads throughout the world and has a high traffic volume; meanwhile it has potential for accidents due to its mountainous situation. However, since 70 years from its construction, it has not been adapted with new traffic standards. Accident frequency and intensity were selected for identifying traffic hot spots of this road. In this regard, the data related to accidents during 3 months was collected by considering one of the crowded months. That was related to 122 points of this road. Finally, 11 items were selected for identifying the process. Table 1 shows the collected data together with used labels in introducing models. These data include 7 related ones to geometric design future and place status. They were adopted from topographical and geometrical drawings of the road including the situation of horizontal plan, height, vertical slope, horizontal sight push, road width, bridge and tunnel effect and application of the study area. The next 3 data also indicate the amount of traffic volume per day, the amount of hourly traffic volume in the day of accident and the time of accident in the road. Item 11 shows accident frequency of the road which is used as objective function. The collection of these data presents a reliable interpretation of road situations in the time of accident occurrence for all recorded accidents and their occurrence blocks. It is obvious that traffic accident data is too much and complicated to obtain all data. It is worth noting that the data shown in Table 1 is based on existing reliable information in the road. Therefore, only the information represented in Table 1 should be selected. After collecting data, they were categorized into 2 training and testing groups. The former are latter groups produced for adapting the model with road situations and for studying the credibility of prediction results from ANFIS in estimating expected frequencies, respectively. As stated before, neuro-fuzzy system adopts the ambiguous and invisible concepts and through which the required parameters and components can be adjusted for predicting other data not being confronted with yet. Then the adapted system can predict the frequency of accidents related to the situations of input data introduced in the beginning of this section.
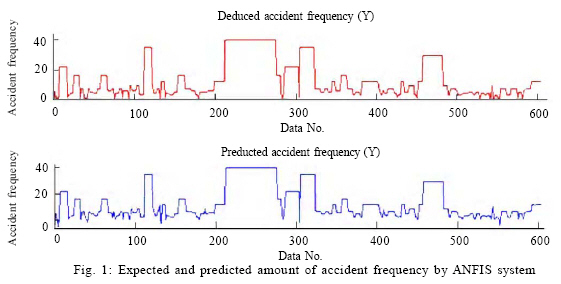
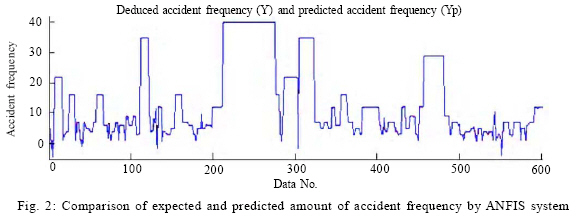
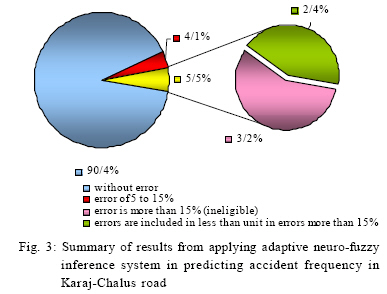
RESULTS AND DISCUSSION To clarify the quality of predictions, it is necessary to make a statistical review on the amount and type of occurred errors. The summary of results from applying adaptive neuro-fuzzy inference system in predicting accident frequency in Karaj-Chalus road is shown in Figs. 1, 2, and 3, using the (1234568) data combination. Figs. 1 and 2 indicate a very proper approximation of accident frequencies in ANFIS system by putting the expected and predicted amount of accident frequency beside or over each other. Table 2 shows the data distribution in various error amounts. According to Table 2, nearly 83 % of data lead to accurate prediction. Moreover , 7.8 % of predictions have less than 5 % error rate and this error in 76 % of cases produce less than one unit of error. Therefore, in 90.4 % of predictions, the occurred error is very low. In 4.1 % of cases, there is an error of 5 to 15 % which has been occurred due to the system that is acceptable. In 5.6% of remaining cases, the occurred error is more than 15 %. This 5.6 % (including 33 data items) needs more discussion in view of type and reason of produced error is less than unit and only because of very small frequency they are subject to percent mutation. This group of expansion (including 42 %) is ignorable in practice. If the prediction of second position in view of error type is considered, 15 cases of 33 errors were based on the type of false negative (without overlooking predictions with less than unit error and confusion leading to negative frequency). Of course 8 predictions among these cases are about frequency one unit. 3 cases of these 8 predictions and generally 5 cases of 15 errors are included in less than unit error and in all 33 cases are more than 15 % that equals 14 numbers of total data. Finally adding up to the predictions and omitting less than unit error in more than 15 % of effective errors constitutes 3.15 % of total predictions. It means the adapted system has had acceptable predictions in more than 96.85 % of total ones. The results of Table 2 is depicted in Fig. 3. In other words, root means square error is 6.58 % in this model. In fact, each of the predictions is as mean with 6.58 % error which is very low and acceptable. CONCLUSION From this research, the following results will be explicitly obtained: a) In this identification method, it was attempted to present a method for predicting accident frequency by applying statistics of accidents in a certain road. Hence, the model was adapted for predicting the series of tests. Therefore, the model could write the training data as the similar accident frequency. The result showed that the model can estimate the accident frequency in more than 96 % of cases with good quality and proper coverage over peripheral conditions. In fact, the ability of the model to produce real data with average error of 6.58 % evidences the assurance of processing result. While considering average accident frequency (equals 13.4), each data items was identified and 0.88 % error was averagely found. b) The credibility of results was studied according to predictable usages for the model. It should be taken into consideration that such identifications may be used for future trends of accidents in the roads without written record. Therefore, the results shall be free of any false negative as much as possible. However, as previously stated, there was only 5 false negative with more than 1 or 1 error unit. This amount of false negative equals 0.82 % of predicted cases. Such a result also shows the credibility of applied method. c) As expected before, in identifying traffic hot spots regarding Karaj-Chalus road, a reliable success was obtained in view of producing amounts similar to reality in accident frequency. These results confirm the application of such systems in analyzing complicated traffic problems. The first interpretation of the above 3 results is that according to abilities of such models, it is expected that such systems shall be used in various inspections of road safety. It should be added that the system can be trained by extracted data from the road with completer accident history and used for the roads with similar conditions. This matter can be very useful in studying the behavior of roads which have not been utilized yet and it is predicted to operate under various traffic volumes. Other application of such processing is the ability of this system to study the amount of factors effectiveness in accident occurrence. Therefore, using the results of neuro-fuzzy inference system, the hidden relation among the data can be found. Such result can be applied for giving priority in cases where a limited budget is available and one situation with several hazardous reasons is under investigation. REFERENCES
© IRSEN, CEERS, IAU The following images related to this document are available:Photo images[st09034f1.jpg] [st09034f3.jpg] [st09034f2.jpg] [st09034t1.jpg] |
| |||||||||
