 |
| About Bioline | All Journals | Testimonials | Membership | News |
|
||||||
|
||||||
International Journal of Enviornmental Science and Technology, Vol. 6, No. 2, Spring, 2009, pp. 325-335 Appraisal and mapping the spatial-temporal distribution of urban road traffic noise 1 *D. Banerjee; 2 S. K. Chakraborty; 3 S. Bhattacharyya; 4 A.Gangopadhyay 1 Department of Environment and Water Management, Banwarilal Bhalotia College, Asansol, West Bengal, India Received 19 October 2008; revised 3 January 2009; accepted 15 February 2009; available online 1 March 2009 Code Number: st09036 ABSTRACT The present study aims to compute the temporal and spatial distribution of road traffic induced noise pollution in an urban environment by monitoring and mapping. The study area was the entire Asansol city of West Bengal, India. A total of 35 locations were selected for collection of data, classified as industrial, commercial, residential, sensitive and mixed areas according to the national regulatory standards. Noise recordings were conducted during morning and night hours. Day time Leq level ranged between 51.2 and 89.0 dB(A), whereas it ranged between 43.5 and 81.9 dB(A) during night. The average Ldn value was 73.28 ± 8.51 dB(A) (Range: 55.1-87.3); The traffic noise index was 80.62 ± 15.88 dB(A) (Range: 49.4-115.8). The computed data were mapped by utilization of Geographic information system methodology that allowed the visualization and identification of the extent and distribution of sound pollution across the study area. This proves to be an ideal tool for carrying out noise impact assessments in urban settings. The study reveals that present noise level in all the locations exceeds the prescribed limit. Based on the finding, it can be mentioned that the population in this industrial town are exposed to significantly high noise level, which is caused mostly due to road traffic. The study reveals that vulnerable establishments like schools and hospitals are subjected to significantly high noise level throughout the day and immediate mitigatory measures are required to alleviate the problem. Keywords: Noise map, urban, pollution, transportation, geographic information system, landuse, risk zones INTRODUCTION Noise is unwanted sound and a serious cause of global worry, especially in urban areas of developing and developed nations. In recent years, heavy urbanisation and industrialisation has aggravated the environmental noise problem all around the world (Canter, 1996) and also in the Indian subcontinent. The sources of such noise are many and varied, but the most significant one is road traffic. The progress of transport systems has shaped the socio-economic benefits to the human society, but at the same time, it has also polluted the environment. Road transportation is next only to industrial activity in causing irreversible damage to the environment (Ali, 2004; Chakraborty and Banerjee, 2007; Piccolo et al., 2005; Singal, 2005), the degree of which has attained global proportions (Brown and Lam, 1987; Kumar and Jain, 1994; Nirjar et al., 2003; Rao and Rao, 1991). Consequently, the quality of life of those exposed to the benefits of transportation may be worsened rather than improved. Moving road traffic generates uncontrolled noise pollution and gives rise to associated auditory and non-auditory health effects as demonstrated by various research works (Das et al., 1999; Ising and Kruppa, 2004; Stansfeld et al., 1996). Such noise can cause both short term, as well as long term psychological and physiological disorders, particularly among those living and work or remain in close proximity to roadways. The impact of road traffic noise on exposed population can cause annoyance by disturbing sleep, causing speech interference or interrupting daily activities (Chhatwal et al., 2005; Sommerhoff et al., 2004). While there is no risk of long term auditory damage from traffic noise, there is a great deal of evidence that noise generally can cause adverse health effects on people (Al-Dakhllah and Jadaan, 2005; Anonymous, 1983; Chakraborty et al., 1997; Chakraborty et al., 2002). The central pollution control board (CPCB, 2001) of India in its notification on ambient air quality standard for noise, which has been included as an air pollutant under section 20 of Amended air act of 1987 and has laid down the ambient noise standards. The use and application of noise mapping by GIS (Geographic information system) methodologies has enabled the efficient acquisition, management and elaboration of geo-referenced data, representative of territory, sources and receivers as evidence from literature (Gupta et al., 1986; Kauss, 2002; Mehdi et al., 2002; Mortagues and Alcaide, 1996). There are other works carried out by Kluijver and Stoter, 2003; Lee et al., 2008; Paminakibud and Tansatcha, 2003 and Zambon et al., 2007. To name a few important noise mapping assessment works as conducted by Doygun and Gurun (2007), noise data were mapped in terms of spatial-temporal variability in the city of Kahramanmaras in Egypt. Mehdi (2002) in Karachi metropolitan area of Pakistan remote sensing and GIS technologies extensively used for road traffic noise mapping. Seto et al. (2007) conducted similar exercise in American cities using GIS and utilized the generated noise maps for urban planning and assess health impacts on local communities. Similar works done by Yilmazo and Hocanli (2006) in the city of St. Anliurfa using GIS to map noise and identify critical zones. The major objective of the study was to enumerate the spatial and temporal distribution of urban traffic noise in the city of Asansol and develop suitable noise maps for evaluation of impact. The investigations were conducted with the intention of assessing and quantify the extent of road traffic noise distribution pattern under the urban environment. Following objectives will be attained in this study:
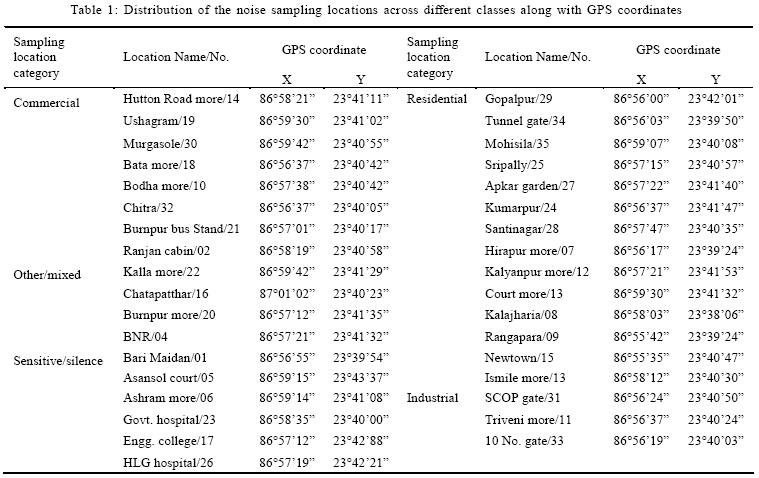
The study was carried out from July 2006 to June 2008 in the Asansol metropolitan area of West Bengal, India. MATERIAL AND METHODS Study area Asansol, an urban-industrial city situated in West Bengal state of eastern India, with an area of 127 km2 and a population density of 3737/km2 has witnessed a sharp growth in vehicular population in the last five years, ensuing a significant, unrestrained noise pollution across the area as reported in previous works (Banerjee and Chakraborty, 2005; 2006; Banerjee et al., 2008a). The impact identification and quantification due to such exposure to road traffic noise has been done in such preceding works and it has been observed that such noise levels in the area are much above the prescribed limits (Banerjee et al., 2008b). The situation demands through investigation, identification and assessment of the cause-effect chain due to traffic generated noise exposure. The study area is an industrial town, comprising of 100 % urban population and thus, consists of diverse types of landuse patterns dominated by built up areas namely residential. Industrial area is the second largest landuse type. This is responsible movement of heavy and medium vehicles across the main road and throughout the day resulting in high noise emissions. In the recent past, the city has witnessed heavy growth and development, but the growth has been unplanned and only within the city limits. Although the city is getting crowded with various types of infrastructures with open areas shrinking, the road network has remained unaltered and has not been expanded in accordance with increase in the vehicular population. The residential areas in majority of the zones are associated with commercial activities that tend to attract more traffic movement and consequently higher noise pollution. The city is expanding from the central part to outwards; thus, the city edges especially in the northern and southern parts are less densely populated and consequently have lower noise levels. The study area comprise of fifty wards (administrative units) out of which thirty five analysis zones (sampling locations) were identified for data collection, such that they represents the state of city in terms of traffic noise receiver density. The sampling locations comprised of industrial, commercial, residential, sensitive and mixed areas. Urban noise survey locations has been categorized into four types, namely the receptor-oriented sampling method; the second is source oriented sampling method; the third is the randomly selected measurement locations using regular or non-regular grid systems and in the last method, the study area is divided into zones according to population, receiver density, landuse characteristics and importance of the roads (Doygun and Gurun, 2007). In the present study, the landuse zonation sampling location method was applied and details are given in Table 1. Sampling and data computation A digital sound level meter, Type 2 with frequency weighting network as per IEC651 specifications, frequency range of 31.5Hz to 8,000Hz and measuring range between 0150 dB was used for the study. All reading was taken on the `A-weighting' frequency network, at a height of about 1.5 m from ground level and on the `Fast' range time weighting. The `A' weighting characteristic and `Fast' range is simulated as `human ear listening' response. Sound data were recorded at interval of 15 sec for a continuous sampling period of 1 h during working days and under normal climatic conditions. The data collected from field were recorded in MS excel worksheet and later transferred to SPSS (version 12) statistical software for further analysis. All noise values were expressed in dB(A) units. For the proper assessment and analysis of the results, the following noise indices were computed: Leq-d and Leq-n: Hourly A-weighted equivalent sound level for day and night period; Ldn: Day-night average sound level (DNL); TNI: Traffic noise index and Lmax and Lmin: Maximum and minimum noise level during sampling period. The sound level meter does not give a steady and consistent reading and it is quite difficult to assess the actual sound level over the entire monitoring period. To mitigate this shortcoming, the continuous equivalent sound level, indicated by Leq, was estimated from sound pressure level recorded and used. It is defined as the level of that steady sound which over the same interval of time, contains the same total energy (or dose) as the fluctuating sound. Equivalent sound level, `Leq' is computed using following equation:
Leq (dBA) = 10 × log10 [(1/N) ∑Ni=1 10 Li/10] (1)
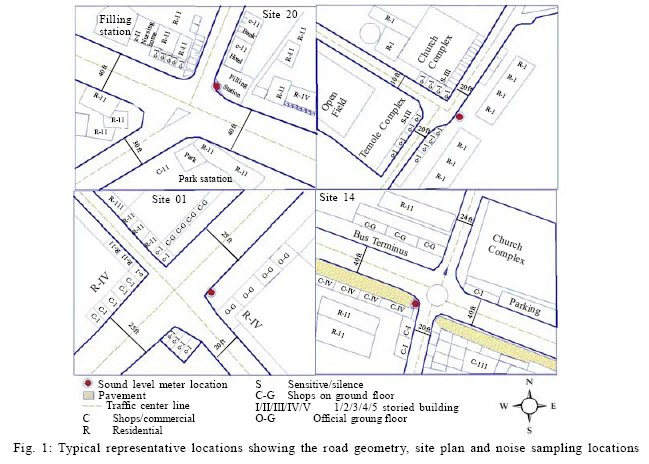
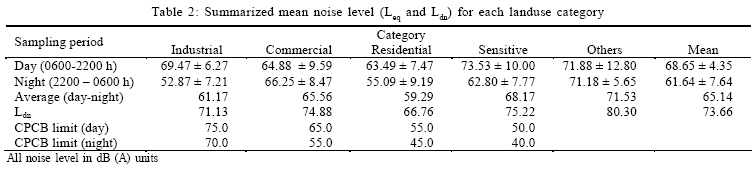
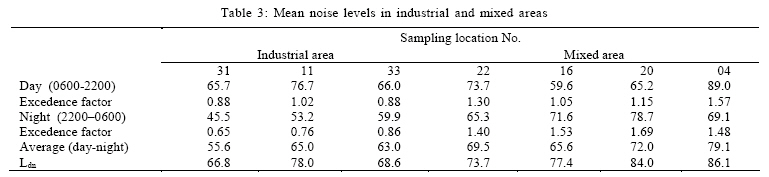
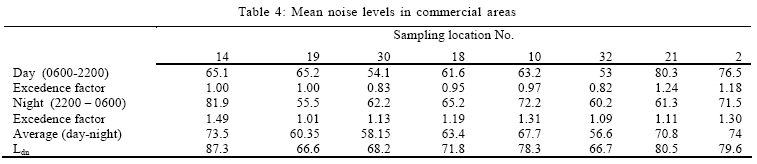
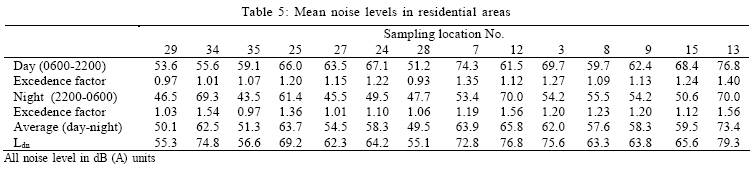
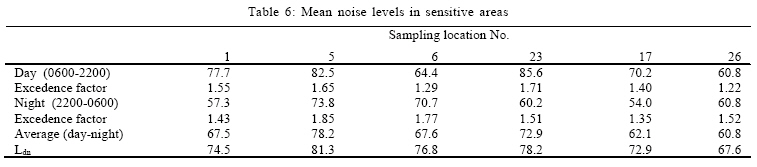
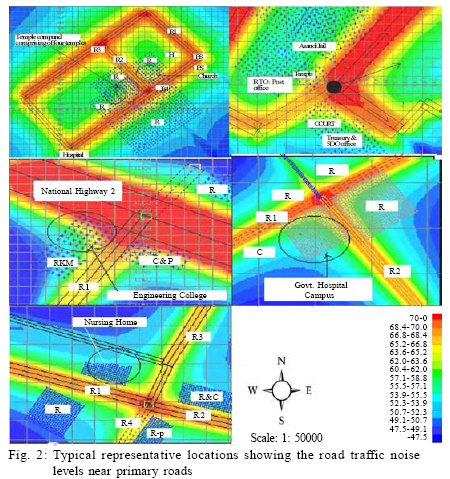
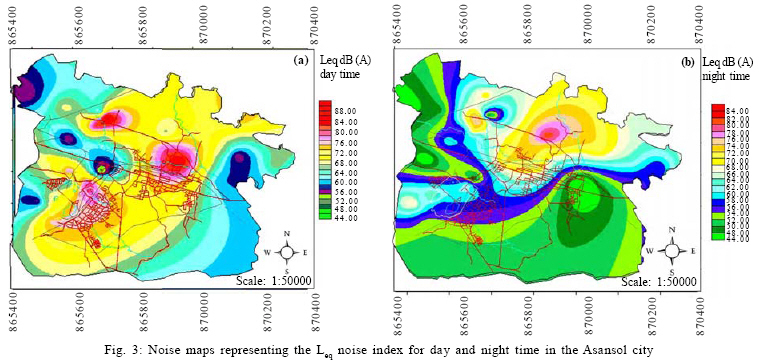
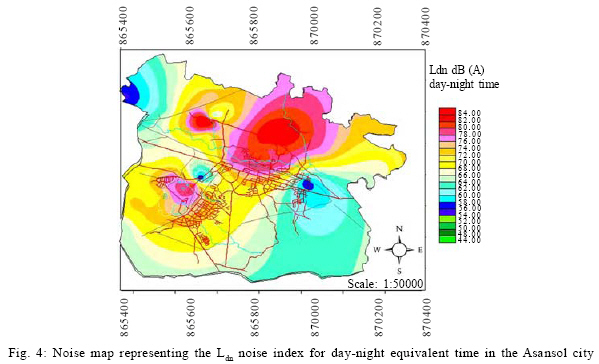
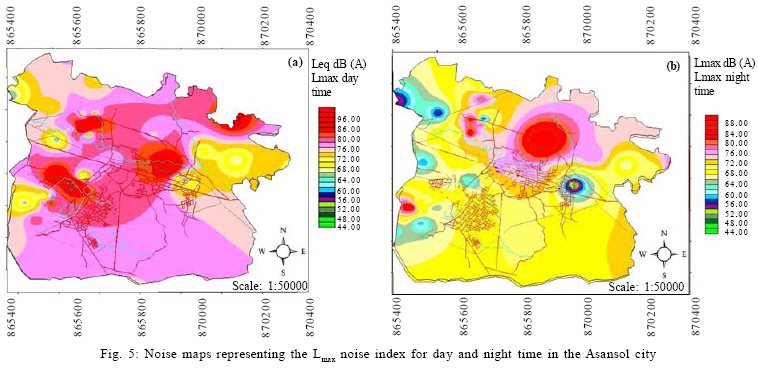
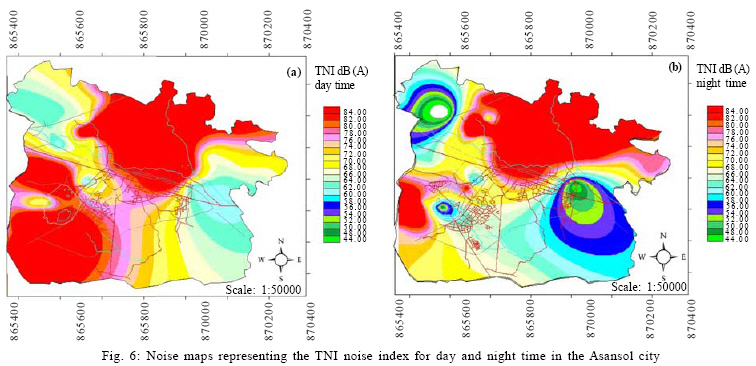
Where, Li is the noise level of the ith. reading and `N' denotes total number of recorded samples. Such data were generated for day time (07002200) and night time (2200-0700), separately. The day and night equivalent Leq values were also used to compute the Ldn values, which is a 24 h equivalent continuous level, where 10 dB is added to night time noise levels as a mark of penalty. The Ldn is expressed as: Ldn (dBA) = 10 × log10 (1/24) [16 (10 Ld/10) + 8 (10 (Ln+10)/10)] (2) The traffic noise index is a measure of the annoyance behavior of humans exposed to vehicular generated noise and estimated using the formula: TNI (dBA) = 4 × (L10 - L90) + (L90 - 30) (3) Where, L10 (background noise) and L90 (peak noise) represent the percentile noise levels exceeded for 10 % and 90 % of the sampling time, respectively. The locations of the sound level meter from the centre line of the road (r), as represented by typical measurement locations in Fig. 1, were not equal for all the sites. The distance varied according to the site specific road geometry, road width and accessibility. Hence, to maintain uniformity, all field recorded sound levels (Leq-r) were transformed to values, it would have been at a distance of 13 feet (Leq-13 ft), minimum sampling Leq-13ft (dBA) = Leq-r 20 × Log10 × (13/r) (4) In the preparation of noise contour maps, both graphing-statistical softwares and GIS tools were used. In the present investigation, multispec (Purdue Research Foundation, USA) a multispectral image data analysis system was used along with GRAM++ (C.S.R.E., IIT-Bombay, India) GIS software. The base map of the study area was loaded, delineated and digitized in AutoCADMap-2000i platform in various layers, representing the various geographic and the environment information. The produced digital map files were saved in the document exchange format (DXF) for easy integration with the other softwares used for the study. Positional coordinates of sampling locations were accurately collected using geographic positioning system (GPS-model-eTrex Vista HCx, Garmin, USA) device. The survey of India (SOI) Toposheet No 73 I/13, ward map of city and satellite imagery (IRS/P6-LISS-III of 28th. February 2008) obtained from National Remote Sensing Agency, India (NRSA), was used in the study. All geographic data were entered in the form of point, line, polygon and georeferenced. The noise contour maps were created in Roadnoise-2000 (Atkins) and also Surfer-6.02 (Golden Software Group). Maps were created using interpolation (ordinary kriging) method. Kriging is a flexible geostatistical gridding method that has been proven useful and popular in many fields. This method produces visually appealling contour and surface plots from irregularly spaced data. It can be custom fit to a data set by specifying the appropriate variogram model. RESULTS AND DISCUSSION The results of the study and interpretation are given in this section. Table 2 summarizes the traffic noise parameters used in the study. Tables 3, 4, 5, and 6 gives the computed noise levels of the different analysis zones, along with the quantified excedence value (EV), factors by which noise level exceed the national standard in that category. Fig. 2 represents typical road noise maps based on traffic data across five different types of locations. Figs. 3, 4, 5, and 6 represents the noise isopleths at 2 dB(A) intervals, of the entire city for various noise parameters. Based on the computed data as shown in Table 2 and the developed noise maps, it is observed that among the four zones, the silence zones has the highest average day-time Leq value of 73.53 dB(A), whereas residential zones have lowest value of 63.5 dB(A), the highest average noise level for night time occurs in the mixed areas (71.18 dB(A)) and the lowest in the industrial areas. The mean day time noise level was 68.65 ± 4.35 dB(A) with the highest average value in the sensitive areas while, the mean night time value was 61.64 ± 7.64 dB(A), with the highest value for mixed zone. The average of Leq (day and night) was 65.14 and the mean Ldn value was 73.66. Average Ldn value is the highest in the mixed areas (mix of residential, commercial and intersection), whereas the lowest values were observed in the residential areas. Based on the Leq, values and the other noise computed parameters, it can be mentioned that noise values are significantly higher, both during day and night time, than the prescribed safe limits. Near intersections, especially the BNR (Bengal Nagpur railway) bridge on the G.T.Road (Grand Trunk roadways) has very elevated traffic volumes and accounts for extremely high noise levels in and around the site. This area can be categorized as an high noise risk zone and is significant in the sense that residential and health establishments are within 100 m radius. The high noise prone identified areas included Ashram more (junction), Bodha more, Triveny, Kalyanpur, Ismile more, Burnpur bus stand, government hospital, Burnpur more, Asansol court, BNR and Hutton road junction. The roads passing across through these areas is the G. T. Road, Burnpur road, NH-2 (National Highway No. 2), S. B. Gorai road and Senreligh road, all being arterial roadways of the city. As represented in Fig. 2, the noise levels are much higher near the roadways and fade outwards according to the local topography. Open areas with relatively less traffic movement show reduced noise levels. The noise levels in the industrial areas as given in Table 3, varied from 65.7 to 76.7 dB(A) during day time and 45.5 and 59.9 dB(A) during night time. The day-night equivalent noise level (Ldn) varied between 66.8 and 78.0 dB(A), being higher thanthe prescribed limit of 55.0 dB(A) by the European Union (E. U.). The Lmax is the highest at the SCOB (steel company of Bengal) site; this being an important entry and exit point from the integrated steel plant. The location being an industrial entry and exit point security officers are always presented vulnerable to high levels of occupational noise exposure. A continuous exposure may lead to hearing loss and noise induced permanent threshold shift (NIPTS). Although the average traffic flow/hr is in the moderate to high range, but instantaneous noise produced mostly by heavy vehicles is significantly high. The excedence factor (EF) values were estimated to observe the extent of violation if they were from the national standards. In the industrial areas, the EF were higher during the day time due to more traffic flow and congestion. The EF value of 1.02 was observed at Triveni more during day time, whereas 0.76 was observed during night. In the mixed zones, out of the five sites, 4 were observed to have exceeded the limits with the highest factor of 1.57 at BNR. But higher value of 1.69 was observed at night time at the Burnpur more site. In the mixed zone areas that consist of two or more landuse type, like residential-commercial or commercial-sensitive, etc. the two-wheeler class was the most accounted type and is one of the annoyance causing groups. The percentage of heavy goods vehicles, which includes the trucks, dumpers, trailers, buses, etc. ranges from 0 % to 53.57 % with mean of 19.77 %. This group is the most significant factor for generation of traffic noise. Locations where heavy vehicular movement was lower had less noise levels. This is due to not only they produce noise directly, but also hamper the smooth flow of the traffic and causes frequent jams. The Leq varied between 59.6 and 89.0 dB (A) during daytime, whereas it ranged between 65.3 and 78.7 dB (A) during night time in these areas. The commercial and business establishments are of many types and varieties, including single establishments, clusters of shops and designated areas in the form of supermarkets, markets, shopping complexes, malls, etc. These establishments are lined alongside of 75% of all the major and secondary roadways of the city. The lack of proper footpaths and pavements causes the pedestrians to sprawl on the roads, which causes frequent traffic congestions and significant high noise environment. The noise levels in these zones varied between 53.0 to 80.5 dB(A) during daytime and 55.5 to 81.9 dB(A) during nighttimes as shown in Table 4. Higher noise during nighttime in comparison to daytime in certain locations was due to more people use the evening and night period for shopping and leisure activities. The movement of heavy trucks during night time also causes significantly high noise levels. The Ldn values ranged from 66.6 to 87.3 dB(A) during the monitoring period. The Hutton road junction was the noisiest with average hourly traffic flow in the high category of 2000 to 10000 vehicles/h. The EF values in these areas ranged between 0.83 and 1.24 for daytime and 1.01 and 1.49 for nighttime. The values are higher during the night due to more movement of personal vehicles during this period for leisure activities, including shopping, resulting in higher traffic congestion and more noise emissions. The excedence is significant for those commercial areas that have also moderate residential properties. The lack of proper parking lots near the markets and commercial establishments along with the ineffective traffic management systems creates severe noise emission throughout the day and especially during the morning and evening peak hours. The frequent honking of horns by bus drivers to attract potential commuters produces very high noise levels in all the commercial areas and also those areas having shops and offices under residential apartments. Noise pollution due to traffic movement is most significant in terms of residential areas. The summarized values for noise levels in these areas are given in Table 5. The detrimental effects of such exposure are well established, ranging from annoyance, hearing loss to cardiovascular diseases. The noise level in this residential areas varied from 53.6 to 76.8 dB(A) during day time and 43.5 and 70.0 dB(A) during night time. The Ldn values varied between 53.3 and 79.3 dB(A). The highest peak noise level was recorded in front of Tunnel gate, which is a entry-exit gate from the steel plant, but is surrounded by residential quarters all around within a 50-500 m radius. Although the area is well vegetated, but the noise levels were considerably high during the office hours, as observed during the course of the study. Although the vehicular movement is moderate throughout the day, but during the changing of shift hours 0800 , 1000 , 1400 , 1700 and 2200 the count were 10 times the average of the day. During these periods, the noise level in and around the area becomes extremely high. The EF values in these areas are important because it tells about the noise environment and quality of life in relation to vehicular noise. Here, the EV values were higher during the night period in comparison to day time. The day time EF values ranged between 0.93 (Santinagar) and 1.40 (Court More). During night time, it varied between 0.97 (Mohisila) and 1.56 (Kalyanpur housing and court more). Any value of EV above 1.5 in the residential zones can be considered unhealthy and a serious cause of concern. The study area also has regions that can be categorized under the sensitive zones and comprises educational institutions (schools, colleges, institutes), courthouses, religious and health establishments (nursing homes, hospitals, clinics, etc.). The summarized noise values for these zones are given in Table 6. The daytime Leq value, in these areas ranged from 60.8 to 85.6 dB(A), whereas night time Leq value ranged from 54.0 to 73.8 dB(A). The Ldn value varied between 67.6 and 81.3 dB(A). The traffic movement and congestion were observed to be high at all location classified under this category with alarming high count in front of the Asansol court area. The location of all educational and health establishment in the area are adjacent to the primary roads (G.T.Road and Burnpur Road). These locations are declared as silence zones due to nature of receivers, houses vulnerable people like patients in hospital and school children. The sensitive zones were observed to have the highest EF values in comparison to the other zones. The day time values ranged between 1.22 (private hospital) and 1.71 (Government hospital), whereas the night time values varied between 1.35 (Engineering College) and 1.85 (Judicial court premises). Immediate development of green belt in these zones is required to bring down the noise levels within the limits. The study reveals that traffic noise is a significant health nuisance in this urban-industrial city. The noise map given in the Fig. 3a and b shows the mapped Leq noise levels in terms of space and time based on collected data. The day time Leq is observed to be covering the majority of the study area especially in the northeast and south and south west areas with moderate to high level. Low to very low values are observed in the eastern edges and small area on northwest region, predominated by open and fallow areas. Very high noise hotspots are marked in patches the north and central portion. These areas have maximum settlement density and the arterial roads pass across them. As shown in the Fig. 3b about 65 % of the city has noise Leq levels lower than 55 dB(A) and lower. Moderate to high noise prone areas were marked in the northern and north-eastern regions of the city. Very high values were obtained in a small area over the NH-2 in the north-east central region. The exposure along the G.T. Road is observed to be in the medium to high noise level. As shown in Fig. 4, the majority of the city, especially in the central, north, north-east and south-western regions falls in the Ldn value of 65 dB(A) and above. Very high Ldn values were limited to the north of north-eastern areas also over the NH-2 passing zones. Low and very low value of this noise parameter is observed negligibly in extremely small pockets in the north-west boundary and central area. This noise map shows the usefulness of this type of visual representation and throws light on the day-night pattern of noise dose received by the local population. No areas are observed to have Ldn values lower than 55 dB(A), the safe limit prescribed by the across the north and south-west zones. No values of 58 dB(A) has been mapped, which shows that the exposure-annoyance is quite critical in the study area. During night time, TNI values of 80 dB(A) and above spreads over the entire north and north-eastern portion of the city. But in comparison to day time values, much lower values were marked in the east of south-east and patch in north-west region. Medium to high TNI are seen across the rest of the city, based on the night time data. CONCLUSION The study details the spatio-temporal distribution of noise, generated by urban traffic, by means of monitoring and mapping as a tool for evaluation of impact. The quantified data shows that the city is exposed to noise levels ranging mostly from the moderate to extremely high levels in comparison to the national standards. Immediate administrative and technological mitigative measures should be adopted immediately to prevent auditory and non-auditory health impacts on the local population. Control methodologies can include control of noise at source of generation. Control in the transmission path by installation of barriers between noise source and receiver can attenuate the noise levels. The barrier may be either close to the source or receiver. The design of the building along with the use of suitable noise absorbing material for wall/door/window/ceiling will reduce the noise levels. Other measures include raising the awareness among local community, more No Horn signs and strict enforcement of laws. ACKNOWLEDGEMENTS The authors express sincere thanks to the Principal, B. B. College, Asansol and Department of Environment and Water Management for providing financial and other support to carry out the research project. The authors also wish to thank the Director, NIT, Durgapur and Principal, B. B. College, Asansol for their kind permission to publish the findings in the form of this research article. REFERENCES
© IRSEN, CEERS, IAU The following images related to this document are available:Photo images[st09036t4.jpg] [st09036t5.jpg] [st09036f3.jpg] [st09036f1.jpg] [st09036f2.jpg] [st09036f5.jpg] [st09036t6.jpg] [st09036t3.jpg] [st09036t1.jpg] [st09036f4.jpg] [st09036f6.jpg] [st09036t2.jpg] |
| |||||||||
