 |
| About Bioline | All Journals | Testimonials | Membership | News |
|
||||||
|
||||||
International Journal of Enviornmental Science and Technology, Vol. 6, No. 3, Summer, 2009, pp. 359-368 Conceptual hydrosalinity model for prediction of salt load from wastewater flows into soil and ground water 1 M. Abbaspour; 2*S. A. Mirbagheri; 3M. Monavvari; 4A. H. Javid; 4H. Zarei 1 School of Mechanical Engineering, Sharif University of Technology and Graduate School of the Environment and Energy, Science and Research Branch, IAU, Tehran, Iran Received 10 October 2008; revised 27 January 2009; accepted 5 May 2009 Code Number: st09040 ABSTRACT Dynamic hydrosalinity models are available, but are not used extensively on a large scale soil which receives wastewater from industrial areas, partly because adequate database are expensive to be obtained. Thus, for this reason, there is an urgent need to assess the salt and other pollutant loads collected in wastewater flows into the soil and/ or ground water systems. A conceptual hydrosalinity model was used on two major underlying principals of mass balance and steady state. This model was initially tested on the 4,117 km2 plains west of the Yazd-Ardakan district in the central part of Iran. This model was used at a time when the soil and ground water salinity problem was serious due to the high shortage of water. It was possible to calibrate the model with ± 2 % of the flow volume and total dissolved solids of the industrial wastewater discharge from over 2,000 factories. The verification results were 98 % of the measured values. Moreover, this model was tested for the verification of the model data from the analysis of 36 wells' water in the area where industrial wastewater discharge was used. The results showed that most of the indices of total dissolved solids, total suspended solids, biological oxygen demand and chemical oxygen demand are above standard levels. The results of the model can be used for the management practice of the reduction of salt pollutant load in the area to achieve sustainable development for location of industries in the study area. Keywords: Arid zone; Hydrosalinity; Industrial wastewater flow; Ground water pollution INTRODUCTION Water is essential to all forms of life and makes up 50-97 % of the weight of all animals and about 70 % of the human body (Buchholz, 1998). Water is also a vital resource for agriculture, manufacturing, transportation and many other human activities. Despite its importance, water is the most poorly managed resource in the world (Shalini et al., 2004). Ground and surface water can be contaminated by several sources in urban areas (Khublarian, 1989). The careless disposal of industrial effluents and other wastes may contribute greatly to the poor quality of the water (Chindah et al., 2004; Emangor et al., 2005; Furtada et al., 1998; Karbassi and Shnakar, 1994; Ugochukwu, 2004). Water, the only precious natural resource to mankind is also one of the main drawbacks of the present century (Currie, 1998; Simmons et al., 2002). The changes that occur in the world today due to these drawbacks can also have many positive and negative effects. Of the 130 billion cubic meters of water available in Iran, the consumption of water is roughly 71 % of that amount. Water consumption estimates for 2031 and 2032 show that Iran will be one of the countries facing heavy shortage of water supply (Jamab, 2001). The Central Province, situated in a dry tropical area has very little rainfall and therefore, can be considered as one of the driest areas of the world (Alizadeh, 2003). The increase in the rate of population, together with fast industrial expansion has led to heavy water consumption on the one hand, and on the other, less rainfall has forced experts to study the future status of this province and to make adjustments and effective decisions about this area. Today, the civilized world is worried about the future and especially, environmentalists have taken steps to study the threatening crisis of water in the future. No doubt, the World Conference held in Rio de Janeiro had some influence on the decisions that had to be made, but they were not effective in solving outstanding issues (Le Houérou, 1996). Among the natural disasters that threaten human life today, shortage of water supply together with water pollution, are two unknown crisis of the future (Jordan et al., 1993). Loss of human life, compared to AIDS or even regional wars, could probably be even relatively much more. The U.N. has predicted that by the year 2050 more than 4.5 billion people of the world may lose their lives either due to water pollution or shortage of water. Annually 2 million children die because they are unable to drink pure healthy water and more than 2.4 billion types of diseases of the world today are due to water pollution (Ardakanian, 2003). Yazd, one of the central cities of Iran is facing a heavy shortage of water supply, especially in the areas surrounding Yazd-Ardakan. The quality of clean filtered water has been greatly reduced because of industrialization and non-sanitation of wastewaters that flow from industrial sites. Moreover, this province lacks of natural reservoirs for storing water and is heavily dependent on ground water and wells for its water supply. Yazd is a metropolitan city where is dependent both on industry and agriculture for its growth. Yazd-Ardakan occupies about 12,607 Km2 and uses about 10 % of water consumption and 99.4 % of the province industries are centralized in this area. The main objectives of this study are:
Previous investigations Literature on pollutant transport in soil and water systems revealed a number of ciations (Jalali et al., 2008; Mapanda et al., 2007). However, none of the cited references considered the leaching of pollutants such as dissolved salts, heavy metals and organic materials in the soil down to ground water tables (Mirbagheri and Kazemi, 2008; Mirbagheri et al., 2008; Olayinka and Alo, 2004). Moreover, none of the references predict the pollutant by developing a conceptual model. Rather, the references reveal the effects of exchangeable sodium on soil and plant storage, model for ground water pollutant prediction, strategy for desert development and management and the use of modeling and water efficiency programs for arid zones. Therefore, many of the selected studies on pollutant transport in soil systems and ground water quality management produced theoretical research models that have not been applied to actual world soil systems, but some of the models were applied to watershed or catchment areas (Bowmer and Laut, 1992; James and Muller, 1992). Other papers (Howari and Banat, 2002; Peluso et al., 2001) studied the effect of pollutants in surface water quality, but the required parameters for model development were seldom measured in the field. The literature also revealed that researchers are mainly concerned about pollutant storage in soil and plant uptake, but there is little effort for pollutant transport and ground water contamination estimates by developing a conceptual model, a subject matter of interest to this investigation. MATERIALS AND METHODS The Yazd-Ardakan district is an urbanized part of Yazd Province, comprising both industrial and agricultural facilities. This study focuses on the scientific and statistical information collected throughout the country, especially from the Province of Yazd. Initially, this study focuses on information regarding the condition of ground water in the province then on the way water is being drawn, consumed and evaluated as well as, the classification of industries in that area according to the type of product, the spread of these industries in other provinces and the concentration of hydrological units in the study area. About 79 % of the industries in Yazd Province are mainly hydrological units of the Yazd-Ardakan district. Consequently, the amount of water consumption and the production of industrial sewage in this area have been analyzed. The next stage of this study focuses on the industries in this area and their pollutant potential. The type of pollutant and industrial wastewater characteristics show that the textile, food industries and construction sites are the most important contributors to the quality and quantity of industrial sewage. With the aim of determining the features of industrial wastewater, a sampling was performed in this area and later on, with the help of a standard method (APHA, 2005; AWWA, 1990; Hai-long et al., 2006). The pH, TSS, TDS, COD, BOD, chlorine and alkaline ions were tested. The pH was measure directly, either in the wastewater or water using a pH meter. Electrical conductivity (EC) was measured directly either in the wastewater or water using conductivity meter. Dissolved oxygen (DO) was measured directly using a DO meter. Biological oxygen demand (BOD) was determined by conventional methods (AOAC, 2002; Metcalf and Eddy, 2003). A sample of the solution (5 0 mL) was placed into a 500 mL BOD bottle and filled to the mark with previously prepared dilution water. A blank solution of the dilution water was also prepared and placed in a BOD bottle. The bottles were sealed and incubated for five days at room temperature. BOD was calculated from this equation: BOD= (D1-D2/P), where D1= dissolved oxygen 15 min after preparation, D2=dissolved oxygen in diluted sample after incubation and P=amount of sample used. Suspended solids (SS): A sample (200 mL) was left to stand for 20 min (WHO, 1996), after which it was poured into a previously weighed platinum dish and evaporated to dryness (CL). Anion was determined by titration of the sample with silver nitrate. Potassium chromate (5 %; 1 mL) was added to 100 mL of the sample and titrated with 0.1 mL silver nitrate solution until the solution turned a buff color (AOAC, 2002). Alkalinity was obtained by titrating 50 mL of the sample with HCL (0.1 mL). Sampling of 36 ground water wells was performed to determine the effect of industrial sewage on the ground water, as well as the extent to which water pollution influences the quality of these water. The results were then compared to studies that had taken place in 1999 and 2001 in the same area. Model formulation A conceptual dynamic hydrosalinity model of water flow and salt movement was developed in this study. This model is based upon two major underlying principles of mass balance and constant state (Gao et al. , 2007). This model was initially tested on the 4,117 Km2 Yazd-Ardakan planes located in the 12,607 Km2 hydrologic basin of Yazd Province where salinity problems are serious. The model formulation was based on the following assumptions:
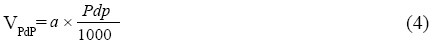
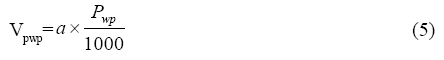
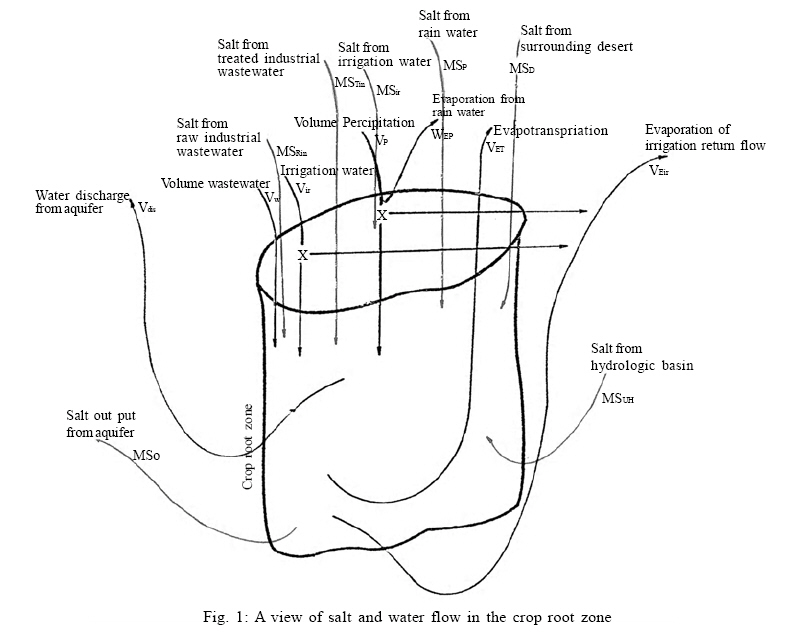
A conceptual view of salt and water flow in the crop root zone portion of the soil-water system is shown in Fig. 1. According to Fig. 1 and on the bases of data collected in the study area, a mass balance equation may be written for the water flow, as well as for the salt flow in the soil column above the ground water table. Water flow model input to the system Viw=KIW(1-K tiw) (1) Vitw=VIn×K IW×KtIW (2) Vuw= Vur × Kuw (3)
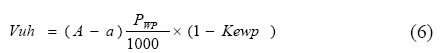
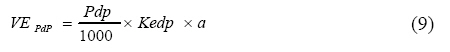
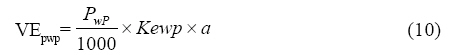
Vti= Vir+ Viw+ Vitw+ Vuw+ VPwP+ Vuh+ VPdP (7) Where, Vir = volume of annual irrigation water Viw = volume of industrial wastewater Vitw = volume of treated industrial wastewater Vuw = volume of sanitary wastewater Vpdp = volume of rainfall in drought period Vpwp = volume of water in wet period Vuh = volume of water flow from the hydrologic basin outside the basin into the study area Vti = total flow into the study area Coefficients Kiw, Kitw, Kuw and Kewp are defined in Table 1. Water flow model out put from the system VEIr= VIr× Keir (8)
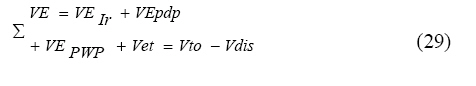
Vet = VIr × R (11) Vdis = VIr + VIn + VUr (12) Vto = VEir + VEPdP + VEpwp + Vet + Vdis (13) ΔV = Vti − Vto (14)
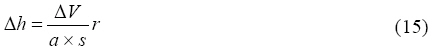
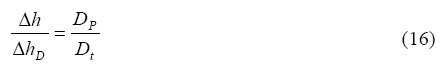
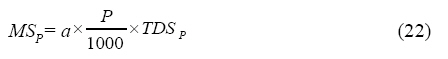
Vid = ad × Δ hd × Sd (17) V= V+ VId (18) Where: VEir is the volume of evaporation from the irrigation return flow per year VEpdp is the volume of evaporation from the rain water in drought period VEpwp is the volume of rain water evaporation in wet period Vet is the volume of evapotranspiration from the plant Vdis is the volume of water discharged from the aquifer for different usage Vto is the total water output from the system ΔV is the change of storage Δh is the decrease in water table Vid is the seepage of water from the surrounding area into the study area ΔV is the overall water balance of the aquifer Salt flow model input to the system MSIr = VIr × TDSIr (19) MSrin = Vin × Kiw × (1-Ktiw )× TDSin ( 20) MStin = Vin × Kiw × Ktiw × TDStin (21)
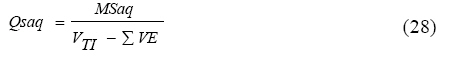
MSd = Vid × TDSd (24) MSt = MSir + MSrin + MStin + MSp + MSus + MSp (25) Where MSir is the salt flow from irrigation water into the system MSrin is the salt flow from raw industrial wastewater MStin is the salt flow from treated industrial wastewater MSp is the salt flow from rainwater MSuh is the salt flow from hydrologic basin seepage into the system MSd is the salt flow from the surrounding desert area MSt is the total salt flow into the system Salt flow model out put from the system MSo= MSt× Kd (26) MSaq= MSt- MSo (27)
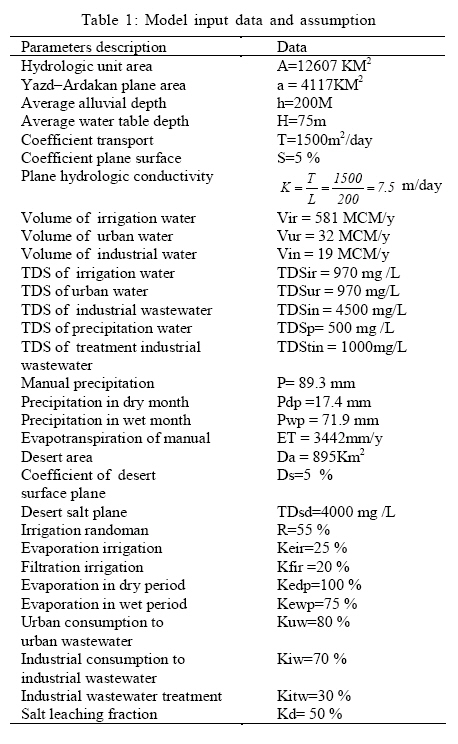
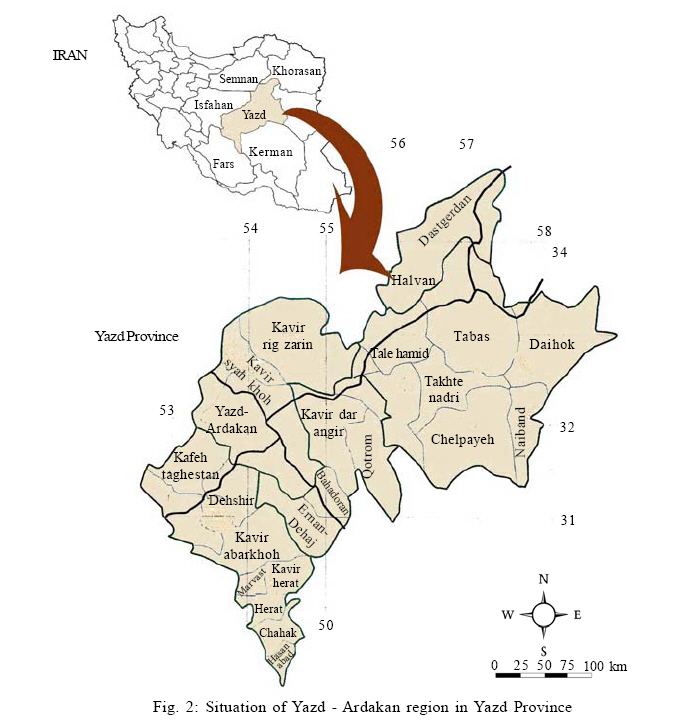
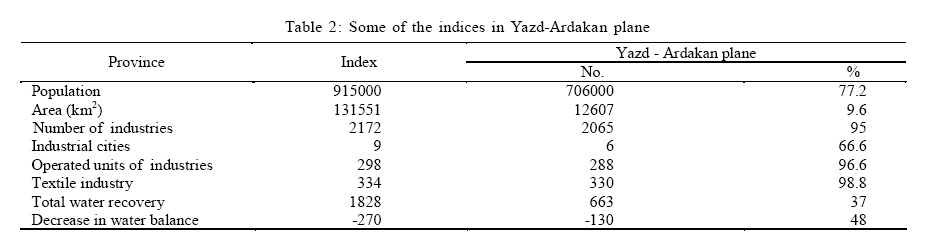
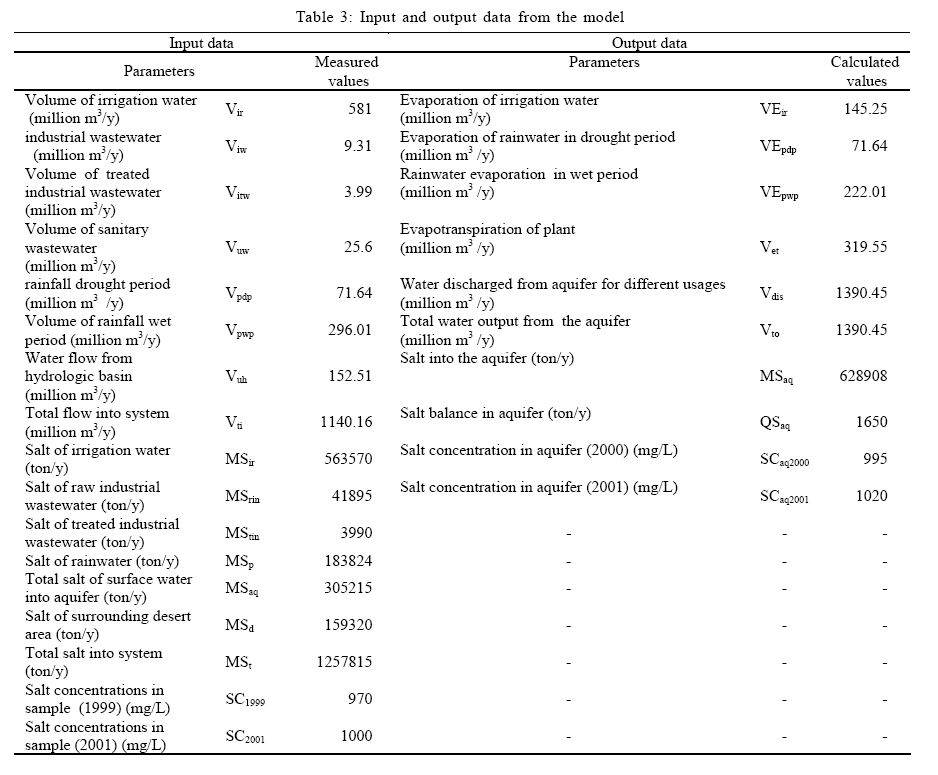
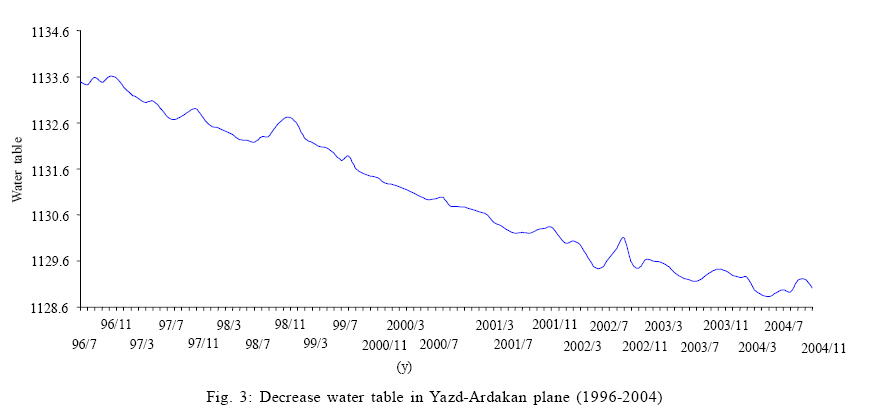
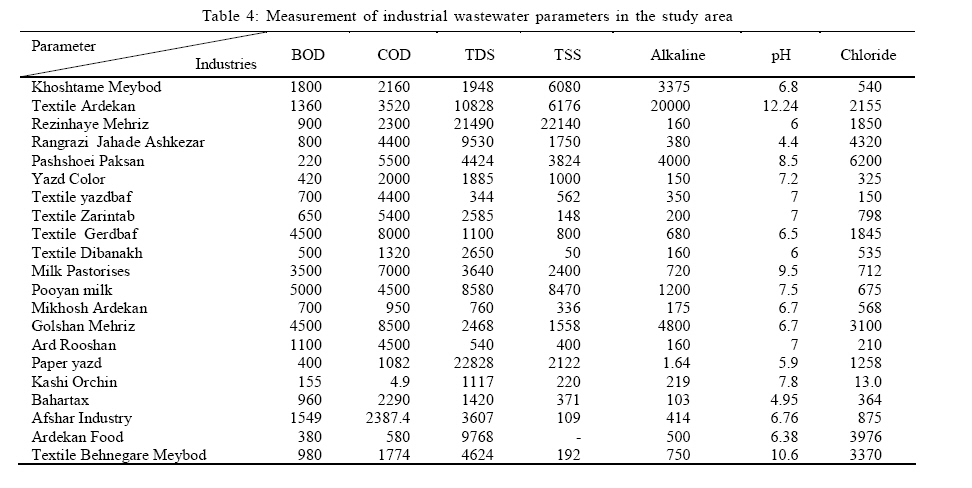
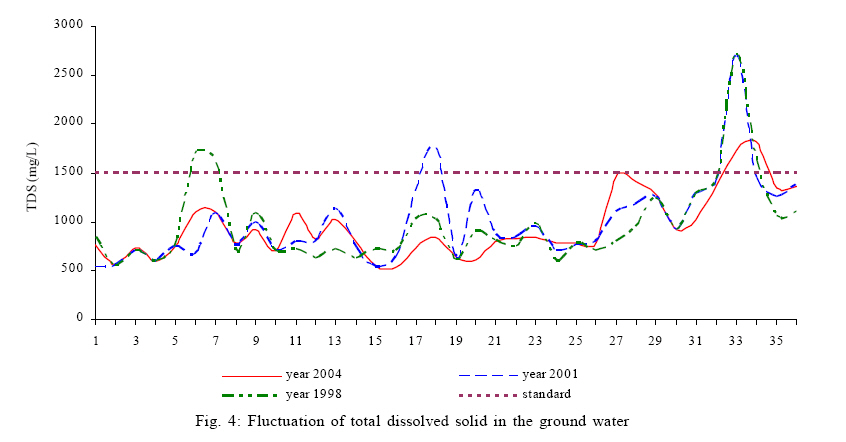
Where: MSo is the salt flow out put from the aquifer MSaq is the salt flow into the aquifer Qsaq is the salt balance in the aquifer The model input data and assumptions are summarized in Table 1. However, the data of the parameters listed in Table 1 was measured using the grab samples of the rains and surface runoffs collected from the study area. Model application The model was used to calculate the transport and accumulation of total dissolved solids (TDS) and water flows into the Yazd-Ardakan plane, a hydrologic unit of the Yazd Province. This watershed unit measuring 12,607 Km2 is about 10 % of the total area of the Yazd watershed shown in Fig. 2. The Yazd-Ardakan plane is very important economical aspects, as well as environmental views. Table 2 shows some of the important indices in the Yazd-Ardakan region. Geologically, the structure of the ground water basin in this area is alluvium with fine grain size. The ground water table is an unconfined aquifer fluctuating during the year especially during drought year periods. Since the ground water basin is impermeable at the bottom layer and on both sides, there are no side or bottom flows to the neighboring load water basins. The soil in this area is heterogeneous and unisotropy and the flow direction is horizontal. The main water resource in this area is from rainfall runoff and discharge of drainage water from irrigated croplands. The industrial wastewater inflows are not controlled but are considered as incremental flows of water and salt into the system. RESULTS AND DISCUSSION Measured and calculated salt concentrations were compared for total flow (irrigation, industrial wastewater and rainfall for wet and drought periods) of 1,140.16 million m3/y to determine the accuracy of the calculation. Calculated measured data is summarized in Table 3. Calculated values for total water input into the system is 1,140.16 million m3 and total water output from the aquifer of the system is 1,390.45 million m3 (Table 3). The comparison between input and output water from the system shows that there is a negative water balance. The decrease from 1996 to 2004 in the water table is shown in Fig. 3. The decrease in water input to the aquifer causes an increase in salt concentration of the discharged water from the aquifer from 995 mg/L in year 2000 to 1,020 mg/L in year 2001 as shown in Table 3. The measurement values of BOD, COD, TDS, TSS and chloride from industrial wastewater of the area is shown in Table 4. The ground water depth in this area is very high (about 70 m) and the input water is too low. The leaching traction of water to ground water is only 50 % during wet years and 0 % during drought years. Therefore, about 50 % of salt accumulates in the wetted front before reaching the ground water table. The salt input to the aquifer is on an average 628,408 tons/y. The salt balance concentration in the aquifer, calculated by the conceptual model, was on average 1,020mg/L in 2001, as compared to the measured values of salt which was about 1,000 mg/L in the same year. Fig. 4 shows the total dissolved solid fluctuation in the ground water of this area. Fig. 4 also shows the salt load increases as the water table drops. Therefore, the measured and calculated values are in good agreement. The difference is only 2 %. The calculated values of salt by model also indicates that the salt concentration in the aquifer will increase 2.5 % annually, this means that according to the model prediction the salt concentration from year 2001 to 2021 increase by the following equation: Sc2021 = Sc2001 (1+r) 20 = 1020 (1.025)20 = 1670 mg/L (30) Where, r is the rate constant for salt increase. In addition to conceptual model a regression model was developed for the relationship between electrical conductivity and total alkalinity (TA), as well as total dissolved solids, also EC and TA with chloride concentration and CL with TDS and TA and the following result lead to the equations indicating that the EC is related to TA and TDS with correlation coefficient of R= 89.5 % and EC also is related to TA and CL with correlation coefficient of R= 90 % and CL is related to TDS and TA with correlation coefficient of R= 94.5 %. The regression equations are as follows: EC= 1.569 TA+ 1.065 TDS- 23.66 (31) EC= 1.611 TA+ 0.808 CL + 723 TDS+ 50.48 (32) CL= 0.423 TDS- 0.051 TA- 91.71 (33) CONCLUSION A conceptual hydrosalinity model for predicting salt load from industrial wastewater flows into soil and ground water in the Yazd-Ardakan planes was developed, since the constituents of ground water is important in the water supply systems for domestic, industrial and agricultural use. With increased use, sometimes even above permissible levels, ground water quality often deteriorates. In recent years, public attention has been focused on ground water contamination by hazardous industrial water leaching from landfills, oil spills and agricultural activities and by sites of radioactive waste deposits. In most cases, the source of contamination is above ground surface, with contaminants passing through the unsaturated zone on their way to an underlying aquifer. Proper management of water resources requires the ability to forecast the response of the managed system of the aquifer, to planned operations such as, pumping, recharging and control of the conditions at aquifer boundaries. Any planning of mitigation, clean up and control measure requires forecasting the path and fate of the contaminants in both the unsaturated zone and the aquifer. The tool for prediction is a numerical or conceptual model that calculates the flow and pollution movements and transformation. This leads to develop a one dimensional dynamic conceptual hydrosalinity model, in order to calculate the water flow and transport of salt in 4,117 Km2 west of the Yazd-Ardakan district. This model is based on mass balance and constant state equations. The calculation results correspond to measured values. Therefore, this model is a useful tool for appraising salinity problems in similar systems. REFERENCES
© IRSEN, CEERS, IAU The following images related to this document are available:Photo images[st09040f1.jpg] [st09040t4.jpg] [st09040f4.jpg] [st09040t1.jpg] [st09040f3.jpg] [st09040f2.jpg] [st09040t2.jpg] [st09040t3.jpg] |
| |||||||||

