 |
| About Bioline | All Journals | Testimonials | Membership | News |
|
||||||
|
||||||
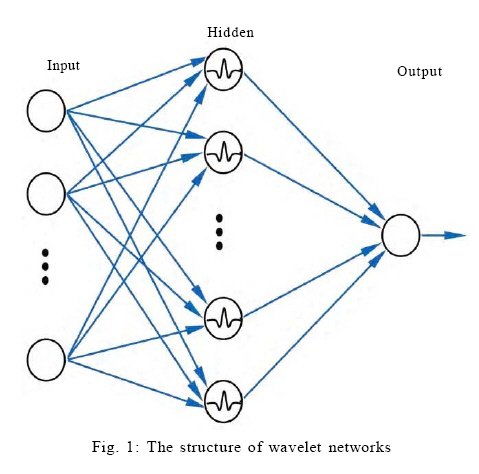
International Journal of Enviornmental Science and Technology, Vol. 6, No. 3, Summer, 2009, pp. 395-406 Modeling of a permeate flux of cross-flow membrane filtration of colloidal suspensions: A wavelet network approach 1 A. L. Wei, 1 *G. M. Zeng, 1,2 G. H. Huang, 1 J. Liang, 1 X. D. Li 1 College of Environmental Science and Engineering, Hunan University, 410082 Changsha, Hunan, P.R. China Received 4 March 2009; revised 19 April 2009; accepted 10 May 2009 Code Number: st09044 ABSTRACT Although traditional artificial neural networks have been an attractive topic in modeling membrane filtration, lower efficiency by trial-and-error constructing and random initializing methods often accompanies neural networks. To improve traditional neural networks, the present research used the wavelet network, a special feedforward neural network with a single hidden layer supported by the wavelet theory. Prediction performance and efficiency of the proposed network were examined with a published experimental dataset of cross-flow membrane filtration. The dataset was divided into two parts: 62 samples for training data and 329 samples for testing data. Various combinations of transmembrane pressure, filtration time, ionic strength and zeta potential were used as inputs of the wavelet network so as to predict the permeate flux. Through the orthogonal least square alogorithm, an initial network with 12 hidden neurons was obtained which offered a normalized square root of mean square of 0.103 for the training data. The initial network led to a wavelet network model after training procedures with fast convergence within 30 epochs. Futher the wavelet network model accurately depicted the positive effects of either transmembrane pressure or zeta potential on permeate flux. The wavelet network also offered accurate predictions for the testing data, 96.4 % of which deviated the measured data within the ± 10 % relative error range. Moreover, comparisons indicated the wavelet network model produced better predictability than the back-forward backpropagation neural network and the multiple regression models. Thus the wavelet network approach could be employed successfully in modeling dynamic permeate flux in cross-flow membrane filtration. Keywords: Artificial neural network; Colloidal fouling; Prediction; Ultrafiltration separation; Wavelet INTRODUCTION Applications of membrane technology in water and wastewater treatment have been growing steadily in recent years (Brindle and Stephenson, 1996; Liao et al., 2006; Visvanathan et al., 2000). Many full-scale facilities are running with immersed microfiltration or ultrafiltration membranes mainly because membranes can offer higher efficiency for liquid-solid separation (Visvanathan et al., 2000). However, the effectiveness of membrane separation is greatly affected by fouling- the decline in permeate flux due to accumulation of colloidal matter, organic molecules, sparingly soluble inorganic compounds and microorganisms on membrane surfaces or in membrane pores (Defrance et al., 2000; Song, 1998; Zhang and Song, 2000). Fouling is an unavoidable deleterious phenomenon in membrane filtration and makes membrane technology less competitive in many applications. Therefore, understanding membrane fouling and developing controlling methods are crucial for the future of membrane technologies. To optimize the operation of membrane filtration, many modeling methods have been used to predict the permeate flux decline in recent years. Among these methods, theoretical models have been established using numerous factors, which include feedwater characteristics (such as types of foulants, pH and ionic compositions), membrane properties (such as surface roughness, charge properties and hydrophobicity) and operational conditions (such as transmembrane pressure, cross-flow velocity and temperature) (Li and Elimelech, 2004; Song, 1998). Theoretical models can produce highly detailed and complex descriptions of membrane fouling; however, they are computationally intensive and demand a high-level modeling expertise (Bowen et al., 1998). Moreover, the mechanisms of membrane fouling and the effect of key factors on fouling are still not clear or quite controversial (Tarleton and Wakeman, 1993; Zhang and Song, 2000), which makes theoretical models designed with some necessary assumptions. Such assumptions result in models which are only valid for certain types of feedwater under certain conditions. In order to control membrane filtration effectively and easily, alternative methods are desired. Because avaiable information often consists of measured data of several factors and permeate flux, the alternatives are expected to depend not on deep insight into complicated mechanisms, but on full utilization of available information. Furthermore, such an alternative must have the ability to determine the connections between input and output only by analyzing process data. Fortunately, data driven models, such as artificial neural networks (ANNs), could act as these alternatives. ANNs are mathematical algorithms that simulate the capacityof the biological brain to solve complex problems, and have the ability to approximate almost any function in a stable and efficient way (Chattopadhyay and Bandyopadhyay, 2007). ANNs have already been extensively applied to modeling membrane filtration (Chen and Kim, 2006; Cheng et al., 2008). In all types of ANNs, feedforward backpropagation neural networks (BPNNs) and radial basis function networks (RBFNs) have been proven to be the two most attractive methods for modeling membrane filtration until now (Al-Abri and Hilal, 2008; Aydiner et al., 2005; Chen and Kim, 2006; Sahoo and Ray, 2006). Dornier et al. (1995) first used BPNNs to predict the dynamic process of membrane fouling during cross-flow microfiltration of crane sugar. They studied the effect of the BPNN hidden structure and different distributions of training data on the predictability, and they obtained satisfactory accuracy. In following studies, BPNNs have been shown to be sometimes better suited and more useful for high nonlinear processes of membrane filtration (Chellam, 2005; Cinar et al., 2006; Curcio et al., 2006; Ni Mhurchu and Foley, 2006). Unfortunately, there are lack of reliable rules for the choice of the hidden structure of BPNNs and the common way is by trial and error. Moreover, initial parameters of BPNNs are often assigned random values which cause a slow convergence during training process. On the other hand, using the experimental data of Fabish et al. (1998), Chen and Kim (2006) found that RBFNs achieved better predictions than BPNNs. However, Sahoo and Ray (2006) pointed out that the results of Chen and Kim (2006) were obtained through the ANNs with unoptimized structures. With the same experimental data of Fabish et al. (1998), they showed that there was no apparent difference in predictability between BPNNs and RBFNs when the structures of the both type of networks were optimized by genetic algorithms (GAs). Although the GA optimized networks may improve the predictability of ANNs, Cheng et al. (2008) stated that the GAs are inclined to encounter the pitfall of over fitting when the number of neurons is too large because of their intrinsic randomness. Cheng et al. (2008) presented a modified RBFN (MRBFN) which showed good convergence resulting from a well initialized structure. They constructed the MRBFN by choosing neurons from a set candidate neurons which were prior determined according uniform partitions of the domain of interest at different levels. However, their method could encounter the problem of dimension curse when the input dimension increases, because the increasing dimension leads to an exponential increase of the uniform partitions of the domain. In particular, the dimension curse becomes more severe when higher levels are carried out in the case of higher input dimension; and above all, this dimension curse makes the choosing neurons of the MRBFN with higher cost of computation. Despite the vast efforts to improve the efficiency of ANNs in membrane processes as above, there are still some problems, for instance, lack of specific methods or the danger of encountering lower efficiency to determine the initial network structures and the initial parameters. Therefore, a more efficient type of ANNs will be preferred to model the complex process of membrane filtration. Wavelet networks have shown to be a promising alternative to traditional ANNs (Zhang and Benveniste, 1992) and many studies describe wavelet networks as a powerful tool for function approximation (Zhang and Benveniste, 1992; Zhang et al., 2001), system identification (Billings and Wei, 2005; Sjoberg et al., 1994), automatic control (Sanner and Slotine, 1998; Oussar et al., 1998), etc. Such network is a special 3-layer feedforward network as shown in Fig. 1 which is calculated as follow:
Where,
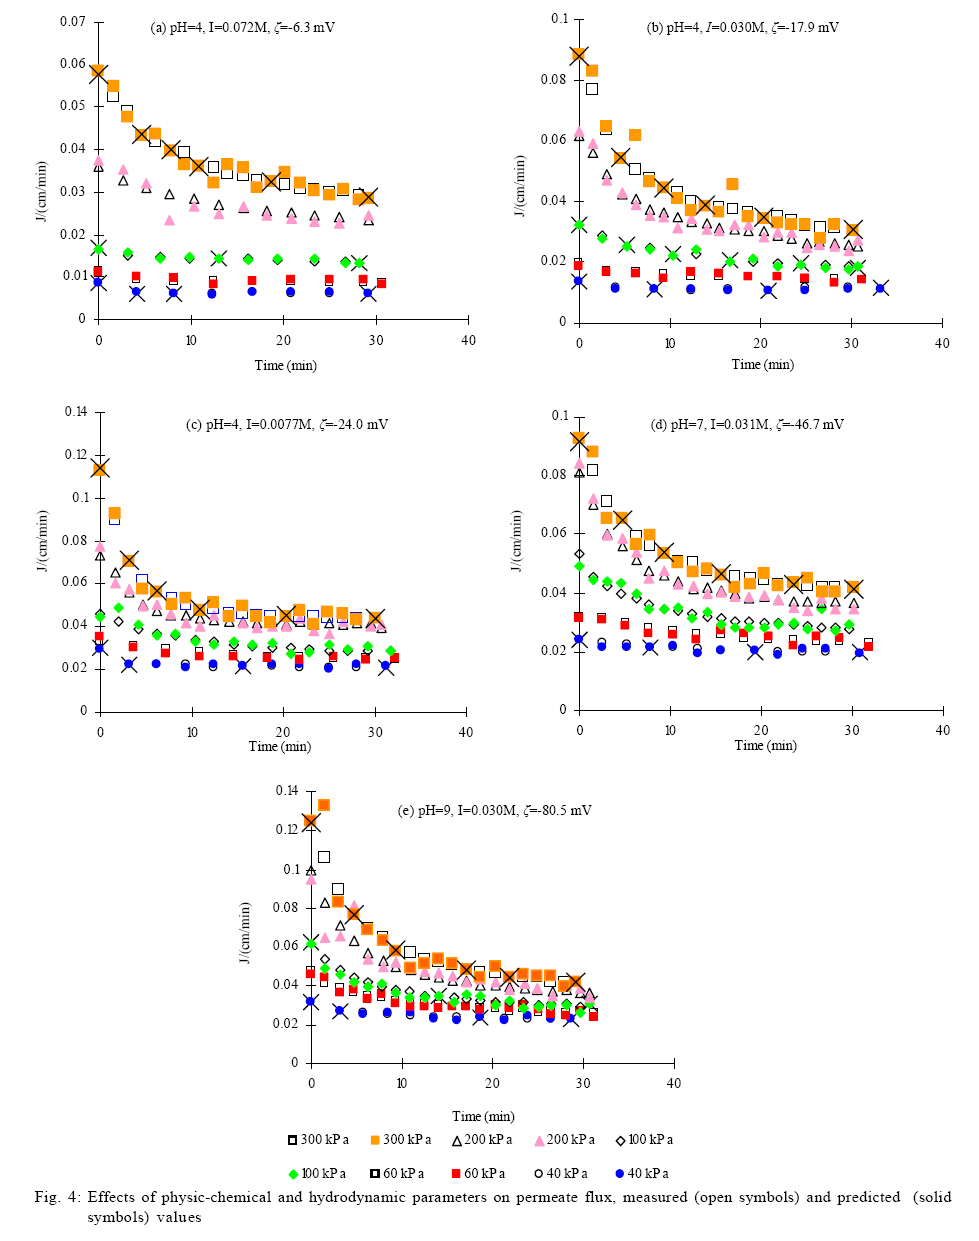
Where α and β are the dilation and translation step sizes (typically α=2, β=1), respectively, m is the translation index and n is the dilation level. Each wavelet in the family (2) has finite support. Support refers to the region where the function is nonzero. The wavelet function of the family (2) can exhibit a support that is compact or rapidly vanishing (Daubechies, 1992). The wavelet family can be used as tools for function analysis and synthesis. The concept of a wavelet family is very similar to a set of sine functions at different frequencies used in Fourier analysis. The family (2) is used as a set of candidate wavelets that constitute the original form of Eq. 1, i.e., the initial wavelons are chosen from the family (2). For a set of training data, only part of wavelets in the family (2) are useful for constituting the wavelet network model because most wavelets may cover no data due to their compact supportness (Zhang, 1997). In addition, the set of training data in practical case is often sparse, and this sparseness leads to a further reduction of the number of candidate wavelets in family (2). Clearly, both the wavelet compact supportness and the sparseness of training data make the selection of initial wavelons in Eq. 1 more convenient. Once a given number of initial wavelons have been chosen, the initial value of the connecting weight (ω) can be determined by linear regression (Zhang, 1997). Compared with traditional ANNs, wavelet networks obviously offer a high efficient approach for constructing the initial form of networks. Many studies have exhibited the high efficiency of wavelet networks according to different constructing methods, such as the orthogonal least square (OLS) algorithm and backward elimination algorithm (Oussar and Dreyfus, 2000; Zhang, 1997). In particular, Zhang (1997) has reported that wavelet networks converged fast during training processes because of their better initialization and wavelet networks already offered a comparable accuracy even in their initial form. Specific constructing methods, better initialization of internal parameters and fast convergence, all of them make wavelet networks more suitable than traditional ANNs for modeling complex nonlinear processes. Although the great benefit of wavelet networks has been successfully applied to many fields, any wavelet network application to membrane systems has not been reported yet. In this paper, the wavelet network approach was used to modeling a process of cross-flow membrane filtration based on the published dataset of Bowen et al. (1998). The purpose of the current investigation was to demonstrate the high efficieny of a wavelet network; to study its predictability of permeate flux under various operating conditions and to compare its capability with those of BPNN and the conventional multiple regression (MR) method. The research was undertaken in Environmental System Laboratory located at College of Environmental Science and Engineering, Hunan University, P.R. China in 2009. MATERIALS AND METHODS Experimental data This study used the experimental data which has been published in Bowen et al. (1998). In the experiments, spherical silica colloids with a mean particle diameter of 65 nm were used to perform cross- flow membrane ultrafiltration at five different combinations of pH and ionic strength (I). For each combination of pH and I, the permeate flux was measured under five different transmembrane pressures (ΔP) as shown in Fig. 4. In this paper, I, ξ, ΔP and time (t) acted as the input of wavelet networks to predict the dynamic permeate flux. Out of 391 data samples, 62 samples were chosen as training data such that more samples were located in regions of greatest curvature, as shown in Fig. 4. The other 329 samples were used as testing data. Prior to be inputed the wavelet network, the values of all experimental data were normalized between -1 and 1 as below:
Where, Constructing and training the wavelet network According to Eq. 1, a so-called Mexican hat wavelet (Zhang, 1997) was chosen as a mother wavelet with the following form:
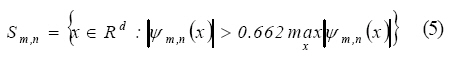
Where, d is the dimension of x, ||x||2=xxT. Then a family of candidate wavelets was determined by the mother wavelet and the training data. Then, further development was done by selecting different number of wavelons from the candidate family according to the OLS algorithm and then, the number of wavelon was determined by the generalized cross-validation (GCV) criterion. The GCV, a modified form of cross-validation, is a popular method for choosing the smoothing parameter. An important early reference is Craven and Wahba (1979). The GCV criterion consists in estimating the expected performance of the model evaluated with fresh data based on the required data (Zhang, 1997). Thus an initial form of the wavelet network model was achieved. In the end, the initial wavelet network was trained to get the final wavelet network model. The detailed steps are listed as follows: 1) Definition of wavelet support: For øm,n(x) in the family (2), denote by Sm,n its support, i.e.,
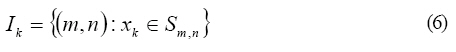
2) Generating the family of candidate wavelets: With the definition of Sm,n, each training point xk among N training points is examined within five dilation levels (n=0, 1, 2, 3, 4) to find the wavelets whose supports contain xk. Then the index set of the found wavelet, Ik, is defined by:
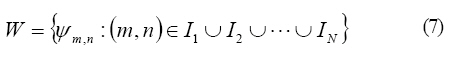
The union of Ik for all xk in the family (2) gives the indices of candidate wavelets whose supports contain at least one training data point. This results in the family of candidate wavelets
Let L be the number of wavelets in W. For convenience of the following presentation, the double index (m, n) is replaced by a single index j=1, 2, …, L, i.e.,
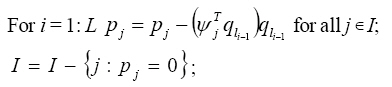
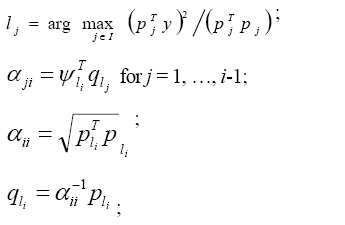
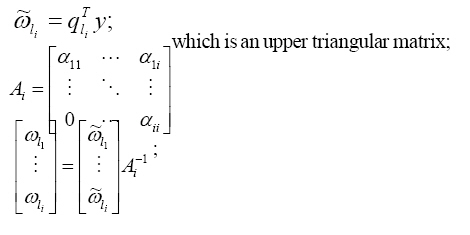
3) Determination of the initial wavelet network: The initial wavelet network is achieved by a hybrid algorithm (Zhang, 1992; Zhang, 1997) where, the OLS algorithm determines the relative optimal combination of certain number of candidate wavelets and then the GCV criterion points out the most reasonable combination of certain number of candidate wavelets. The hybrid algorithm can be done as follows: Algorithm: I={1, 2, …, L};
l0 = 0, ql0 = 0; Begin-loop
If I is empty, set s = i-1 and break the loop;
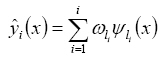
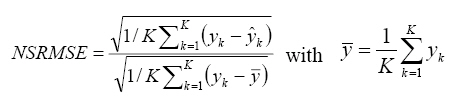
As a result, the initial wavelet can be achieved with the form of Eq. 1. 4) Training the wavelet network: A common backpropagation training method is applied to fit the training data, as well as possible in this paper. The details about back-propagation method can be found in Haykin (1999). The performance of the training process is evaluated with normalized square root of mean square (NSRMSE)
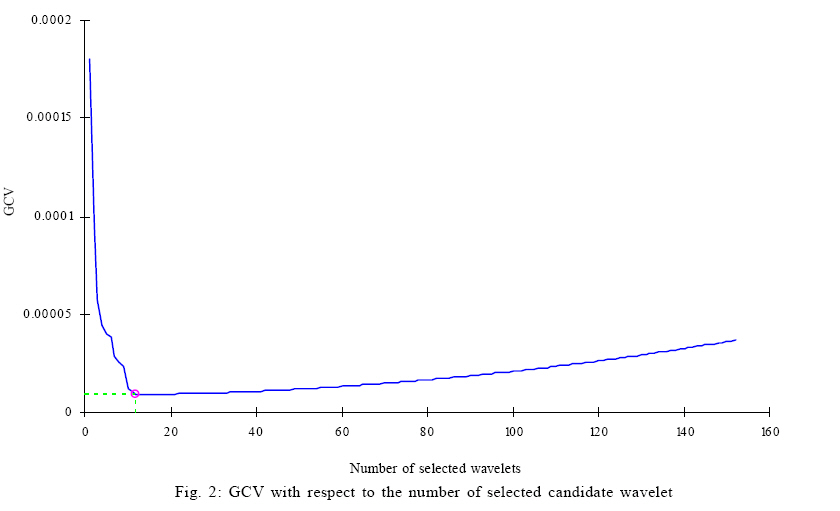
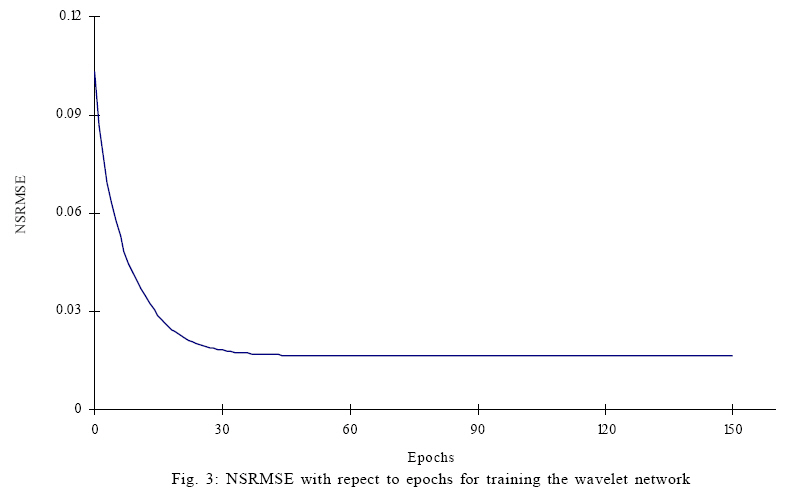
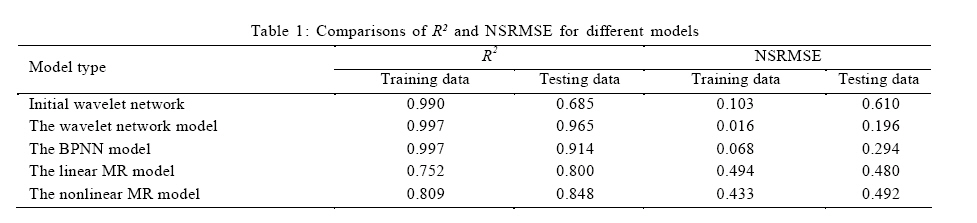
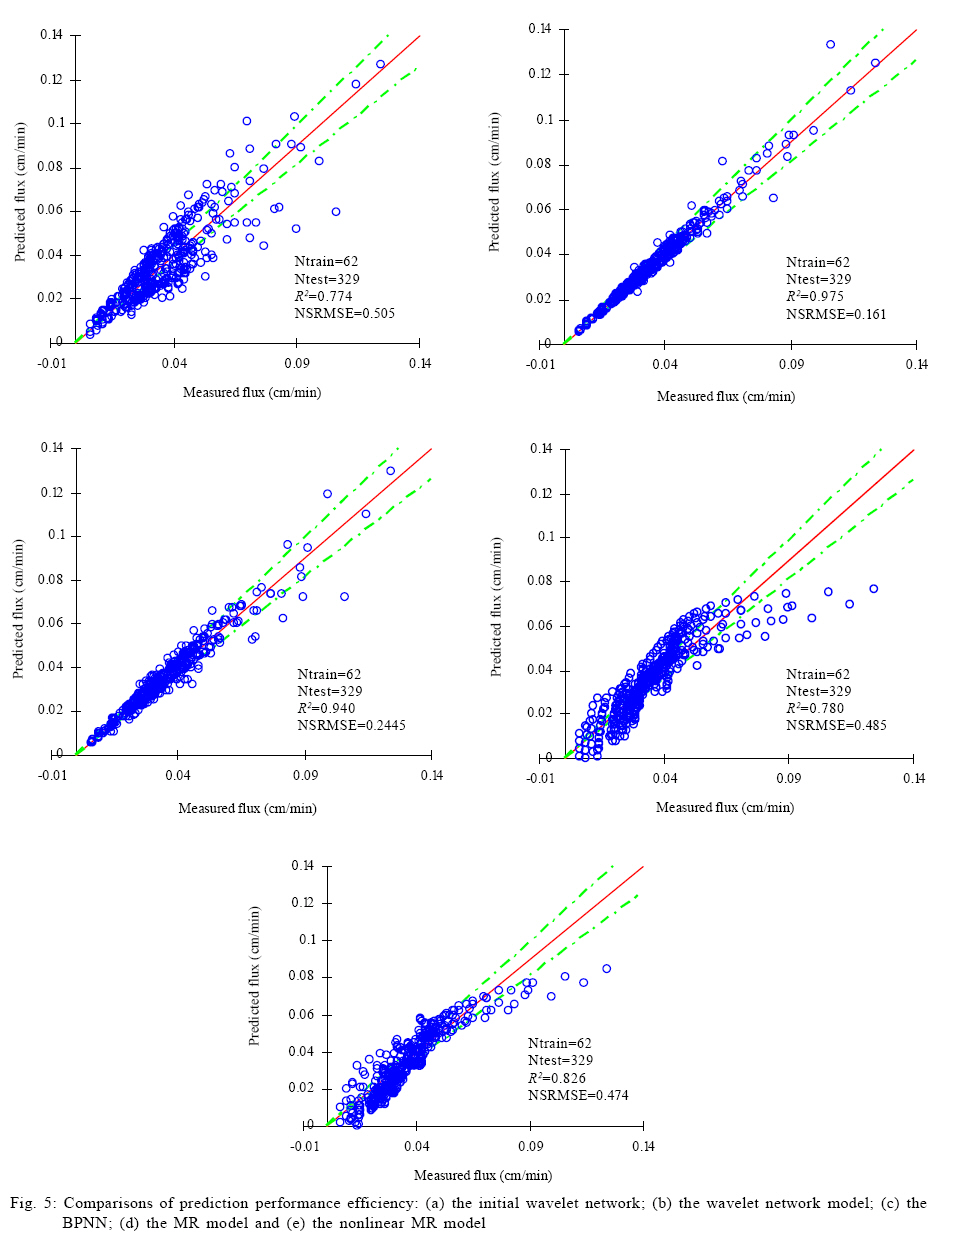
In addition, the NSRMSE was used as the stopping criteria for training ANN, and it was also a performance index of model prediction in this paper. RESULTS AND DISCUSSION The wavelet network model By examining each training input xk consisting of I, ξ, ΔP and t, the family of 152 candidate wavelets was achieved and each of the wavelets had a support covering at least one training input. By comparison, the number of candidate wavelets would be: (24)0+ (24)1+ (24)2+ (24)3+ (24)4 = 69905 If the candidate wavelets were attained by the technique of uniform partition of input space that was described in Cheng et al. (2008). Note that the exponent 4 of 24 in the parenthesis is the dimension of input xk. Clearly, the number of 69905 wavelets would be a dimension curse. Therefore, even if generating the 69905 wavelets was not tedious, the big number would certainly cause higher cost of computation in the following selection of network neurons. However, with the number of 152 candidate wavelets in this paper, the proposed method was not very sensitive to the input dimension of training data. In fact, such insensitivity resulted from the compact support of wavelets and the sparseness of training data, both of which were useful to avoid the superfluous wavelets to be included in the candidate family. Fig. 2 shows the varying GCV with respect to the number of selected wavelons according to the OLS algorithm. The GCV criterion was applied to the number of the selected wavelets, which was a model order determination problem. This criterion of minimum GCV avoided the danger of overfitting the training data. The minimum GCV was attained at the number 12, i.e., the combination of the chosen 12 wavelets were used to constitute the initial wavelet network with a relative optimal approximation. Because it would be very tedious to tell the optimal combination of a certain number of wavelets from all the subsets of the same size of the candidate family, the chosen 12 wavelets was determined by stepwise selection method. This method fisrt selected one wavelet which was optimal for fitting the traning data, then the second one such that it was optimal while cooperating with the first selected one, then the third one which was similarly selected and so on. In this way, the stepwise selection by the OLS algorithm successfully made a trade-off between the optimality and the efficiency. The obtained initial network fitted the training data with an NSRMSE of 0.103. Such smaller NSRMSE agrees with Zhang (1992) who reported that the OLS strategy could offer satisfactory accuracy. Consequently, the OLS strategy and the GCV criterion could lead to an efficient constructing procedure and a better initialization for the wavelet network. With the initial wavelet network, the common backpropagation was used as the traning method. During the traning procedure, NSRMSE drastically dropped during the first 30 epochs (shown in Fig. 3). Clearly, the training process converged so fast even in an ordinary back-propagation training method. The fast convergence verified again the better initialization of the wavelet network approach. Effect of I, ξ and Δ P on permeate flux Fig. 4 shows the measurements and the predictions of the wavelet network model for permeate flux during cross-flow ultrafiltration of silica coloids at five pressures for each of five combinations of pH and I. The wavelet network model excellently offered predictions (solid symbols) for both training (cross symbols) and testing (hollow symbols) data. Moreover, the nonlinearity of the flux-time profiles was well reproduced by the wavelet network. As shown in Fig. 4, the predictions, as well as the measurements accurately described permeate flux behavior greatly changing with the variations of ΔP, pH, and I. For each combination of pH and I, the permeate flux was proportional to ΔP and the ultimate flux at higher transmembrane pressure was higher. These phenomena are due to the greater driving force for permeate flux by higher ΔP (Faibish et al., 1998). Meanwhile, higher ΔP led to the steeper flux decline at the earlier stage of the filtration. This trend is attributed to the higher convective mass of colloids toward the membrane surface and a more densely packed cake layer at higher pressure (Faibish et al., 1998). On the other hand, for each combination of pH and I, the lowest ΔP was observed with the least flux decline for both experimental data and predictions. This observation is an index of operation approaching the critical flux below which colloids do not deposit on the membrane surface (Faibish et al., 1998). The predictions also accurately described the positive effect of ξ on permeate flux as shown in the triple of Fig. 4 a to c and, the triple of Fig. 4 b, d and e. In the former triple, an increasing flux followed a decreasing I with the same pH and, in the latter, the enhancement in permeate flux was preceded by an increasing pH with the same I. In fact, both of the above operations led to an increasing ξ (not considering the sign) of colloids (Bowen et al., 1996). The enhancements in permeate flux by ξ in Fig. 4 a to c and Fig. 4 b, d and e, are in qualitative agreement with the published reports by Huisman et al. (1997) and McDonogh et al. (1989). These authors explained the effect of ξ qualitatively by reasoning that high zeta potentials increase interparticle repulsion, thus causing less deposition (thinner cake layers) and more permeable cake layers. Consequently, the thinner and more permeable cake layers lead to an enhancement of permeate flux. Such an enhancement became more significant in this paper because of the colloidal particles with a smaller mean diameter 65 nm. Faibish et al. (1998) have reported that for particles with diameters smaller than about 100 nm, the effect of interaction repulsion on permeate flux becomes dominant. Among all the predictions and experiments, the combination of pH=9, I=0.030M and ξ=-80.5mV in Fig. 4 e led to the highest permeate flux for each ΔP in earlier stage. Besides, the effect of the highest ξ, lower I also enhanced the permeate flux for the case in Fig. 4 e, which is in accordance with the report by Elzo et al. (1998) who stated that lower I corresponds to larger distances between particles and such distance results in more permeable cake layers. The predictions in Fig. 4 e agree well with the theoretical explanation. Performance comparison This section describes the superiority of the wavelet network over BPNN under the same modeling conditions. The BPNN model used the tanh function as hidden neurons. Moreover, a comparison with the conventional MR method was used to show the better initialization of the wavelet network. Two MR models were built with the identical training data. One is a linear regression equation with the following form: J = 2.488×10⁻² 2.401×10⁻¹{I} 2.230×10⁻⁴{ξ} + 1.376×10⁻⁴{ΔP} 8.353×10⁻⁴{t}. Another is a nonlinear multiple equation with the following form: J = 2.956×10⁻² 2.312×10⁻¹{I} 2.235×10⁻⁴{ξ} + 1.467×10⁻⁴{ΔP} 2.747×10⁻⁴{ t} + 6.288×10⁻⁵{t2}. Coefficients of both equations were proven significant by the t-statistic. Several other multiple polynomial regression models were also tested, but their coefficients showed worse significance by the t-test. Table 1 shows the coefficients of multiple determination R2 and the NSRMSE for permeate flux obtained with the initial wavelet network, the wavelet network model, the BPNN model, the linear MR model and the nonlinear MR model. The wavelet network model not only provided better results in fitting, but also the best ones in prediction, with a R2 of 0.997 for the training data and 0.965 for the testing data. The BPNN model provided results much better than the MR models. The nonlinear MR model shows slightly improved in the basis of the linear MR model, but its prediction ability is not comparable to the BPNN and wavelet networks. This supposes that the existing high non-linearity of membrane filtration is a challenge for the MR method. In particular, it can be stated that the NSRMSE obtained by the wavelet network model is much smaller than that obtained with the other three methods. The superiority of the wavelet network model in fitting and prediction resulted from its better initialization, because the initial wavelet network has already provided better results with a R2 of 0.990 and an NSRMSE of 0.103 for the training data. Moreover, the number of wavelons of the initial wavelet network, which was evaluated by GCV criterion, led to good generalization performance of the wavelet network model with an NSRMSE of 0.196 for the testing data. Fig. 5 a-e shows the predicted versus measured flux for the initial wavelet network, the wavelet network model, the BPNN model and the MR models. Most of data shown in Fig. 5 b fall within the lines with ±10 % relative error. Only 12 out of 329 predicted testing data lie outside the region enclosed by the dotted lines, indicating that 96.4 % of the data are within the ± 10 % relative error range. In Fig. 5 c, 81 out of 329 predicted testing data is not confined within the two dotted lines. In Fig. 5 d, only 40 % of the data lie within the ±10 % relative error range, which is mainly because the complex nonlinear membrane filtration process could not be presented by a simple linear method. Moreover, the simple linear description led to 9 negative results. Although the nonlinear MR model was slightly better than the linear MR model, it provided 13 negative predictions, which suggest that the MR method could not rationally depict the membrane filtration. CONCLUSION The present study shows that a wavelet network approach could be used to predict permeate flux decline of cross-flow ultrafiltration of colloidal suspensions as a function of operating conditions. The wavelet network approach provided the benefit of efficient constructing procedures by fully ultilizing the sparseness of training data and the compact support property of wavelets. In particular, in case of multiple input dimensions (4 dimensions in this paper), this approach could avoid the curse of dimensionality for the choice of hidden neurons. Moreover, a better initialization with an NSRMSE of 0.103 by the OLS algorithm and GCV selection criterion led to fast convergence within 30 epochs during training procedure. The wavelet network model excellently described the nonlinear variation of permeate flux under different operating conditions. The predictions described the positive effect of ΔP on permeate flux and moreover, an increasing ξ was followed by an enhancement in permeate flux. Such an accurate prediction ability of wavelet networks could certainly be helpful to optimize practical operations of membrane filtration. Further, the wavelet network model offered such satisfactory accuracy that almost 96.4 % of predictions for the testing data deviated measured data within the ± 10 % relative error range. Meanwhile, the comparisons of the performances of the initial wavelet network, the wavelet network model, the BPNN model, the linear MR model and the nonlinear MR model confirmed the superiority of wavelet networks. As it is shown, efficient contruction, better initialization, faster convergence and higher accuracy, all of these has proved that the wavelet network is a promising alternative to traditional ANNs in modeling complex membrane filtration processes. As a modeling tool, wavelet networks could be used both observation of membrane system performance and evaluation of experimental conditions. In addition, this modeling technique could be applied as a simulation tool to improve the operating conditions of other water and wastewater treatment systems which involve highly nonlinear processes. ACKNOWLEDGEMENTS This study was financially supported by the Natural Foundation for Distinguished Young Scholars (NO. 50225926, NO. 50425927), the Chinese National Basic Research Program (program 973, No. 2005CB724203) and the National 863 High Technology Research Program of China (NO. 2004AA649370). REFERENCES
© IRSEN, CEERS, IAU The following images related to this document are available:Photo images[st09044f5.jpg] [st09044f1.jpg] [st09044f4.jpg] [st09044f3.jpg] [st09044t1.jpg] [st09044f2.jpg] |
| |||||||||

 is the center of variable interval,
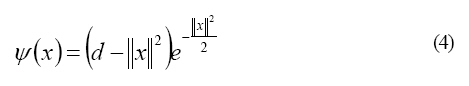
 which is the resulting wavelet
network;
which is the resulting wavelet
network;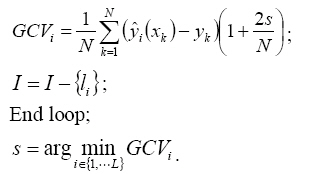