 |
| About Bioline | All Journals | Testimonials | Membership | News |
|
||||||
|
||||||
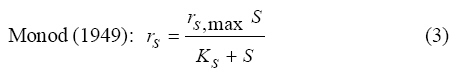
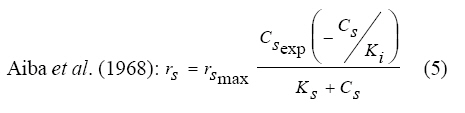
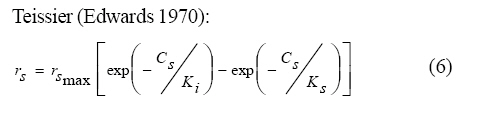
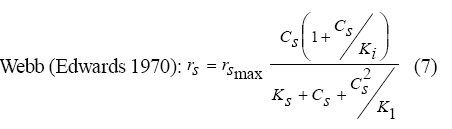
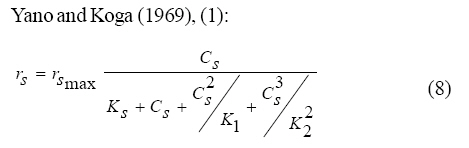
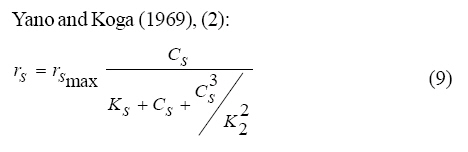
International Journal of Enviornmental Science and Technology, Vol. 6, No. 3, Summer, 2009, pp. 443-450 Substrate inhibition kinetics of phenol degradation by Pseudomonas fluorescence from steady state and wash-out data 1 *S. E. Agarry; 2 T. O. K. Audu; 3 B. O. Solomon 1 Biochemical Engineering Laboratory Unit, Department of Chemical Engineering, Ladoke Akintola University of Technology, Ogbomoso, Nigeria Received 10 August 2008; revised 29 January 2009; accepted 5 May 2009 Code Number: st09049 ABSTRACT The present study investigated the phenol utilization kinetics of a pure culture of an indigenous Pseudomonas fluorescence under steady state and non-steady state (washout) conditions. Steady states of a continuous culture with an inhibitory substrate was used to estimate kinetic parameters under substrate limitation (chemo stat operation) Pure cultures of an indigenous Pseudomonas fluorescence were grown in continuous culture on phenol as the sole source of carbon and energy at dilution rates of 0.010 0.20/h. Using different dilution rates, several steady states were investigated and the specific phenol consumption rates were calculated. In addition, phenol degradation was investigated by increasing the dilution rate above the critical dilution rate (washout cultivation). The results showed that the specific phenol consumption rate increased with increased dilution rate at steady state and phenol degradation by Pseudomonas fluorescence can be described by simple substrate inhibition kinetics under substrate limitation but cannot be described by simple substrate inhibition kinetics under washout cultivation. Fitting of the steady state data from continuous cultivation to various inhibition models resulted in the best fit for Haldane, Yano and Koga (2), Aiba and Teissier kinetic inhibition models. The rsmax value of 0.229 mg/mg/h obtained from the inhibition model equations was comparable to the experimentally calculated rsmax value of 0.246 mg/mg/h obtained under washout cultivation. Therefore, the biokinetic constants evaluated using these models showed good tolerance and growth of the indigenous organism. Keywords: Bioreactor; Continuous cultivation; Kinetic parameters; Primary culture; Secondary culture; Washout cultivation INTRODUCTION Phenol is a reasonably common wastewater contaminant (Li and Humphrey, 1989), which has been found to be either toxic or lethal to fish and most types of microorganisms at relatively low concentrations (Hill and Robinson, 1975). Studies on microbial means of treating or removing phenols dates back to at least three decades. Most studies have been on the degradation of much higher concentrations ranging from 1000 - 2000 mg/L (Bettman and Rehm, 1984; Schroeder et al., 1997; Sokol, 1988). Only few workers have presented works on phenol degradation of concentrations lower than 250 mg/L (Hill and Robinson, 1975; Lakhwala et al., 1992; Mordocco et al., 1999; Oboirien et al., 2005). Microbial degradation of phenol has been actively studied and these studies have shown that phenol can be aerobically degraded by wide variety of fungi and bacteria cultures such as Candida tropicalis (Chang et al., 1998; Ruiz-ordaz et al., 1998; 2001) Acinetobacter calcoaceticus (Paller et al., 1995) Alcaligenes eutrophus (Hughes et al., 1984; Leonard and Lindley, 1998) Pseudomonas putida (Hill and Robinson, 1975; Kotturi et al., 1991; Nikakhtari and Hill, 2006) and Burkholderia cepacia G4 (Folsom et al., 1990; Solomon et al., 1994). Phenol degradation can be achieved in batch, fed batch or continuous mode. In continuous culture, the influent phenol concentration and dilution rate controls cell number (Mordocco et al., 1999). Thus, to maintain a high cell number continuous cultures need to operate at high dilution rates when the influent concentration is low and at low dilution rates when the influent concentration is high. Nonetheless, in a free cell system the maximum dilution rate that can be achieved is limited by the need to prevent cell washout (Mordocco et al., 1999). Furthermore, a bioreactor used in a waste treatment should be operated in such a way that practically all the substrates introduced are oxidized (Sokol, 1988) or degraded. Any change in the operating parameters may cause either a transient increase in the substrate concentration in the bioreactor or washout of the cell from the bioreactor. In the latter, the cell concentration in the bioreactor will fall to zero, while the substrate concentration will increase until it reaches the concentration in the feed (Sokol, 1988). For a continuous culture (chemostat operation) and a single inhibitory substrate, the material balance on substrate is given by the equation: ds/dt = D (So S) - rs X (1) For steady state ds/dt = 0, hence D (So S) = rs X (2) Where, D, S, So, X and rs are dilution rate, final substrate concentration, initial substrate concentration, biomass concentration and specific substrate consumption rate, respectively. It has been reported that for a given dilution rate three steady states can be obtained when an inhibitory substrate is utilized in a continuous culture reactor (Schroder et al., 1997; Yano and Koga, 1969). The first one is a high conversion stable steady state, the second is an unstable steady state and the third is a trivial washout state (Pawlosky et al., 1973). At low dilution rates, the bioreactor is relatively stable to fluctuating loads while at high dilution rates close to the maximum, stable and unstable steady states are close together and small perturbations of the substrate feed concentrations can lead to washout of the cells (Schroder et al., 1997). Therefore, knowledge of the microbial inhibition kinetics is important and can lead to a more effective and safer bioreactor operation. A variety of kinetic substrate utilization and inhibition models have been used to describe the dynamics of microbial growth on phenol as given in Eqs. (3 to 9):
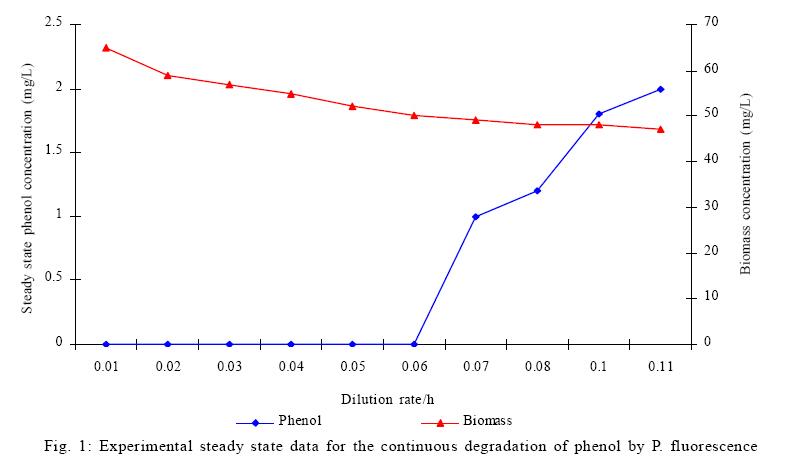
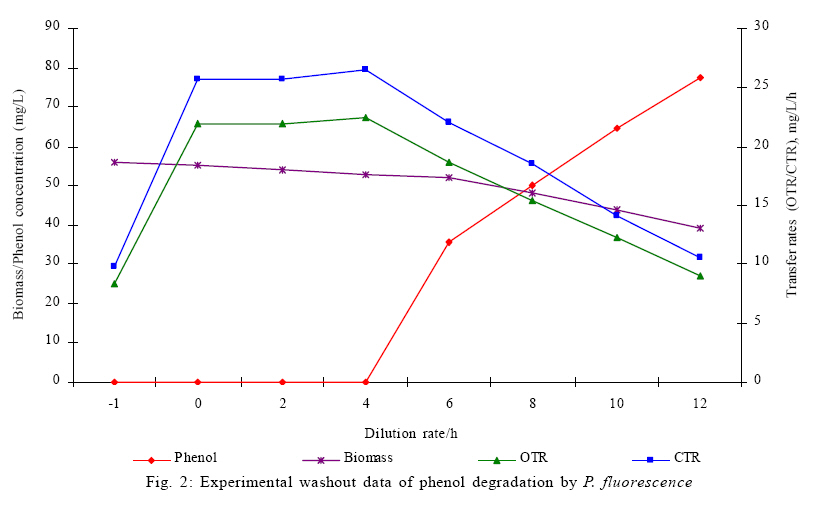
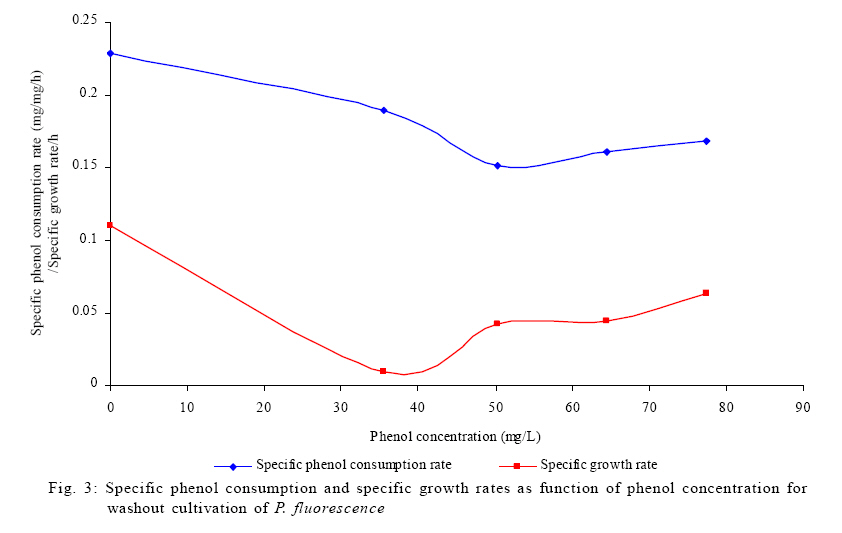
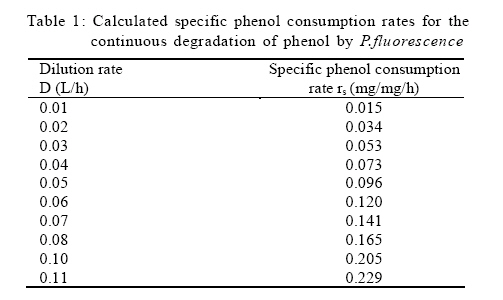
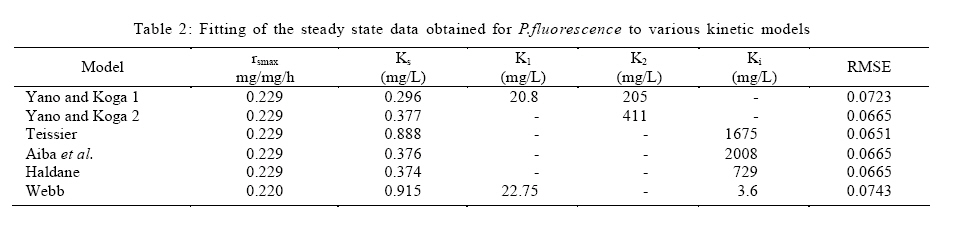
Where, Ks, Ki, rs, rs max S, Cs are half-saturation constant (mg/L), inhibition constant (mg/L), specific phenol (substrate) consumption rate (mg/mg/h), maximum specific phenol (substrate) consumption rate (mg/mg/h) and substrate concentration (mg/L), respectively. Of these various models, the Monod and Andrew (Haldane) equations have been extensively used to describe phenol biodegradation (Bandyopadhyay et al., 1998; Oboirien et al., 2005; Reardon et al., 2000). The Monod and Andrew (Haldane) equations are based on the specific growth rate (Bandyopadhyay et al., 1998; Reardon et al., 2000), but may also be related to the specific substrate consumption rate (Edwards, 1970, Solomon et al., 1994). Other kinetic models have been propagated. Sokol (1988) has reported a better fit for a modified Monod-Haldane equation while Schroeder et al. (1997) have shown a better fit for Yano and Koga equation in their study of inhibition kinetics of phenol degradation from unstable steady state data amongst the tested inhibition models. However, it is reported that kinetic parameters estimated from non-steady state like washout experiments are often widely different from that for steady state conditions (Boyer and Humphrey, 1988; Li and Humphrey, 1989; Schroder et al., 1997) and that the Haldane model (Andrews, 1968) which is most frequently used to describe substrate inhibition kinetics tends to over predicts steady state concentration sometimes more than an order of magnitude (Allsop et al., 1993; Schroder et al., 1997). In spite of the rather extensive use of phenol biodegradation processes, surprisingly, little work has been published on phenol microbial degradation kinetics based on specific substrate consumption rate using pure or mixed cultural systems. The present study investigated the phenol utilization kinetics of a pure culture of an indigenous Pseudomonas fluorescence under steady state and non-steady state (washout) conditions using an influent phenol concentration of 100 mg/L a level lower than what has been earlier investigated. The research was conducted at Ile-Ife in October 2008. MATERIALS AND METHODS Microorganism The microorganism, P. fluorescence being an indigenous bacteria strain isolated from an oil-polluted area in Niger-Delta region of Nigeria was procured from the Department of Microbiology, Obafemi Awolowo University, Ile-Ife, Nigeria. The microorganism was maintained on nutrient agar slant and stored at 4 ºC ± 1 ºC for further use. Culture medium and inoculum preparation The mineral salt medium used was modified from the one suggested by Bettman and Rehm (1984). The medium had the following composition per L: 700 mL deionized water, 100 mL buffer solution A, 100 mL trace elements solution B, 50 mL solution C and 50 mL solution D. Compositions of each solution were as follows: Buffer solution A composition K2 HPO4 1.0 g , KH2PO4 0.5 g , (NH4)2SO4 0.5 g , deionized water 100 mL. Trace element solution B composition NaCl 0.5 g , CaCl2 0.02 g , MnSO4 0.02 g , CuSO4.5H2O 0.02 g , H3 BO3 0.01 g , deionized water 50 mL. Solution C composition MgSO4.7H2O 0.5 g , deionized water 50 mL , solution D composition FeSO4 0.02 g , Molybdenum powder 0.02 g , deionized water 50 mL. To prevent the precipitation of CaSO4 and MgSO4 in storage, the water, buffer solution A, trace elements solution B, solution C and solution D were autoclaved at 121 ºC for 15 min. After cooling, all the solutions were then mixed together and kept as stock solution from which known quantities were taken for the cultivation of the microorganisms A primary culture was prepared by transferring two loops full of microorganisms from an agar slant culture into 100 mL of feed medium containing 20 mL of mineral salt medium and 80 mL of 50 mg phenol solution in a 250 mL erlenmeyer conical flask. This was then incubated in a new Brunswick gyratory shaker (G25-R model, N.J. U.S.A) for 48 h at a temperature of 30 oC and agitated with a speed of 120 rpm. Thereafter, 10 mL of the primary culture was transferred into another 100 mL of feed medium in a 250 mL erlenmeyer conical flask and the incubation process was repeated. This was the secondary culture that was used as the inoculum for the degradation studies as this ensures that the organisms had fully adapted to growth on the phenol as sole source of carbon and energy. Experimental design to study the free suspended cell system The continuous cultures were cultivated in a 7.5 L new Brunswick microferm twin bioreactor (PH - 22 model, N. J., U.S.A). The reactor was equipped with a console for regulation of temperature, pH, aeration and agitation. The working volume of the bioreactor was 4 L. All cultivations were carried out at 30 ºC. The pH was maintained at 7.0 by addition of 1.0 mol/L sodium hydroxide solution and 0.5 mol/L sulphuric acid solution. Aeration was done with compressed air at a flow of 180 L/h (STP) and the stirrer speed was set at 300 rpm. A 501U peristaltic pump (Watson Marlow, Falmouth, United Kingdom) was used to supply the phenol feed medium to the reactor while a second peristaltic pump of the same kind operated at a higher flow was used to withdraw culture broth by a constant level overflow to maintain a constant culture volume. Mass flow of the phenol feed medium was controlled by balances. The exhaust gas from the bioreactor was analyzed for oxygen and carbon dioxide content using the paramagnetic properties of oxygen for O2 and infra red (IR) absorption for CO2 measurement, respectively. To start the continuous runs, a batch culture was initiated by addition of 200 mL of the inoculum to the bioreactor containing 3.8 L of medium with a phenol concentration of 100 mg/L. After the exponential growth had ended, continuous pumping of feed medium was started and smoothly increased for several hours until the required dilution rate was reached. Measurements were started when the steady state had been established. Different dilution rates ranging between 0.010/h and 0.200/h were investigated. For each dilution rate, five hydrodynamic residence times were reached before the first sample was taken. After that, at least three different samples were taken and the average values were used. For the washout experiment, the dilution rate was increased above the critical dilution rate. Estimation of phenol concentration. The undegraded phenol was estimated quantitatively by the spectrophotometric method using 4 amino antipyrene as colour indicator (Yang and Humphrey, 1975) at an absorbance of 510 nm. Estimation of biomass concentration The biomass concentration was estimated using the dry weight method. A 50 mL sample of culture broth was withdrawn from the bioreactor and centrifuged (Gallenkamp centrifuge) at 4000 rpm for 20 min in plastic centrifuge tubes. The supernatant was decanted into small bottles and stored at 4 ºC for subsequent phenol estimation. The pellets was re-suspended in de-ionized water and re-centrifuged. The supernatant was decanted and pellets rinsed off from the tube into a pre-weighed 1.2 ìm pore filter paper (Whatman GF/C). The filter paper was then dried in an oven at 105 ºC for between 12-24 h, cooled in a dessicator at room temperature and re-weighed until a constant dry weight was obtained. The difference between the pre-weighed filter paper and the constant weight was used to estimate the dry weight of the biomass. RESULTS AND DISCUSSION Steady states were obtained for dilution rates of up to 0.11/h. At dilution rates of 0.12/h, and above wash out of the cells was observed. Fig. 1 shows the relationship between biomass concentration and steady effluent phenol concentration with dilution rate for P. fluorescence. It could be seen from the figure that biomass concentration decreased with increasing dilution rate while phenol was completely degraded (consumed) except at high dilution rate. This behaviour may probably have been due to undetected localized wall growths, which have been predicted by Howell et al. as reported by Hill and Robinson (1975) that wall growth tends to increase the net conversion rate of phenol in a biological reactor. It has been shown by mass balances that phenol degradation by pure culture of Pseudomonas cepacia G4 is complete at dilution rates of up to the critical one (Schroeder et al., 1997). The decrease in biomass concentration as observed is in agreement with the observation of Hill and Robinson (1975) who reported the observation of wall growth that resulted in the decrease of biomass concentration and phenol removal at steady state as dilution rate increased. Anselmo and Novais (1992) and Schroeder et al. (1997) both observed an increase in biomass concentration and a complete degradation of phenol at low dilution rate and a decrease in both biomass and phenol removal at high dilution rates. It could also be observed that the biomass concentration was relatively stable (no significant decline) at the higher dilution rate. To estimate the maximum specific growth rate and the maximum specific phenol (substrate) consumption rate for phenol a wash out experiment was carried out. The wash out experiment was started out of a steady state with a dilution rate of 0.04/h with corresponding phenol feed concentration of 100 mg/L. The dilution rate was increased to 0.14/h and the corresponding phenol feed concentration was 96.1mg/L after the dilution rate step. Fig. 2 shows the biomass, phenol concentration, carbon dioxide transfer rate (CTR) and the oxygen transfer rate (OTR) as a function of time after the D-step (t=0) for P. fluorescence. From the figure, it could be seen that immediately after the D-step (step change) the oxygen transfer rate (OTR) and carbon dioxide transfer rate increased to higher values and remained nearly constant for about 4 h. After about 6 h, there was a sharp decrease of OTR and CTR with corresponding accumulation of phenol and a more rapid decrease of biomass concentration. This indicates an increased, constant and decreased metabolic activity for this time span. During the increased and constant period of OTR and CTR there was no phenol accumulation but the biomass concentration was decreasing. However, during the decreased period of OTR and CTR there was increasing phenol accumulation and decreasing biomass concentration and the specific rates that were obtained during this period has been shown to also decreased, but later, increased again as revealed in Fig. 3 which shows the plot of specific phenol consumption and specific growth rates as a function of phenol concentration. The decreased in the specific rates was as a result of an increasing inhibitory effect, while, the increase cannot be explained by simple substrate inhibition kinetics. This behaviour indicates an adaptation of the organisms to higher phenol concentrations whose effect is contradictory to the increasing substrate inhibition. It is most likely that the organisms increased their enzyme level or concentration. In general, it probably seems that the monoculture of P. fluorescence can grow at a dilution rate of 0.14/h, for some time. During this time, the biomass and the transfer rates decrease slightly while phenol does not accumulate. Eventually, inhibition or other metabolic changes takes over and acts like a switch reducing metabolic activity considerably. The decrease of biomass concentration in combination with no phenol accumulation in the first 4 h probably reveals that the maximum flow through anabolism and catabolism is different and phenol begins to accumulate when the maximum specific substrate consumption rate was reached due to the decreasing biomass concentration. However, the maximum specific growth rate (mmax) was calculated from the wash out cultivation experimental data in which ln X /Xo was plotted against time, (t) and a straight line obtained (not shown). The slope of this line gives the maximum specific growth rates as obtained by: ln (X/Xo ) = (μmax D)t (10) Where, µmax, Xo, X and t are maximum specific growth rate, initial biomass concentration, final biomass concentration and time, respectively. The maximum specific growth rate was calculated to be 0.113/h and the corresponding maximum specific phenol consumption rate to be 0.246 mg/mg/h. The μmax value is considerably lower than those determined for P. cepacia G4 (mmax = 0.30/h) by Schroeder et al. (1997) from unstable steady state; P. putida ATCC17514 (mmax = 0.567/h) by Yang and Humphrey (1975) and P. aeruginosa (µmax = 0.152/h) by Agarry and Solomon (2008) from continuous cultivation. On the other hand, the value is comparable with the values obtained for P. putida F1 (mmax = 0.11/h) by Reardon et al. (2000) and P. putida Q5 (mmax = 0.119/h) by Kotturi et al. (1991) using batch cultivation. According to Layokun et al. (1987) and Solomon et al. (1994) growth of organism is a consequence of substrate consumption; hence the specific substrate (phenol) consumption rate (rs) was calculated (as shown in Table 1) from the steady state data obtained for P.fluorescence. From the Table, it could be seen that the specific phenol consumption rate increased with increased dilution rate at steady state. Six inhibition kinetic models of Haldane (Andrew 1968), Yano and Koga (1) (1969), Yano and Koga (2) (1969), Aiba et al. (1968) Teissier (Edwards, 1970) and Webb (Edwards, 1970) were fitted to experimental steady state data. The model with the best fit was selected on the basis of the least root mean square error (RMSE The non-linear least squares fitting routine of MATLAB 6.5 software package was used to estimate the kinetic parameters and the results are presented in Table 2. From the Table, it could be seen that all the tested models reasonably fit the data. Nonetheless, because the RMSE value for Haldane, Yano and Koga (2) and Aiba et al. is lower and the same and the difference between this value and that for Teissier model is very small and statistically insignificant (p < 0.05); thus, the best data approximation (best fit) was achieved using Haldane, Yano and Koga 2, Aiba et al. (1968) and Teissier models, respectively. A similar observation was reported by Pawlowsky and Howell (1973). They observed statistically insignificant difference between five inhibition models in their study of mixed culture biooxidation of phenol. Therefore, the models of Haldane, Yano and Koga 2, Aiba et al. (1968) and Teissier, may be proposed as the kinetic models to describe the continuous phenol degradation behaviour of P. fluorescence. CONCLUSION It may be concluded that P. fluorescence exhibits a considerable tendency for wall growth in continuous culture particularly at high dilution rate. The biokinetic constants evaluated using the models showed good tolerance and growth of the indigenous organism. The experimentally calculated rsmax value from washout experiment was found to be 0.246 mg/mg/h and this was comparable to the rsmax value (0.229 mg/mg/h) obtained for the inhibition models. REFERENCES
© IRSEN, CEERS, IAU The following images related to this document are available:Photo images[st09049t1.jpg] [st09049f1.jpg] [st09049f2.jpg] [st09049f3.jpg] [st09049t2.jpg] |
| |||||||||

