 |
| About Bioline | All Journals | Testimonials | Membership | News |
|
||||||
|
||||||
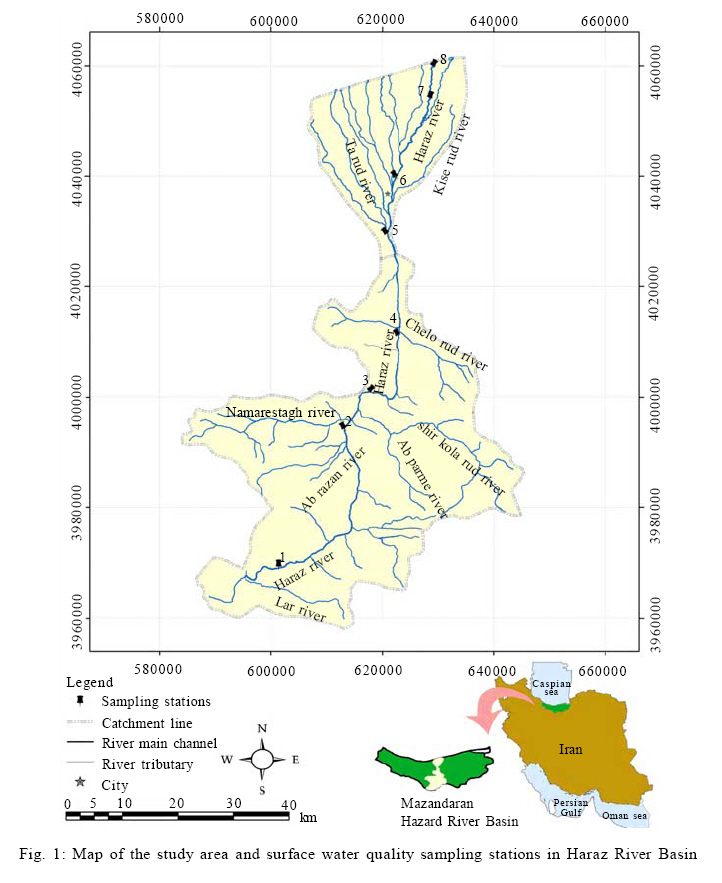
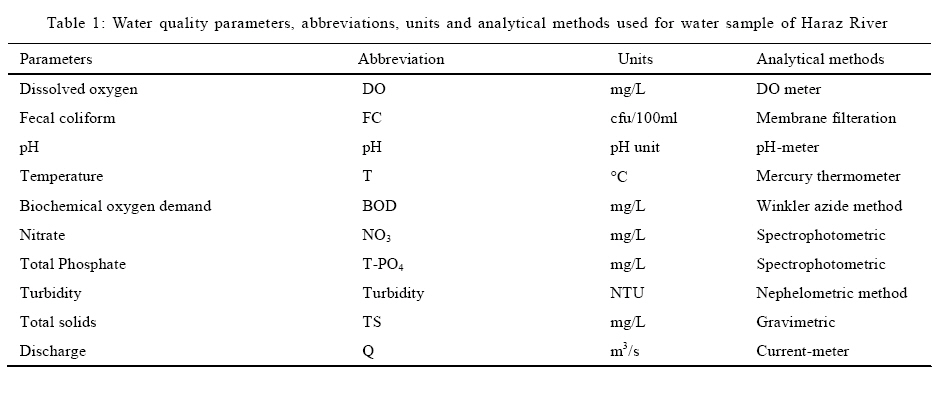
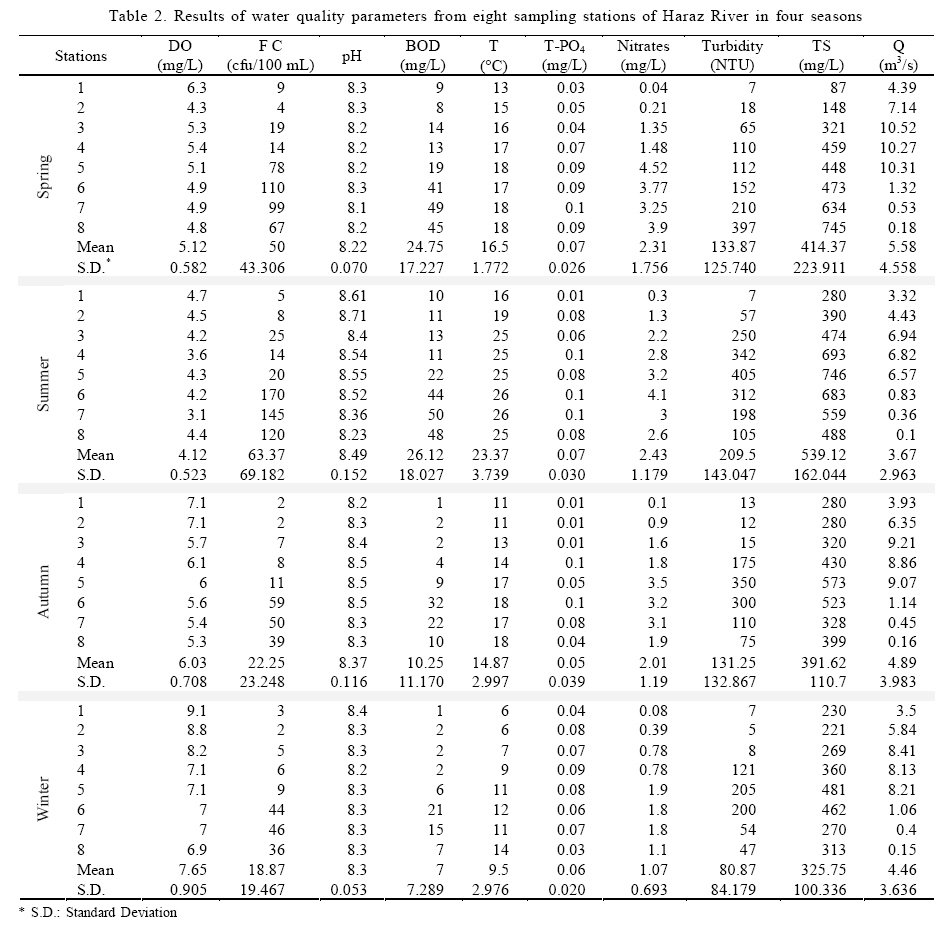
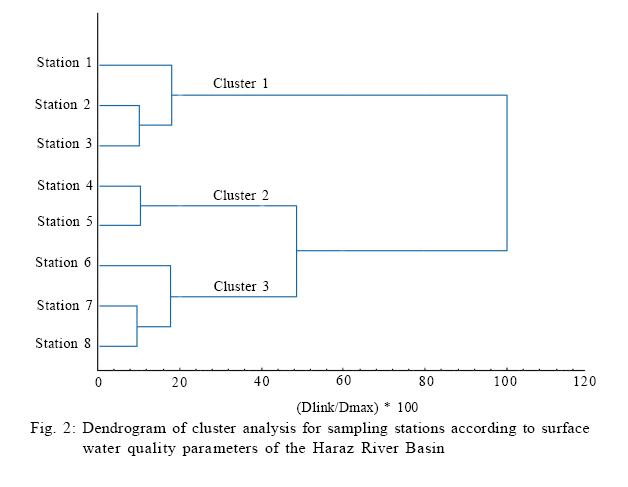
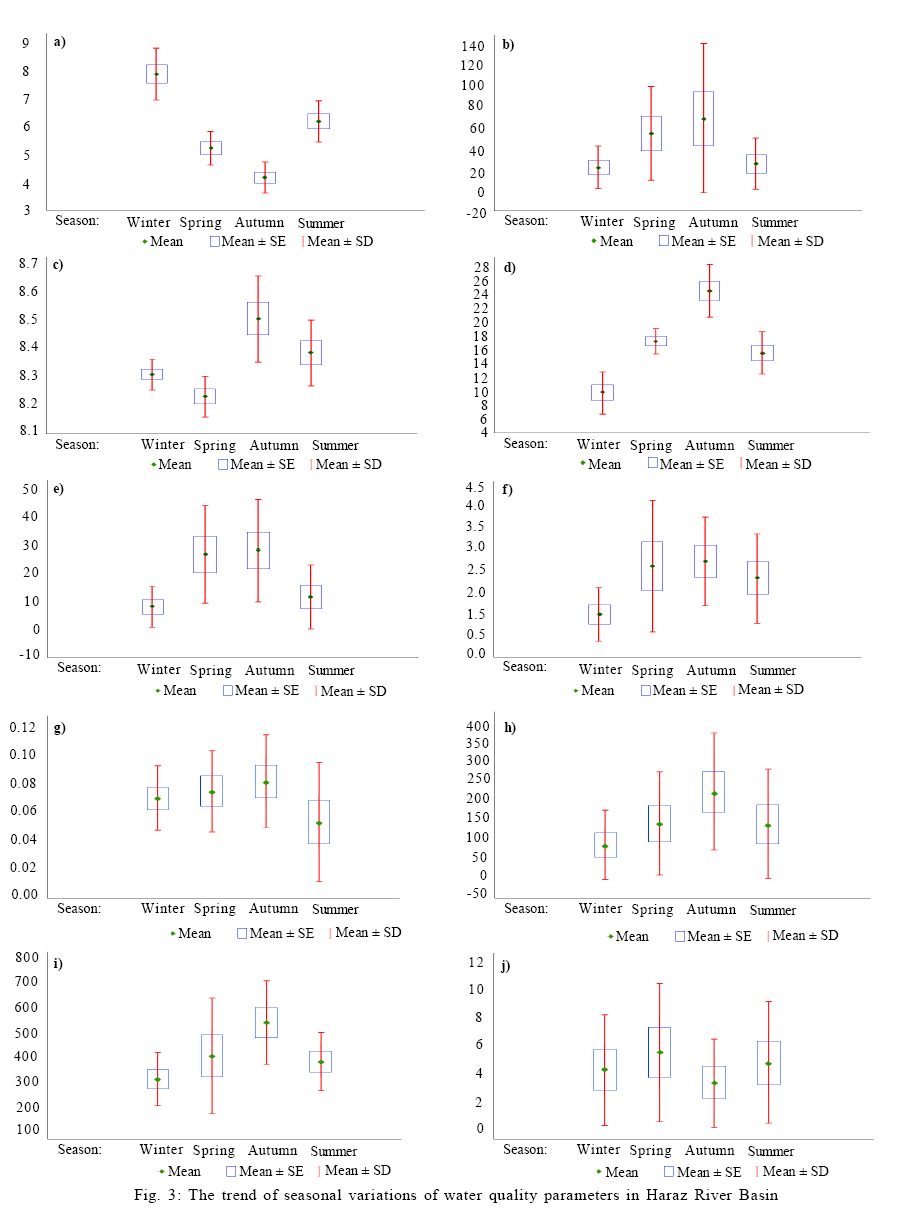
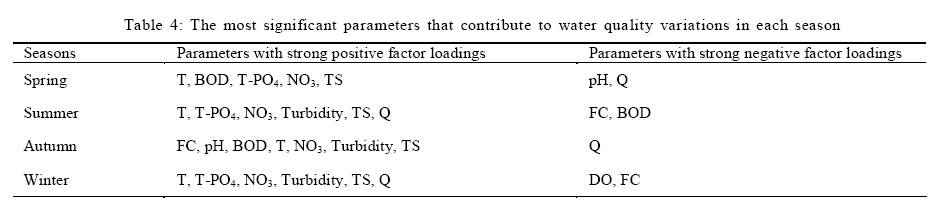
International Journal of Enviornmental Science and Technology, Vol. 6, No. 3, Summer, 2009, pp. 467-476 Evaluation of spatial and seasonal variations in surface water quality using multivariate statistical techniques *A. H. Pejman; G. R. Nabi Bidhendi; A. R. Karbassi; N. Mehrdadi; M. Esmaeili Bidhendi Graduate Faculty of Environment, University of Tehran, P. O. Box 14155-6135, Tehran, Iran Received 28 March 2009; revised 20 April 2009; accepted 20 May 2009 Code Number: st09052 ABSTRACT In this study, spatial and seasonal variations of water quality in Haraz River Basin were evaluated using multivariate statistical techniques, such as cluster analysis, principal component analysis and factor analysis. Water quality data collected from 8 sampling stations in river during 4 seasons (Summer and Autumn of 2007, Winter and Spring of 2008) were analyzed for 10 parameters (dissolved oxygen, Fecal Coliform, pH, water temperature, biochemical oxygen demand, nitrate, total phosphate, turbidity, total solid and discharge). Cluster analysis grouped eight sampling stations into three clusters of similar water quality features and thereupon the whole river basin may be categorized into three zones, i.e. low, moderate and high pollution. The principle component analysis/factor analysis assisted to extract and recognize the factors or origins responsible for water quality variations in four seasons of the year. The natural parameters (temperature and discharge), the inorganic parameter (total solid) and the organic nutrients (nitrate) were the most significant parameters contributing to water quality variations for all seasons. Result of principal component analysis and factor analysis evinced that, a parameter that can be significant in contribution to water quality variations in river for one season, may less or not be significant for another one. Keywords: Cluster analysis; Factor analysis; Principal component analysis; River; Water pollution INTRODUCTION Water quality performs important role in health of human, animals and plants. The quality of surface water within a region is governed by both natural processes (such as precipitation rate, weathering processes and soil erosion) and anthropogenic effects (such as urban, industrial and agricultural activities and the human exploitation of water resources) (Jarvie et al., 1998; Liao et al., 2007; Mahavi et al., 2005; Nouri et al., 2008). A variety of methods are being used to display the information which is concealed in the quality variables observed in a water quality monitoring network (Mazlum et al., 1999). The quality of a river at any point reflects several major influences, including the lithology of the basin, atmospheric inputs, climatic conditions and anthropogenic inputs (Bricker and Jones, 1995; Shrestha and Kazama, 2007). The anthropogenic discharges constitute a constant polluting source, whereas surface runoff is a seasonal phenomenon, largely affected by climate within the basin (Karbassi et al., 2007; Najafpour et al., 2008; Singh et al., 2004). Seasonal variations in precipitation, surface run-off, ground water flow, interception and abstraction strongly affect river discharge and, consequently the concentrations of pollutants in river water (Khadka and Khanal, 2008; Mtethiwa et al., 2008; Vega et al., 1998). Human activities are a major factor determining the quality of the surface and ground water through atmospheric pollution, effluent discharges, use of agricultural chemicals, eroded soils and land use (Niemi et al., 1990). These land use changes increase the amount of impervious surface resulting in storm runoff events that negatively affect stream ecosystems and water quality (Paul et al., 2001). Rivers in watersheds with substantial agricultural and urban land use experience increased inputs and varying compositions of organic matter (Sickman et al., 2007) and excessive concentrations of phosphorus and other nutrients from fertilizer application and watershed releases (Easton et al., 2007). Natural and synthetic estrogens, other pharmaceuticals and disease-causing bacteria are entering streams through the release of wastewater from sewage treatment plants and effluent from septic systems (Gross et al., 2004; Kinzelman et al., 2003; Williams et al., 2003). Therefore, the effective, long-term management of rivers requires a fundamental understanding of hydro-morphological, chemical and biological characteristics (Shrestha and Kazama, 2007). However, due to spatial and temporal variations in water quality (which are often difficult to interpret), a monitoring program, providing a representative and reliable estimation of the quality of surface waters is necessary (Dixon and Chiswell, 1996). The application of different multivariate statistical techniques, such as cluster analysis (CA), principal component analysis (PCA) and factor analysis (FA) helps in the interpretation of complex data matrices to better understand the water quality and ecological status of the studied systems, allows the identification of possible factors sources that influence water systems and offers a valuable tool for reliable management of water resources, as well as rapid solution to pollution problems (Lee et al., 2001; Reghunath et al., 2002; Vega et al., 1998; Wunderlin et al., 2001). Also in recent years, the PCA and FA methods have been exerted for a variety of environmental applications, containing evaluation of ground water monitoring wells and hydrographs, examination of spatial and temporal patterns of surface water quality, identification of chemical species related to hydrological conditions and assessment of environmental quality indicators (Bengraine and Marhaba, 2003; Ouyang, 2005; Ouyang et al., 2006; Perkins and Underwood, 2000; Voutsa et al., 2001). Multivariate statistical techniques has been applied to characterize and evaluate surface and freshwater quality and it is useful in verifying temporal and spatial variations caused by natural and anthropogenic factors linked to seasonality (Singh et al., 2004; 2005). For instance, multivariate statistical methods, such as CA and PCA were used by Zhang et al. (2009) to analyze the water quality dataset, including 13 parameters at 18 sites of the Daliao River Basin from 2003-2005 to obtain temporal and spatial variations and to identify potential pollution sources, also Kazi et al. (2009) using CA and PCA methods (with monitoring at five different sites for 36 parameters in Manchar Lake, generated during 2005-06) evaluated and interpreted complex water quality data sets and apportioned of pollution sources to get better information about water quality and to design a monitoring network. The aim of this study is to analyze the 10 parameters of water in 8 sampling stations of Haraz River for 4 seasons (Summer and Autumn of 2007, Winter and Spring of 2008). The obtained data set is subjected to the multivariate statistical methods (i.e. CA, PCA and FA) to evaluate information about similarities and dissimilarities between sampling stations, to recognize water quality variables for seasonal variations in river water quality and the affect of pollution sources on the water quality parameters of the Haraz River Basin. Materials and Methods Study area Haraz River Basin area is located in the Mazandaran Province and north region of Iran (Fig. 1). It lies between longitude of 35°52¢ and 45°' and latitude of 35°4'and 36°1', Haraz River has a length of 185 km with a discharge of 940 × 106 m3/y (in 2006). The width of river ranges from 50 to 500 m at different locations. The catchments area of river is about 4,060 Km2 with average precipitation of 832 mm/y (Karbassi et al., 2008). Haraz River originates from Alborz mountain ranges and flows into the southern coast of the Caspian Sea (Keramat Amirkolaie, 2008). The Haraz River is a major source for agriculture activities particularly in downstream basin areas. Sample collection Water samples were collected from the 8 stations for 4 seasons of Haraz River. Then, collected samples were kept in a 2 L polyethylene plastic bottles cleaned with metal free soap, rinsed many times with distilled water and finally soaked in 10 % nitric acid for 24 h, finally rinsed with ultrapure water. All water samples were stored in insulated cooler containing ice and delivered on the same day to laboratory and all samples were kept at 4 °C until processing and analysis (Clesceri et al., 1998; Kazi et al., 2009). Analytical methods In the present investigation, water samples were collected from 8 stations in four different seasons (summer and autumn of 2007; winter and spring of 2008). Sampling site selection criteria include natural conditions, as well as human activities. Station 1, represents natural condition where neither agricultural nor industrial activities can be found. Stations 2, 3, 4 and 5 are mostly affected by agricultural, as well as aqua culture and river sand mining activities. Stations 6, 7 and 8 are affected by almost all type of pollutant from residential, agricultural and to a lower extent industrial activities. The selected water quality parameters consist of dissolved oxygen (DO), fecal coliform (FC), pH, water temperature (T), 5-day biochemical oxygen demand (BOD), nitrate (NO3), total phosphate (T-PO4), turbidity, total solid (TS) and discharge (Q). The temperature, pH and DO concentrations of the water were measured on-site by a thermometer, pH and DO meter (using HACH sensION156 portable), respectively (APHA, 1998). The BOD5 was determined by the Winkler azide method and TS were determined gravimetrically at 105-110 °C (Kazi et al., 2009). NO3 and T-PO4 were analyzed by cadmium reduction and ascorbic acid method (using HACH DR2800 spectrophotometer), respectively. Turbidity was determinate by the nephelometric method (using HACH 2100AN turbidimeter) (APHA, 1998). Discharge was measured using current-meter measurements by wading (Shrestha and Kazama, 2007). The membrane filter technique was used to determine the number of colony forming units per 100 mL (cfu/100 mL) of fecal coliforms in sampling water (APHA, 1998). The water quality parameters, their units and methods of analysis are summarized in Table 1. The results of duplicate samples at stations 2 and 6 reveals precision as good as 97 % for all parameters. Statistical methods All mathematical and statistical calculations were implemented using STATISTICA 8 and Microsoft Office Excel 2007. Cluster analysis Cluster analysis is a group of multivariate techniques whose primary purpose is to assemble objects based on the characteristics they possess (Shrestha and Kazama, 2007). The Euclidean distance usually gives the similarity between two samples and a distance can be represented by the difference between analytical values from the samples (Otto, 1998). In this study, hierarchical agglomerative CA was performed on the normalized data set by means of the Ward's method, using squared Euclidean distances as a measure of similarity. The spatial variability of water quality in the whole river basin was determined from CA, using the linkage distance, reported as Dlink/Dmax, which represents the quotient between the linkage distances for a particular case divided by the maximal linkage distance. The quotient is then multiplied by 100 as a way to standardize the linkage distance (Simeonov et al., 2003; Wunderlin et al., 2001). Cluster analysis was used in the present investigation because a visual summary of intra-relationship amongst variations parameters can lead to a better understanding of governing factors. Principal component analysis/factor analysis PCA is designed to transmute the original variables into new, uncorrelated variables (axes), called the principal components, which are linear combinations of the original variables (Shrestha and Kazama, 2007). PCA provides information on the most meaningful parameters which describe the whole data set interpretation, data reduction and to summarize the statistical correlation among constituent in the water with minimum loss of original information (Helena et al., 2000). FA follows PCA which is a linear combination of observable water quality variables, whereas FA can include unobservable, hypothetical, latent variables (Helena et al., 2000; Vega et al., 1998). PCA of the normalized variables was executed to extract significant principal components (PCs) and to further reduce the contribution of variables with minor significance; these PCs were subjected to varimax rotation (raw) generating factors (Abdul-Wahab et al., 2005; Love et al., 2004; Shrestha and Kazama, 2007; Singh et al., 2004, 2005). The main applications of factor analytic techniques are 1) to lessen the number of variables and 2) to discover structure in the relationships between variables, that is to classify variables. Results and Discussion The measurement results of water quality parameters from 8 sampling stations in four seasons of Haraz River are represented in Table 2. Spatial similarity with CA Cluster analysis was applied to find out the similarity groups between the sampling stations. It resulted a dendogram (Fig. 2), grouping all the eight sampling stations into three statistically meaningful clusters at (Dlink/Dmax) _ 100 < 50. The three stations (1, 2 and 3) form cluster 1 which comprises relatively less polluted sites. Cluster 2 includes station 4 and 5 that these resemble to almost one another. Cluster 2 corresponds to moderately polluted sites. These stations receive pollution mostly from agricultural, river sand mining and fish farming activities. Three stations of river downstream (6, 7 and 8) form cluster 3 that these possess totally highly pollution. Discharge of domestic wastewater and untreated sewage of agricultural activities in this region, as well as establishment of dam after fifth station on river channel and sizable decrease of water flow rate, are principal reasons of pollution increase. It can also be inferred that self purification capability of Haraz River is weak. The results exhibit that the CA technique is useful in present accredited classification of surface waters in the whole river basin, hence, the number of sampling sites and respective cost in the future monitoring plans can be lessen. There are other reports (Kim et al., 2005; Shrestha and Kazama, 2007; Singh et al., 2004; 2005), with same results in water quality programs. Seasonal variations of water quality parameters Box and whisker plots represent seasonal trends in Fig.3. The average concentration of DO (Fig. 3a) is higher in winter and autumn as compared to summer and spring. In fact, seasonal variations is plenty effective in concentration of DO and this amount put into effect momentous role in water quality of rivers. The average temperature (Fig. 3d) is observed to be the highest in summer and the lowest in winter. The inverse relationship between temperature and dissolved oxygen is a natural process because warmer water becomes more easily saturated with oxygen and it can hold less dissolved oxygen (Shrestha and Kazama, 2007). The average pH (Fig. 3c) is higher in summer and the lowest in spring. The average fecal coliform (Fig. 3 b) is higher in summer and spring as compared to winter and autumn. In reality, in warm seasons increase of human in locations of around river and also crowd of animals surrounding the river can be main reason of domestic wastewater and thereupon fecal coliforms in these seasons. The average concentration of BOD (Fig. 3e) is higher in spring and summer in contrast with less amount in autumn and winter. In the case of nitrate (Fig. 3f) and total phosphate (Fig. 3g), average concentration is higher in warm seasons that may be justified by relatively more agricultural and fish farming activities in summer and spring. The variations in trend of turbidity and total solids (Figs. 3h and i) is approximately similar in different seasons and the average these parameters is higher in summer and spring as compared to autumn and winter. It is evident that discharge (Fig. 3j) variations are commensurate with weather conditions and seasons variations, though utilize rate of water sake uses diverse, as well is telling. The average discharge is higher in spring and autumn in contrast with winter and summer. Principal component analysis/factor analysis was executed on 10 variables for the eight different sampling stations in four seasons, in order that is identified important seasonal water quality parameters. An eigenvalue gives a measure of the significance of the factor: the factors with the highest eigenvalues are the most significant. Eigenvalues of 1.0 or greater are considered significant (Shrestha and Kazama, 2007). Classification of factor loading is thus `strong', `moderate' and `weak', corresponding to absolute loading values of > 0.75, 0.75-0.50 and 0.50-0.30, respectively (Liu et al., 2003). Corresponding, variable loadings and explained variance are presented in Table 3 and strong loading values have been highlighted. The two factors of PCA/FA include totally morethan 79 % of the total variance in each season respecting water quality data sets. Each water quality parameter with an strong correlation coefficient value ( > 75 %) was considered to be an significant parameter contributing to seasonal variations of the water quality in Haraz River. The most significant water quality parameters that can contribute to evaluate seasonal variations of water quality are signalized in Table 4. The temperature, nitrate, total solids and discharge are the most significant parameters contributing to water quality variations for all four seasons in the Haraz River Basin. Nitrate and total phosphate with positive strong loading value as the most significant parameters contributed to water quality variations in four and three seasons, respectively, it has this meaning that considerable amount of inorganic nutrients due to excessive influx of orchard and agricultural areas sewage, comprises Haraz River Basin almost in total year. The biochemical oxygen demand and fecal coliform with strong factor loadings are the most important parameters in water quality variations for three seasons of year and it is explanatory of this fact which entry of domestic wastewater causes considerable pollution and extra variations in river water quality more time of year. The total solid with strong positive loading is as another of the most significant parameters in water quality variations for whole of year and it can be demonstrator of erosion effect during cultivation of soil and in general high agricultural and river sand mining activities in environs this river. The temperature and discharge with strong loadings are as the most significant parameter contributed to water quality variations in four seasons and it represents the seasonal impacts of discharge and temperature. Conclusion In this study, various multivariate exploratory techniques were utilized to evaluate variations in surface water quality of Haraz River Basin. Cluster analysis grouped eight sampling stations into three clusters of similar water quality features and thereupon can be allocated whole river basin into three zones i.e. low, moderate and high pollution. According to acquired information, it is possible to plan for coming events, optimum sampling strategy, that can be lessened the number of sampling stations and affiliated recurring costs. The principle component analysis and factor analysis assisted to extract and recognize the factors or origins responsible for water quality variations in four seasons of year. The natural parameters (temperature and discharge), the inorganic parameter (total solid) and the organic nutrients (nitrate) were the most significant parameters contributing to water quality variations for all seasons. Result of PCA/FA evinced that, a parameter that can be significant in contribution to water quality variations in river for one season, may less or not be significant for another one. Accordingly it is required that, when selecting water quality parameters for implementing environmental monitoring plans in river basins, the seasonal variations of parameters in assessment of water quality must be consider. Acknowledgments The authors would like to thanks Department of the Environment of Iran for financial (contract No. T2/8006-470;2007) and scientific support through out this study. References
© IRSEN, CEERS, IAU The following images related to this document are available:Photo images[st09052t3.jpg] [st09052f1.jpg] [st09052t2.jpg] [st09052f3.jpg] [st09052t4.jpg] [st09052f2.jpg] [st09052t1.jpg] |
| |||||||||
