 |
| About Bioline | All Journals | Testimonials | Membership | News |
|
||||||
|
||||||
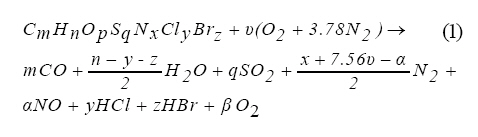
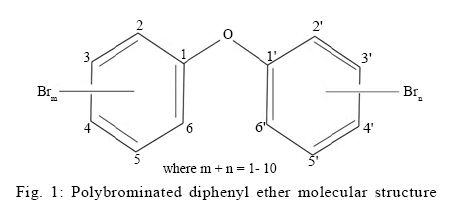
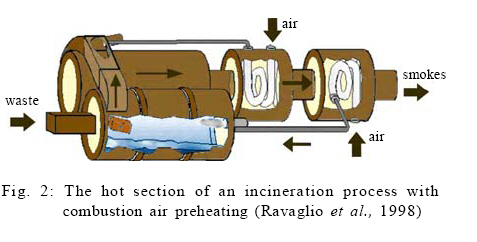
International Journal of Enviornmental Science and Technology, Vol. 6, No. 3, Summer, 2009, pp. 499-508 Transient mass transfer modeling and simulation of polybrominated diphenyl ethers combustion in incinerators 1 *M. Mousavi; 2 A. Taymouri, 3 V. Ghaffarian 1 Department of Chemical Engineering, Faculty of Engineering, Ferdowsi University of Mashhad, P. O. Box 91775 1111, Mashhad, Iran Received 14 September 2008; revised 23 April 2009; accepted 20 May 2009 Code Number: st09055 ABSTRACT In this paper, modeling and simulation of combustion process for polybrominated diphenyl ethers in rotary kilns has been investigated. Proper formula is found for the solid wastes which contain polybrominated diphenyl ethers and then combustion process is simulated by considering possible reactions, appropriate dimensions and operating conditions for rotary kiln and necessary relations for reaction rates. The software of MATLAB is used for the simulation. The mass variations for solid waste, outlet gas and its components are calculated during 20 h. The results show that the reaction rate is high for the first 2 h, thus the value of solid waste and oxygen decrease quickly while value of produced gases increases. The mass increase of polychlorinated dibenzo-p-dioxins/furans and polybrominated dibenzo-p-dioxins/furans during the whole time of the process is linear with mild slope but for the other compounds, including steam, carbon dioxide, nitrogen, nitrogen oxide, sulphur dioxide, hydrogen chloride and hydrogen bromine, the slope of variations becomes mild after 3 h. The process becomes steady state almost after 9 h. Keywords: Combustion process; Dioxin; Furan; Mass variations; Rotary kiln; Solid waste INTRODUCTION One of recent environmental problems is accumulation of wastes containing brominated flame retardants (BFRs) and especially polybrominated diphenyl ethers (PBDEs) as the most important portion of BFRs. Polybrominated diphenyl ethers are regarded as potential persistent organic pollutants (POPs) to be named under the Stockholm convention developed in 2001 in response to an urgent need for global action to protect human's health and the environment from POPs, persistent chemicals that bioconcentrate and bioaccumulate exponentially up the food chain. They are separated from aqueous media simply and absorbed by fatty tissues. Their bioaccumulation is decreased by increasing the number of bromine in their chemical structure. For example, Octa and Deca-BDE are less bioaccumulative than Penta-BDE in the environment and they convert to low brominated compounds like Penta-BDE (Alaee et al., 2003). Polybrominated diphenyl ethers constitute up to 30 % of such electric and electronic products as computers, television sets, etc. On the other hand, they disorder the work of thyroid node (Paasivirta, 2000; Schettler et al., 2000), result in problems in neural growth (Birnbaum and Staskal, 2004; Eriksson et al., 1998), and even cause different cancers (Evans and Dellinger, 2005). Release, accumulation, persistent and toxicity of PBDEs in the environment have been caused global concern about them which this concern has led to wide and accelerated studies around the world in this field. The combustion of PBDEs in incinerators is one of the most important parts of these studies due to production of dangerous compounds such as polybrominated dibenzo-p-dioxins/furans (PBDD/Fs) and polychlor-inated dibenzo-p-dioxins/furans (PCDD/Fs). Dioxin is one of well-known toxic chemicals. A report released in 1994 by the US Environmental Protection Agency (USEPA, 1994) clearly described dioxin as a serious public health threat. The EPA report confirmed that dioxin is a cancer hazard to people, that exposure to dioxin also causes severe reproductive and developmental problems and that dioxin can cause immune system damage and interfere with regulatory hormones. Dioxins are characterized by extremely low water solubility and have tendency for being strongly adsorbed on surfaces of particulate matter. The water solubility of dioxin and furans decreases and the solubility in organic solvents and fats increase with increasing chlorine content (McKay, 2002). Ohta et al. (2004) found that in the combustion of hydrocarbons such as ethane, propane and ethylene in the presence of HCl, acceptable values of polychlorinated dibenzo-p-dioxins/furans (PCDD/Fs) were produced. Under inappropriate combustion conditions, as shown by the results of the combustion tests using 100 mg samples of polypropylene, the incineration of non-chlorinated polymers in the presence of HCl even at temperatures of 800 °C or higher may result in high levels of PCDD/Fs formation. Hunsinger et al. (2002) showed that the PCDD/Fs and other chlorinated aromatics present in the waste stream or formed in the fuel bed can be destroyed under controlled secondary combustion conditions. In experimental studies done by Striebich et al. (1991), it was demonstrated that under oxidative conditions comparable to incineration, brominated precursors such as 2, 4, 6-tribromophenol or PBDEs could be destroyed at 800°C and 2 s residence time without formation of PBDD/Fs. Weber and Kuch (2003) found by fly ash catalyzed de novo synthesis, the mixed brominatedchlorinated PXDD/Fs are formed in municipal waste incinerators, similar to the PCDD/Fs. Also substitution ratio of bromine to chlorine in gas phase depends on temperature and residence time, thus increasing these two items decreases the substitution ratio. Yoneda et al. (2001) conducted an emission survey of PBDD/Fs and mixed PXDD/Fs, in addition to PCDD/Fs, from 75 incineration plants in Japan, PBDD/Fs and mixed PXDD/Fs, as well as PCDD/Fs, were found in effluent gases, bottom and fly ashes and liquid effluent of the incineration plants. Investigation of municipal solid waste in Sweden by Agrell et al. (2004; 1999) and Ter Schuer et al. (2004), in two places with same environmental conditions and wind direction, at a municipal solid waste incineration plant and an industrial urban reference site which producing asphalt and concrete showed the incineration plant had higher concentrations of PBDEs and Tetra-BDE in comparison with the reference site. This might happen as a result of activities at the plant such as ash transportation or leakage from storage of products containing PBDEs. The concentrations of PBDEs were relatively low in this research which might happen because of low mean temperature, 8, during sampling period that caused low vaporization of PBDEs from the surrounding surfaces. For Deca-BDE, no statistical difference between the sites was recorded and the concentrations were higher compared with Tetra-BDE. This may be a reflection of present use of Deca-BDE by society and diffusion of leakage from products in use. Using Deca-BDE instead of Penta-BDE results in higher concentrations of Deca-BDE in atmosphere in comparison with Penta-BDE mixtures, therefore treatment of waste is presently a source of releasing old PBDEs to the environment and these emissions should be considered as important sources in the transport assessment of these substances in the environment. Borgnes and Rikheim (2004) have investigated the emission of dioxin compounds that may occur from incineration of plastic wastes containing BFRs together with waste from households and the commercial sector. The results showed that as bromine increased up to 1-2 % by weight, the concentration of halogenated dioxins in untreated flue gas was significantly higher with BFRs than without them. On the other hand, increasing the content of bromine did not increase the concentration of chlorinated, brominated, and brominated/chlorinated dioxins in untreated flue gas. Brominated flame retardants were decomposed in combustion process and its amount in outlet flows was less than 0.001% by weight of BFRs in the waste mixture. Increasing the content of BFRs in the waste gave no significant increase in the emissions of dioxins. The emission level was the highest for chlorinated dioxins, lower for chlorinated/brominated dioxins and the lowest for brominated dioxins. The emission levels for chlorinated dioxins were low in comparison with emission threshold value for incineration of waste. In order to survey the resulting emission levels for dioxins, it is more important to focus on the combustion process efficiency and operating conditions of the flue gas treatment systems than peruse the bromine content level. Measurement of dioxin concentrations gave removal efficiency for chlorinated/brominated dioxins of > 99 % and for chlorinated dioxins about 93 %. The experiments done by Sakia et al. (2001) on combustion residues showed the reduction of PBDEs concentrations up to one to three times lower than feed concentrations. Up to now, the modeling and simulation of PBDEs in landfills have been represented (Mousavi et al., 2008) in the literature, however, it has not been investigated for incinerators. Therefore, in this paper, the modeling and simulation of PBDEs combustion in rotary kilns is considered. For this purpose, proper formula for the solid waste containing PBDEs is found and then process is simulated using MATLAB software and the mass variations of total gas, the components of gas including PCDD/F and PBDD/F and solid waste are specified. This study was carried out at Ferdowsi University of Mashhad during 2007-2008. MATERIALS AND METHODS PBDEs PBDEs are a class of brominated organic compounds that are used as flame retardants. Flame retardants inhibit and even suppress the combustion process by cooling (endothermic process) or formation of a protective layer (coating) or dilution (filters) (De Wit, 2000). These compounds decompose gradually when heated, therefore a critical factor in choice a flame retardant is its thermal stability. In ideal condition, a flame retardant decompos at less than 50 % of polymer combustion temperature. Brominated flame retardants are economically proper and have little effect on flexibility of base compounds, thus their commercial utilization is remarkable (Paasivirta, 2000). Chemical structure of a PBDE (Fig. 1) has 2-10 bromine atoms which have joined to diphenyl ether molecule. Hence, there are 209 congeners and 10 homologous groups for PBDEs based on the number of bromine substituent. In this way, each homologous group contains one or more congeners. Commercial PBDE products are composed of congener mixtures. More prevalent cases of them are Penta-BDE, Octa-BDE, and Deca-BDE. Commercial PBDEs are rather stable compounds with boiling points ranging between 310 °C and 425 and with low vapor pressures. The volatility of PBDEs is low and their solubility in water is very low, especially that of higher brominated diphenyl ethers. Polybrominated diphenyl ethers are soluble in toluene (Paasivirta, 2000). In appropriate combustion units, brominated compounds decompose to other brominated compounds that mainly contain HBr, dioxins and furans (Borgnes and Rikheim, 2004). Incinerator Increase in environmental problems and burying costs and also the ever-decrease in burying places for municipal solid wastes lead to proposing new ways, therefore, waste incineration has been gaining more and more popularity by significantly reducing the volume of collected material into an inert residue and at the same time producing a combination of heat and electricity (Yang et al., 2002). Among prevalent waste incineration techniques such as off-gas, liquid injection and rotary kiln, the last one is more coordinated to different physical states of hazardous wastes and also its high temperature chambers are able to destruct the hazardous and toxic organic wastes (brominated and chlorinated organic compounds) properly (Bowman, 1975). The basic structure of the plant analyzed in this paper comprises a rotary kiln followed by a postcombustion chamber (after burner system) and the corresponding air pre-heaters which allow the heterogeneous combustion to be improved and the auxiliary fuel consumption to be reduced. This configuration with geometry and plant layout is shown in Fig. 2. The solid is fed into the rotary kiln where the bulk of the combustion takes place and then moves along the chamber in a countercurrent configuration with respect to the gas flow. The resultant combustion products go to a cyclone postcombustion chamber which allows the total combustion and destruction of contaminants be completed. At the end of the plant hot section two spiral heat exchangers are used to preheat the incoming combustion air (Rovaglio et al., 1998). The volatilized combustible products exit through the kiln and enter the secondary chamber where additional oxygen is made available and ignitable liquid wastes or fuel can be introduced to achieve the desired operating temperature. Inert ash is removed from the lower end of the kiln. Some different factors such as residence time, additional oxygen and proper temperature are effective on process efficiency (Rovaglio et al., 1998). Modeling Waste feedstock characterization and combustion stoicheiometry The feedstock consists of a dry solid fraction (1 - W H2 0 ) and a moisture fraction (W H2 0)within the dry solid. A formal stoicheiometry must be associated with the combustible fraction of the solid waste (W BF) in order to account for the heterogeneous combustion. This leads to the stoicheiometric Eq. 1.
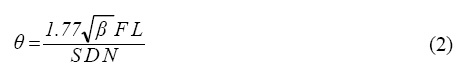
CO has been assumed to be the main oxidation product of carbon. The total combustion for CO2 production takes place in the gas phase. Furthermore, waste compounds containing nitrogen are converted to N2 and NO. Fraction of ± is evaluated as a function of kiln temperature and excess air (Bowman, 1975). Solid waste mass balance The solid waste undergoing the heterogeneous combustion passes through the rotary kiln incinerator for a certain retention time, while the effect of the mechanical agitation induced by rotation results in the renewal of the surface area exposed to hot gases containing oxygen. On this area, both volatilization and combustion processes take place at a rate which is largely dominated by the oxygen transfer rate towards the surface since the temperature is high enough to reduce the importance of the chemical reactions kinetics. This is why in the model scheme; the rate of destruction of the waste combustible fraction is computed according to the oxygen mass transfer from the bulk gas phase to the solid flame surface. The bulk solid phase movement along the rotary kiln is not different in nature from that of similar units. Hence, retention time,θ , as shown in Eq. 2 is reported by Freeman (1989):
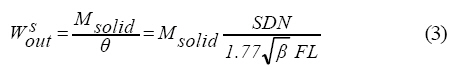
Where, β is the dynamic angle of repose for the solid material, F is the factor that related to internal area of incinerator, S is kiln slope, N is rotational speed of kiln, and D and L are internal diameter and length of combustion chamber, respectively. The outlet solid flow rate,WS out , can be determined by linking it to the aforementioned retention time and to the instantaneous solid mass hold-up within the incinerator (Eq. 3):
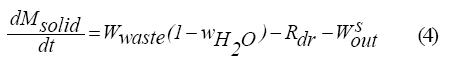
Where, Msolid is solid holdup inside kiln. The mass balance for the solid phase will be as follows:
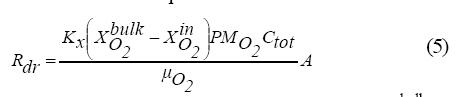
Where, Wwaste is inlet waste flow rate and Rdr is destroying rate of waste combustible fraction that can be obtained from Eq. 5.
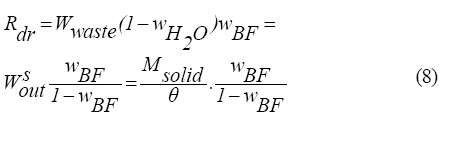
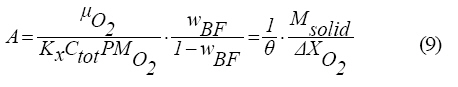
In Eq. 5, Xbulk 02 is mass transfer coefficient, is oxygen mole fraction in bulk of the gas phase Xin 02, is oxygen interface mole fraction,is molecular weight of oxygen Ctot, is total concentration in gas phase μ O2 , is stoichiometric coefficient for waste combustion and A is interface area for solid oxygen contact. This area is a function of the kiln geometry and the operating conditions. The maximum possible interface area would depend also on particle diameter and solid angle of repose; if one could estimate the average renewal surface velocity, then A is computable of Eq. 6: A = Ar θ (6) By assuming complete waste destruction at steady state condition, solid phase balance is simplified as Eq. 7 (Rovaglio et al., 1998): Ws out= Wwaste(1 - wH20)(1-wBF) (7) Then, Rdr and A follow from Eqs. 8 and 9:
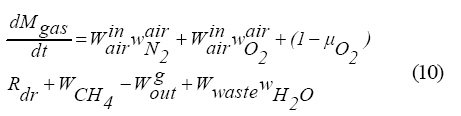
In Eq. 9, ΔΧ O2 shows difference between mole fraction of oxygen in bulk and interface. Gas-phase mass balances Taking into account possible auxiliary fuel, if required, the total gas-phase mass balance becomes:
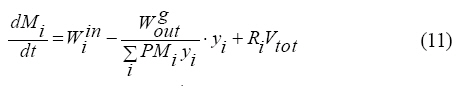
Where Mgas , Winair , wair N2 , wairO2 , W CH4 and g Wout are gas holdup inside the kiln, inlet air flow rate, mass fraction of nitrogen in air, mass fraction of oxygen in air, auxiliary fuel flow rate and outlet gas flow rate, respectively. The corresponding mass balances for each component can be specified by Eq. 11:
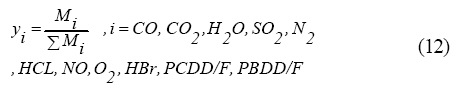
In equation 11, Wini is inlet flow rate of component i deriving from inlet flows or solid/gas reactions, Ri is production/consumption rate for reactions in kinetic regime, Vtot is combustion chamber volume and yi is the gas mole fraction of species i, which is computed from Eq. 12 (Rovaglio et al., 1998):
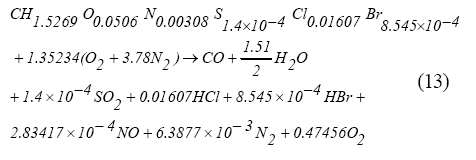
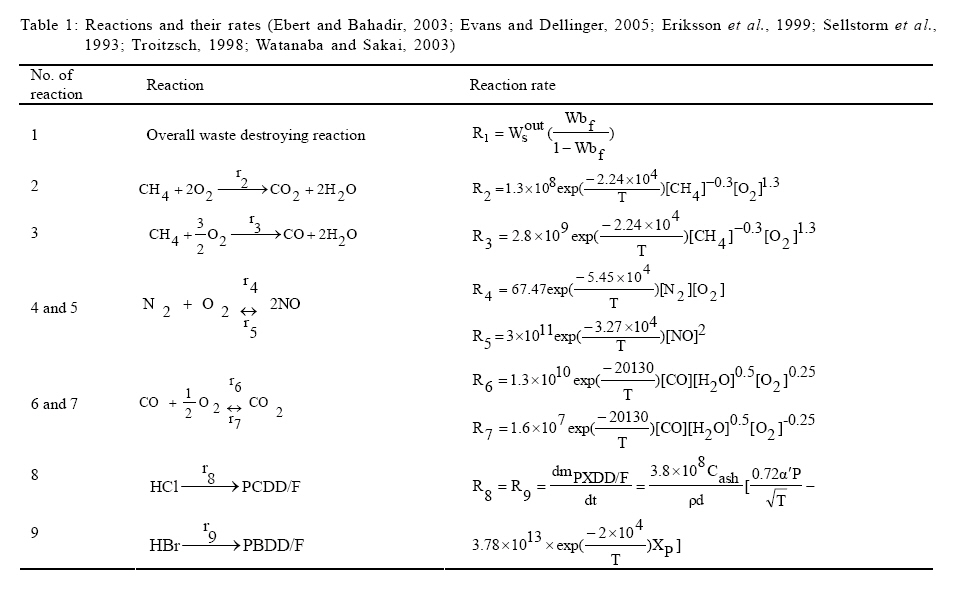
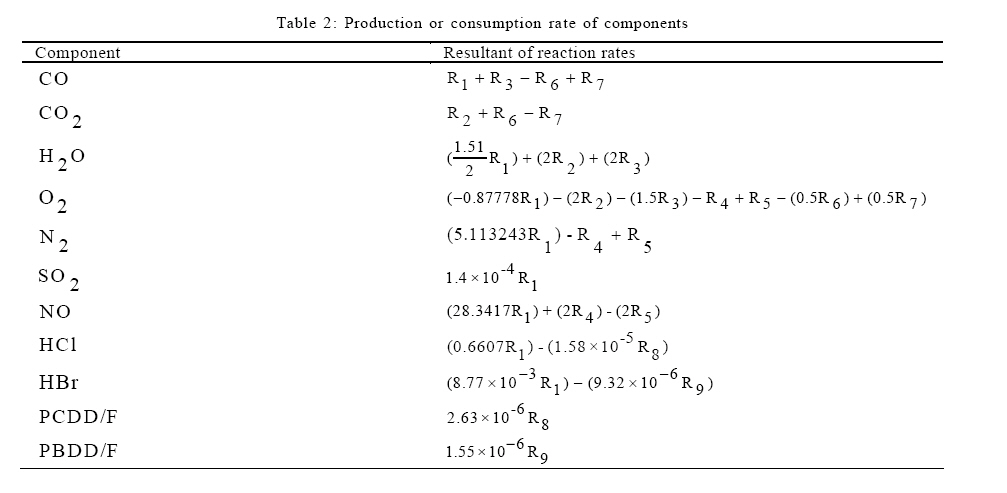
Reactions The reactions that occur in incinerator and also their rates, which are function of concentration and temperature of combustion and postcombustion chambers, are given in Table 1. The first reaction represents the previously mentioned overall waste destroying reaction producing CO as a result of heterogeneous combustion. CO will be immediately converted to CO2 according to reaction 6 when enough oxygen exists. The equilibrium conditions determined by reactions 4 and 5 refer to the afterburner system (homogeneous combustion). If auxiliary fuel is needed to maintain the required temperature (e.g. postcombustion chamber), the reactions 2 and 3 allow total or partial methane combustion as a function of the oxygen availability to be taken into account (Weber and Kuch, 2003). Rate constant for a forward reaction can be determined by computing equilibrium constant (Keq) and multiplying it by rate constant of a reverse reaction (Flagan and Seinfeld, 1988). In the rate equation of reactions 8 and 9, P is the partial pressure of HCl or HBr, Xpis the surface concentration of PCDD/F or PBDD/F, Cash is ash concentration, Ü is sticking factor and p and d are particle density and mean diameter, repectively. The first term in this rate equation is related to the adsorption rate of the acid molecule, and the second is a thermal destruction rate which is proportional to the surface concentration of PCDD/F or PBDD/F. Production and consumption rate for each component can be computed by summing effective reaction rates in production or consumption of that component, shown in Table 2 according to the reactions of Table 1. Simulation In order to realize the simulation, at first, composition of electric and electronic waste which consists of polymers, metals, ceramics and other different combustible and incombustible materials has been worked out and then according to the elements existing in the waste, its chemical formula and destroying reaction has been specified. Stoichiometric coefficients for oxygen in both sides of Eq.1 show that oxygen coefficient in the second side is a function of NO coefficient (á), so calculating equilibrium constant for the reactions 4 and 5 in Table 1 will give the amount of á fraction and oxygen coefficients. Finally Eq. 1 will be simplified to Eq. 13:
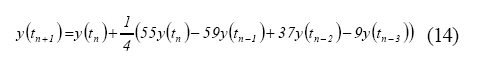
At first, the mole number and reaction rate of each components were computed at three primary instants. Then the mole numbers for each component were calculated in different times from Adams-Bashforth method by Eq. 14:
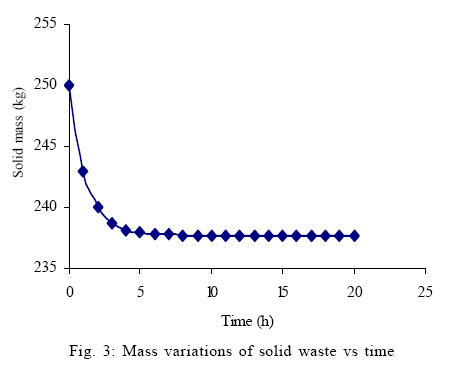
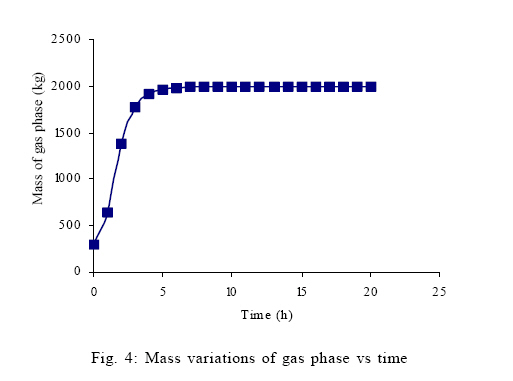
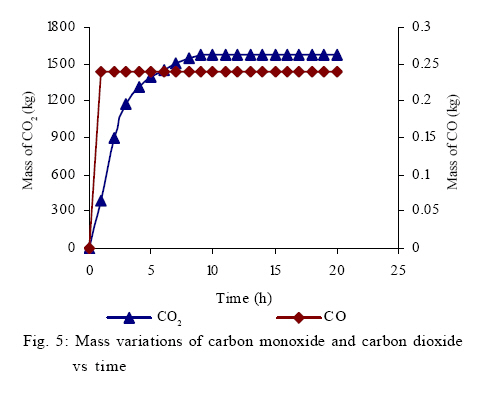
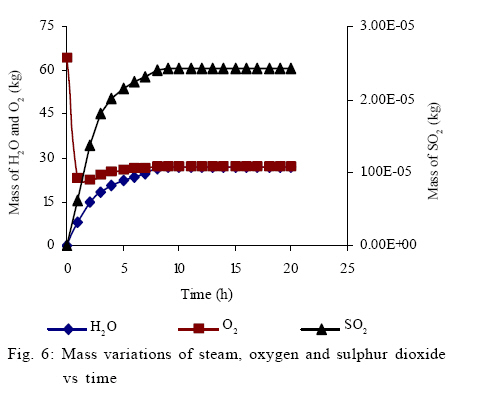
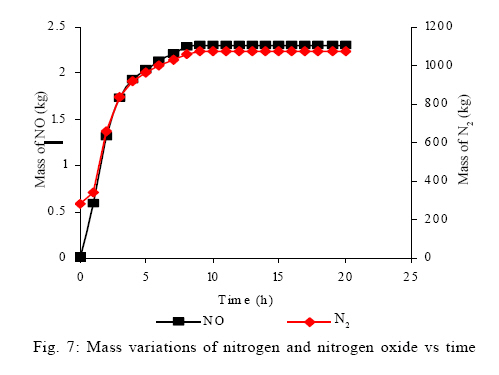
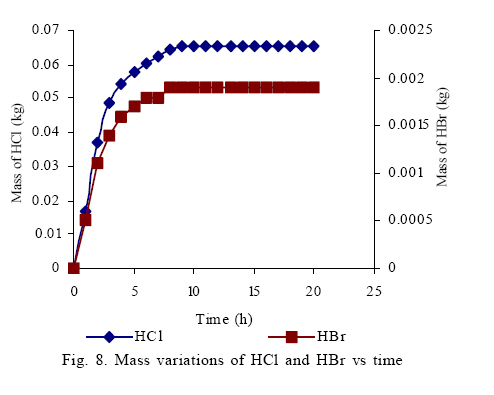
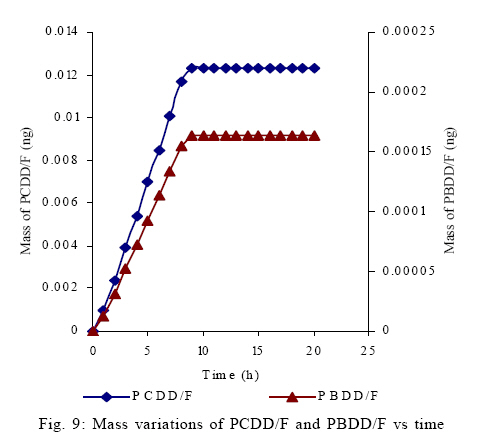
At last, the mass variations for solid waste, incinerator outlet gas and its components were determined as a function of time. Results and discussion Mass variation of solid waste Mass variations of the solid waste are presented as a function of time during 20 h in Fig. 3. Descending trend in this figure is almost removed after 5 h. Final mass for solid waste is 238 kg. Decreasing in waste mass may issue from waste incineration and volatilization of light components. Mass variation of total gas Entering solid waste into the incinerator, according to the high temperature, volatile components and moisture of waste enter gas phase and then exit the incinerator together with other products of combustion. In Fig. 4, mass variations of gas phase are shown as a function of time. Increasing in gas volume as a result of entering volatile components and combustion gases causes the increasing trend shown in Fig. 4 for 6 h. But, after this period of time, process becomes steady. Mass variation of gas components Mass variations for carbon monoxide and carbon dioxide, during the process, are shown as a function of time in Fig. 5. Carbon monoxide production as one of the most important outputs is maximized in the first hour and after that its trend becomes steady. The rate of CO production in reactions 1 and 3 is much higher than the rate of its elimination by reaction 6; therefore, sudden variation has happened in this matter mass during the process. Carbon dioxide is produced by reactions 2 and 6 (Table 1), and increasing trend in its production has been stopped after 9 h when its final mass would become 1580 kg. In Fig. 6, mass variations of steam, oxygen and sulphur dioxide are shown in terms of time. In first 3 h, steam diagram slope is too sharp and its production increases rapidly, but during next 6 h steam increases with lower slope, and then becomes constant. Steam is produced by overall waste destroying reaction and since there is high amount of oxygen, the production rate of steam is high, but it decreases gradually. In first two hours, oxygen decreases intensively to its minimum amount 22 kg that has happened because of its high consumption rate especially in reaction 1, after that as the combustion reactions compete together, it increases slowly and after 9 h the variations become zero. It is mentionable that oxygen may be produced by reactions 5 and 7 (Table 1). According to mass variations of SO2in outlet gas of incinerator, at first hour decreasing trend of the variations is fast but it becomes milder after 2 h, till the variations stop after 8.5 h. The concentration of SO2 is low in outlet gas because overall waste destroying reaction is the only reaction which produces it. Mass variations of nitrogen and nitrogen oxide are shown as a function of time in Fig. 7. For nitrogen, variations trend follows pattern of overall waste destroying reaction, as the nitrogen increases intensively in first four hours and then quietly during next hours till it gets to the maximum amount of 1080 kg and after 9 h no change occurs in its amount. According to nitrogen presence in inlet air and the reactions which happen in incinerator, nitrogen is an important part in outlet gas. The variation of nitrogen oxide mass has same trend like it of nitrogen, but they have great difference in quantity which issues from the difference in the rate of reactions 4 and 5 (Table 1). On the other hand, in overall waste destroying reaction, stoichiometric coefficient for nitrogen oxide is much lower than nitrogen. Besides inlet air contains a large amount of nitrogen. All of the results represented in this section until here are in agreement with those of Rovaglio et al. (1998) for the incineration of conventional solid waste. In Fig. 8, mass variations of HCl and HBr are shown as a function of time. These two diagrams follow the same pattern and their difference is in their mass amount which relates to their quantities in the solid waste. Fig. 9 shows the mass variations of two compounds of PCDD/F and PBDD/F during 20 h. During the first 9 h, increasing trend of the mass is approximately linear and after that no variation is seen in it which this is an effect of combustion process stability. Electric and electronic wastes usually contain compounds of chlorophenol, chlorobenzene or other chlorinated compounds more than brominated compounds, which produce HCl and after that PCDD/F, therefore, mass quantity of produced PCDD/F is much higher than PBDD/F. According to Eqs. 8 and 9, dioxin and furan concentrations depend on HCl and HBr concentrations highly and as shown in Fig. 9, at first hour of the process, the diagrams slope is sharp because the concentration of these two acids is high and in this case, conditions are proper for faster and higher production of dioxins and furans. CONCLUSION According to poisonousness of PBDEs and their accumulation in the environment, combustion of the waste which contains these hazardous compounds is one of the best ways to destroy them. Unfortunately, PBDEs produce toxic gases such as dioxins and furans during combustion process in incinerators. The process rate is high at the first 2 h and the mass value for the solid waste decreases gradually. On the other hand, the amount of the outlet gas increases fast although oxygen decreases intensively. At the third hour, the diagrams slope of mass variations for most of the gas components, including steam, carbon dioxide, nitrogen, nitrogen oxide, sulphur dioxide, hydrogen chloride and hydrogen bromine increase mildly till six h. These components almost have the same trend, but their quantities are different with respect to the reaction rates and stoichiometric coefficient for each of them in the reactions. Carbon monoxide production gets to its maximum amount in the first hour and after that its trend becomes steady as it is gradually converted to carbon dioxide. Production diagrams of PCDD/F and PBDD/F have linear trend with mild slope during all 9 h and difference between their quantities refers to HCl and HBR amount, as the considered waste usually consists of chlorinated compounds more than brominated compounds. REFERENCES
© IRSEN, CEERS, IAU The following images related to this document are available:Photo images[st09055f8.jpg] [st09055f6.jpg] [st09055f1.jpg] [st09055t1.jpg] [st09055t3.jpg] [st09055f7.jpg] [st09055t2.jpg] [st09055f2.jpg] [st09055f5.jpg] [st09055f9.jpg] [st09055f3.jpg] [st09055f4.jpg] |
| |||||||||
