 |
| About Bioline | All Journals | Testimonials | Membership | News |
|
||||||
|
||||||
Anisotropy and bedding effects on the hydro geological regime in a confined aquifer to design an appropriate dewatering system 1*A. Aryafar; 2F. Doulati Ardejani 1Department of Mining Engineering, Faulty of Mining, Petroleum
and Geophysics, Shahrood University of
Technology, Iran *Corresponding Author Email: ahariafar@yahoo.com Tel./Fax: +98273 333 5509 Received 12 February 2009; revised 5 July 2009; accepted 9 August 2009 Code Number: st09062 ABSTRACT Prediction of groundwater inflow into mining excavations is very important in order to design an effective dewatering system to keep the mine workings dry and create prolonged cone of depression. The effects of anisotropy ratio and bedding on the hydraulic head and drawdown curves of a dewatering test carried out in a fully penetrating well in a confined aquifer have been investigated. An existing numerical finite element model has been used to perform the simulations. The results of the numerical model are compared to those from analytical Jacob and Lohman solution for estimating hydraulic heads and drawdown curves. It was found that the anisotropy ratio and bedding should not have a significant effect on drawdown and the quantity of inflow into a confined aquifer. It was further found that taking the simultaneous effects of anisotropy and bedding into account reduces the differences in the results of analytical and numerical methods. Comparison of the field data and model predictions showed that, the modelling results for a three layer anisotropic aquifer fit well to the field data than those results obtained for a single layer aquifer and the relative error decreased from 4.81 % to 2.98 %. Keywords: Analytical solution; Finite element; Inflow; Groundwater; Numerical model INTRODUCTION With developing mining, groundwater invasion and impacts of groundwater drainage, such as regional groundwater table lowering, developing cone of depression, groundwater recovery, land subsidence and water quality deterioration are environmental problems which endanger mining production and human life (Doulati Ardejani et al., 2003a; 2007; Doulati Ardejani and Singh, 2004; Longe and Enekwechi, 2007; Chenini et al., 2008; Aryafar et al., 2009). Effective prevention of water invasion or timely determination of the mechanism of water bursting and rational design of drainage plans are the most urgent mining challenges (Keqiang et al., 2006). Investigation of the interaction between mining activity and groundwater aquifers is necessary to establish an appropriate dewatering system. Acquisition of hydrogeological data such as hydraulic conductivity, storage coefficient and primary regime of the hydrogeological system are the main factors for designing a proper drainage system. Simple analytical solutions have been used in the past to predict groundwater inflow into the surface mine excavations in order to design a dewatering system (McWhorter, 1981; Domenico and Schwartz, 1990; Rubio and Lorca, 1993; Lewis, 1999; Marinelli and Niccoli, 2000; Gallardo and Marui, 2007). However, analytical solutions of groundwater inflow are based on some idealised assumptions and simplified boundary conditions that limit their applicability to different mining situations (Singh and Atkins, 1984; 1985a; 1985b; Singh et al., 1985; Singh and Reed, 1987). Furthermore, analytical approaches are not as flexible as numerical methods in simulating complex aquifer conditions and complex mine geometry (Doulati Ardejani et al., 2003a; Rashidinejad et al., 2008; Soltanmohammdi et al., 2008). While analytical equations are commonly used during the initial stages of mine development, numerical models for estimating mine inflow rates may be required at advanced stages of mine planning. When there is sufficient time and hydrogeological data, the numerical approach is the only method that can predict realistic inflow quantities which are required to design an appropriate dewatering system. Numerical models can be a powerful tool for solving a number of groundwater related problems associated with mining life and even at post-mining stage, but have specific features that must be addressed and that require a deep understanding of the mining environment (Rapantova et al., 2007). Numerical models are used to estimate the amount of water that could be encountered and would have to be disposed during mining and predict the impacts of mining on local and regional water resources (Rogowski and Weinrich, 1977; Williams et al., 1986; Naugle and Atkinson, 1993; Davis and Zabolotney, 1996; Azrag et al., 1998). One of the most important features in the simulation of dewatering test in an open pit mine is to take into account the variability of the main quantities predicted by a model such as inflow and hydraulic head by considering the effects of the values of the modelling parameters. Although the numerical model developed by Doulati Ardejani et al. (2003a) accounts for the inflow from an unconfined aquifer to a circular pit for which the anisotropy ratio of horizontal (Kh) and vertical (Kv) hydraulic conductivities (Kh / Kv) were varied and the effects of bedding were also considered, the model has been presented for an unconfined aquifer. Hence, their numerical model is not appropriate for simulation of the interaction between surface mining and a confined aquifer. This paper presents a numerical model using the SEEP/W software to simulate a dewatering test in a fully penetrating well in a confined aquifer by considering the effects of anisotropy ratio and bedding on the hydraulic head and drawdown curves. SEEP/W is a finite element commercial software developed by Geo-slope Inc. (Geo-Slope International Ltd., 2008) which can be used to simulate both simple and highly complex seepage problems because of its comprehensive formulation nature. SEEP/W may also be used in the analysis of geotechnical, civil, hydrogeological, mining and environmental engineering problems. The program permits analysis of seepage as a function of time, precipitation, infiltration, migration of a wetting front, steady state and transient flow, and confined or unconfined flow. Another most important feature of SEEP/W is transient or time dependence seepage analysis. The software can account for the drainage of water from soil pores, or water filling soil pores and the changes in hydraulic conductivity or permeability that occur in a transient seepage flow system. One of the great features and capabilities of SEEP/W model is the definition of the hydraulic conductivity and volumetric water content as a function of pore-water pressure in saturated- unsaturated flow systems. Furthermore, SEEP/W also supports heterogeneous hydraulic properties such as hydraulic conductivity and storage in an isotropic and heterogeneous flow system (Doulati Ardejani et al., 2003b). Modelling of the hydrogeological problems for prediction of groundwater inflow and post-mining groundwater recovery has been started in the study area in September 2006. Sangan ore deposit is located about 280 km southeast of Mashhad and about 16 km north of Sangan, Iran. Sangan is the second largest iron mine in Iran, consists of 1200 Mt ore and geographically has a latitude of 34Ú 24' N and a longitude of 60Ú 16' E.
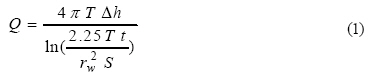
MATERIALS AND METHODS Geologic setting of the study area This deposit is recognised as skarn iron type which is elongated from east to west of Taleb mountain. Various rock types which can be recognised in the Sangan mine consist of Sarnosar granite, siltstone, sandstone and quartzite complex, north skarn unit, shale and siltstone, south skarn unit and volcanic complex. The iron ores in Sangan were grouped into the high grade massive iron zone, low grade dispersive iron zone, oxidised zone and sulphide zone. Application of analytical solution Jacob and Lohman (Jacob and Lohman, 1952) presented an analytical solution that describes the time-dependent decrease in inflow to a fully penetrating well from an ideal, confined aquifer when the drawdown in the well is instantaneously imposed and maintained at a constant level. This equation assumes that the well fully penetrates an aquifer that is infinite in areal extent and has uniform transmissivity and storativity (quoted in Kruseman and De Ridder 1979; Hanna et al., 1994). The Jacob-Lohman equation for a confined aquifer is given as follows:
Where, Q is the inflow (m3/s), T is the transmissivity (m2/s), S is the storativity of the confined aquifer (dimensionless), Dh is the drawdown (m), t is the time since the water level was instantaneously lowered to the specified level (s), and is the radius of the well (m). Inflow to a well from a less idealised aquifer is considerably more complex than that assumed by Jacob-Lohman solution, because the anisotropy (the ratio of vertical (Kv) and horizontal (Kh) hydraulic conductivities, (Kv / Kh) and bedding effects were not considered in Eq. 1. The results of the numerical model are compared to those from
Equation 1 to simulate a dewatering test in a fully penetrating well in a confined
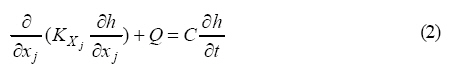
aquifer. Governing equation of inflow model The governing partial differential equation for a two dimensional saturated/ unsaturated groundwater flow can be expressed as follows (Freeze and Cherry, 1979):
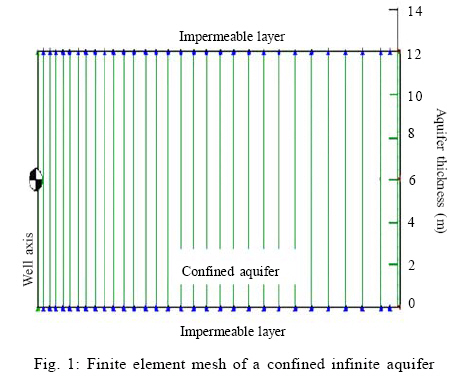
Where, xj is the Cartesian coordinates, KX is the directional hydraulic conductivity, Q is the recharge or discharge rate per unit volume, h is the hydraulic head, t is the time and C is the slope of the water storage curve. Equation 2 was obtained by coupling the Darcy's law and continuity equation. To solve Equation 2 using finite element method, the SEEP/W model utilises the Galerkin approach to determine an approximate solution. Galerkin approach is a weighted residual method in which the governing differential equation is substituted by an approximate solution (Pinder and Frind, 1972; Pinder, 1973; Gray and Pinder, 1974; Pickens and Lennox, 1976; Rabbani, 1994). RESULTS AND DISSCUSTION Three problems were considered using the numerical model and the Jacob-Lohman equation to estimate hydraulic heads and drawdowns resulted from a dewatering test performed in a fully penetrating well in a confined aquifer for which the effects of anisotropy ratio and bedding were considered. It should be noted that the input and output data are given separately for each problem described below. Problem 1- Simulation of a dewatering test in a fully penetrating well in a single layer confined infinite aquifer. The main objective of this first problem was to calibrate the numerical finite element model for simulation of dewatering analysis. The thickness of the aquifer was 12 m, the storativity of the aquifer was 0.0001, the hydraulic conductivity of the aquifer was 0.0007 m/s, the initial hydraulic head in the aquifer was 20 m and the transmissivity of the aquifer was 0.0084 m2/s. The dewatering rate was 0.1 m3/s and the well radius was 0.2 m. For numerical simulation of the problem, an axisymmetric finite element model was constructed with 30 four-nodded rectangular elements, 66 nodes in a single layer 12 m thick. Fig.1 shows the finite element mesh of the problem. The main purpose of the analysis is to predict the hydraulic head versus time at pumping well axis. To perform a numerical simulation, a steady state analysis was first carried out to establish an initial condition for transient modelling of dewatering test. This is necessary to generate a uniform total head distribution of 20 m throughout the aquifer. The following boundary conditions were considered for transient simulation:
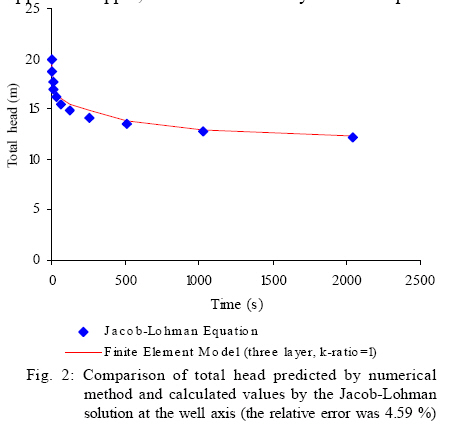
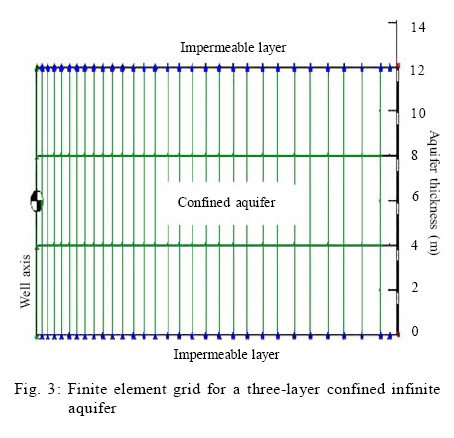
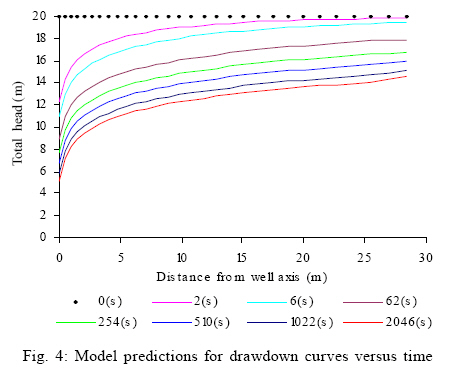
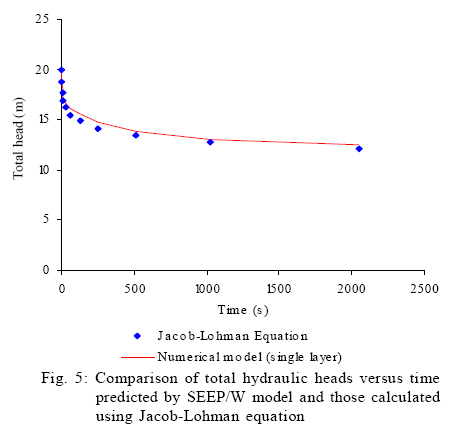
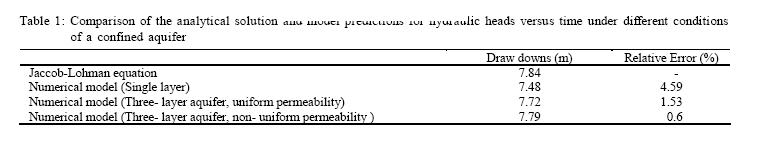
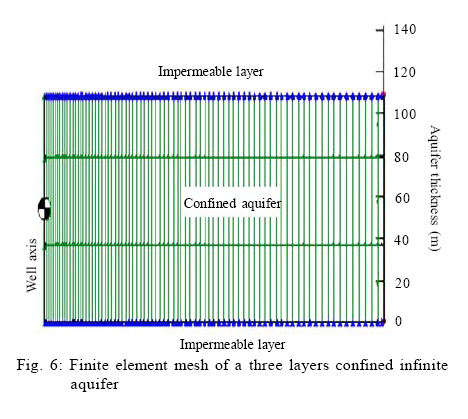
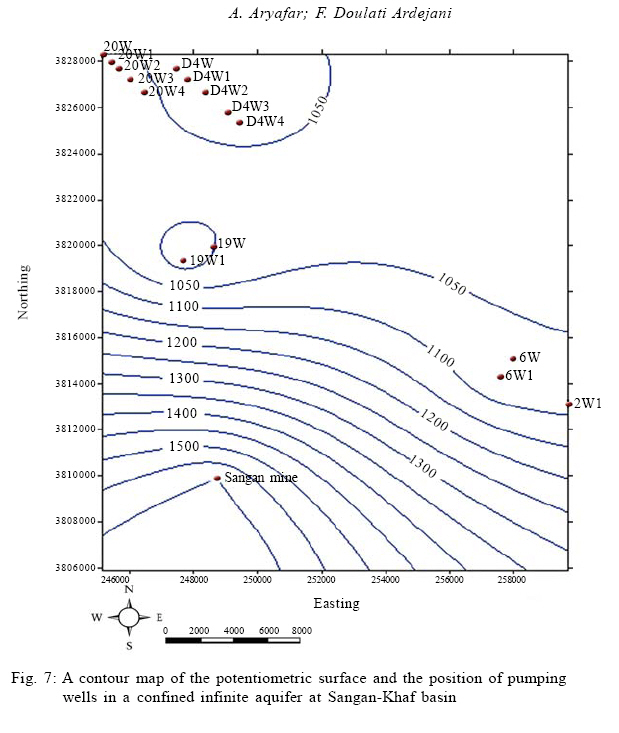
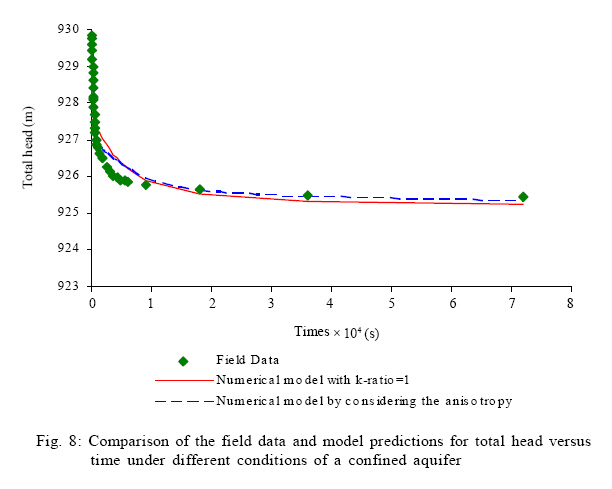
For simulation the time steps 2, 6, 14, 30, 62, 126, 254, 510, 1022 and 2046 (s) were considered. Fig. 2 show the comparison of hydraulic head as a function of time by numerical model and those calculated by the Jacob-Lohman solution. The relative error was 4.59 %. Problem 2- simulation of a dewatering test on a fully penetrating well in a three-layer confined infinite aquifer with uniform hydraulic conductivities. The main objective of this problem is to estimate the drawdown curves from a dewatering test in a fully penetrating well in a confined aquifer. The aquifer had a thickness of 12 m. The confined aquifer had a transmissivity of 0.0084 m2/s and a storativity of 0.0001. The dewatering rate was 0.1 m3/s and the well radius was 0.2 m. A finite element model was constructed with 90 four-nodded elements and 134 nodes in three layers; each layer 4 m thick (Fig. 3). The model consisted of an infinite element at the outer boundary of the aquifer. A hydraulic conductivity of 0.0007 m/s was assigned for all three layers. 10 time steps were used for the transient dewatering simulation. Fig. 4 shows the drawdown curves obtained at various elapsed times of 2, 6, 14, 30, 62, 126, 254, 510, 1022 and 2046 (s). The same initial and boundary conditions assigned in Problem 1 were considered in Problem 2. Fig. 5 compares the total hydraulic heads versus time predicted by the numerical finite element model with those calculated by Jacob-Lohman analytical solution, illustrating an error less than 1.53 %. Decreasing relative error in problem 2 in comparison with the error calculated in problem 1 may be related to the inclusion of the effect of bedding in the numerical simulation of dewatering test. Problem 3- simulation of a dewatering test on a fully penetrating well in a three-layer confined infinite aquifer with different hydraulic conductivities and anisotropy ratios. The third problem deals withthe simulation of a dewatering test in a fully penetrating well in a confined aquifer and under transient flow conditions. The aquifer was assumed to be three layers. Each layer had different hydraulic conductivity. The aquifer had a thickness of 12 m and a storativity of 0.0001. The initial hydraulic head in the aquifer was 20 m. The well was dewatered with a uniform rate of 0.1 m3/s. The well radius was 0.2 m. An axisymmetric finite element analysis was performed using a grid constructed with 134 nodes, 90 four-nodded elements and 3 layers totalling 12 m (Fig. 3). The calculations were made using the numerical model and the Jacob-Lohman equation to estimate hydraulic head versus time for which the anisotropy ratio (Kv / Kh) of were varied. The anisotropy ratios of 0.4, 0.3 and 0.2 were applied for upper, middle and lower layers of the aquifer respectively. It was found that differences in the results of analytical and numerical methods hydraulic heads versus time were not sensitive to the anisotropy ratio and bedding planes. However, considering the simultaneous effects of anisotropy and bedding reduced the relative error from 4.59 % (Problem 1) to less than 1 %. Consequently, the results obtained from analytical solution and those of numerical models have been compared in Table 1. Problem 4- Prediction of hydraulic head versus time in a pumping test from a fully penetrating well (No. 20W3) in a confined infinite aquifer at Sangan iron mine by considering the anisotropy ratio and bedding effects similar to the problem 2, in this case, a finite element model with 334 nods and 240 elements in three layers was constructed (Fig. 6). The hydrogeological data observed on pumping well No. 20W3 at Sangan Iron mine was selected for the simulation purpose. Fig. 7 shows a contour map of the potentiometric surface and the position of all pumping wells including well No. 20W3 (IMECC, 2004). The aquifer was simulated as three layers with different thicknesses of 36, 42 and 30 (m) from upper boundary to lower one. The overall thickness of aquifer was 108 m. The initial hydraulic head in the confined aquifer was 929.82 m. The average hydraulic conductivity of the aquifer was 0.000061 m/ s. The storage coefficient and the transmissibility of the aquifer were 0.000137 and 567.16 m2/day. The pumping rate was 3936 m2/day and the well radius was 0.3048 m. The number of time steps was 32. The boundary conditions assigned for this problem were similar to those boundary conditions considered in problem 3. According to the geological information obtained in the study area, the aquifer consists of conglomerate, clay, marl and limestone. Taking these geological formations into account, the corresponding hydraulic conductivities were 0.000068, 0.0000665 and0.000066 m/s for upper, middle and lower layers of the confined aquifer respectively. The k-ratios of 0.3, 0.4, and 0.5 were considered for different layers. Fig. 8 compares the field data and model predictions for total head versus time in case of a single layer confined aquifer with uniform hydraulic conductivity (solid line) and a three layer anisotropic aquifer with various k- ratios (dash line). The results showed that, the model predictions for a three layer anisotropic aquifer fit well to the field data than those results obtained for a single layer aquifer and the relative error decreased from 4.81 % to 2.98 %. CONCLUSION A two-dimensional axisymmetric finite element model called SEEP/W has been used to simulate a dewatering test in a fully penetrating well in a confined infinite aquifer. Four different problems have been presented for which the effects of anisotropy ratio and bedding on the hydraulic heads and draw downs were considered. The accuracy of the model was first evaluated by comparing the results of the analytical Jacob and Lohman solution (Jacob and Lohman, 1952) and a close agreement was achieved. It was found that the anisotropy ratio and bedding should not have a significant effect on drawdown and the quantity of inflow into a confined aquifer. It was further found that differences in the results of analytical solution and model predictions were not sensitive to the anisotropy ratio. However, considering the simultaneous effects of anisotropy and bedding reduced the differences in the results of two methods. Comparison of the field data and model predictions showed that, the modelling results for a three layer anisotropic aquifer fit well to the field data than those results obtained for a single layer aquifer and the relative error decreased from 4.81 % to 2.98 %. The numerical model almost predicted similar results when the values of the modelling parameters in particular hydraulic characteristics of the confined aquifer such as anisotropy and bedding were varied. The results obtained from the simulation presented here can provide useful information to design an appropriate mine dewatering system. ACKNOWLEDGMENTS The authors would like to express their appreciations to the assistance provided by the Faculty of Mining, Petroleum and Geophysics, Shahrood University of Technology and School of Civil, Mining and Environmental Engineering, University of Wollongong for providing SEEP/W software. REFERENCES
© IRSEN, CEERS, IAU The following images related to this document are available:Photo images[st09062f5.jpg] [st09062f3.jpg] [st09062f4.jpg] [st09062f6.jpg] [st09062f1.jpg] [st09062f2.jpg] [st09062t1.jpg] [st09062f8.jpg] [st09062f7.jpg] |
| |||||||||
