 |
| About Bioline | All Journals | Testimonials | Membership | News |
|
||||||
|
||||||
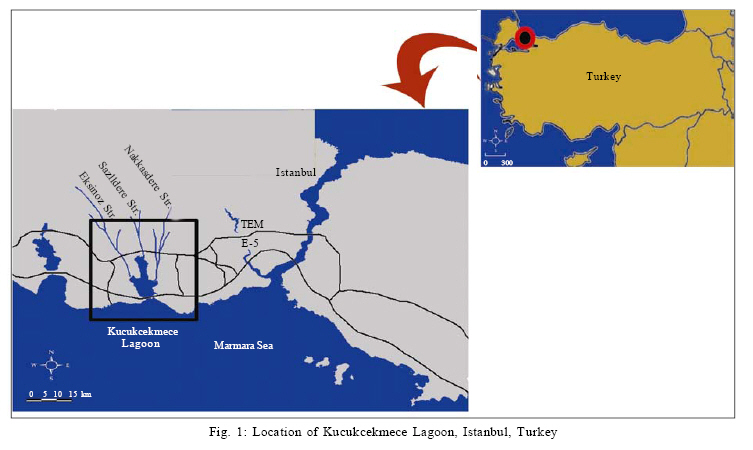
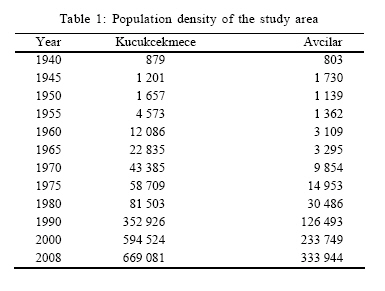
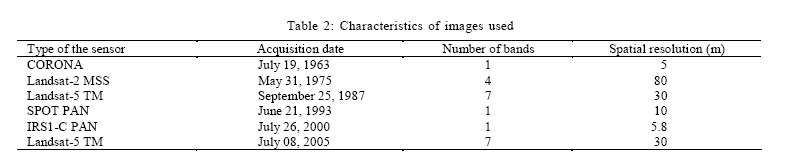
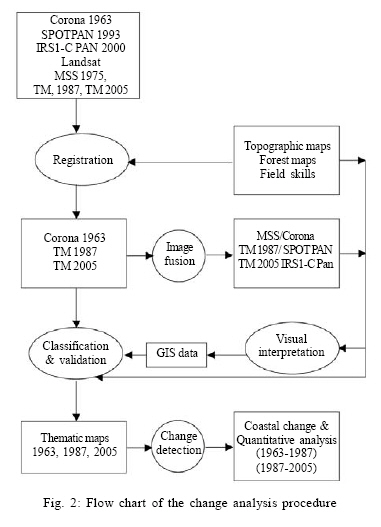
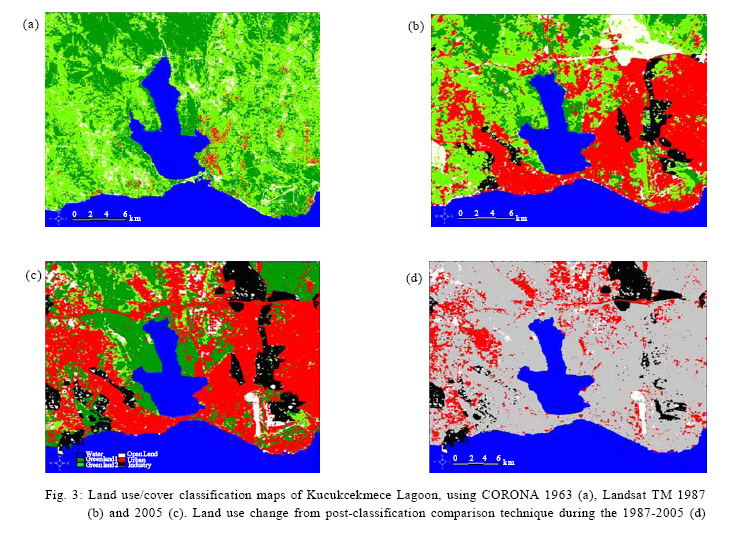
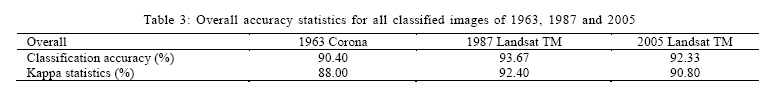
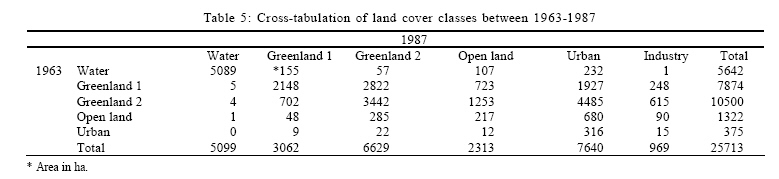
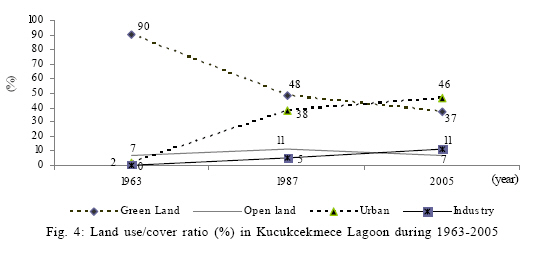
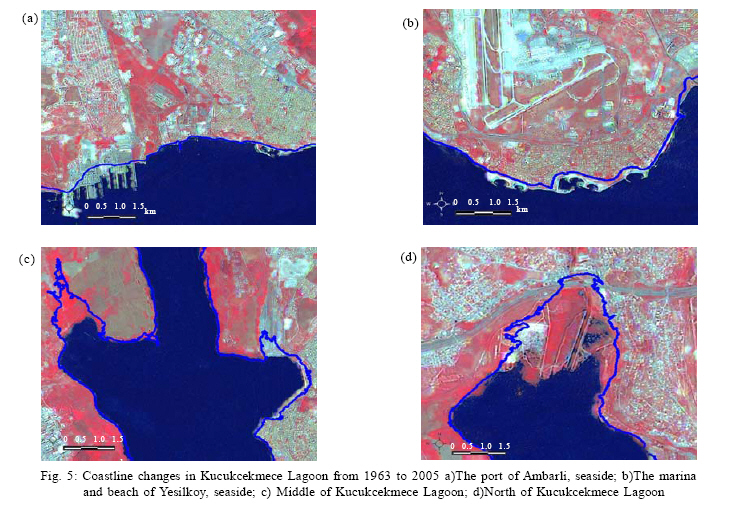
International Journal of Environment Science and Technology, Vol. 6, No. 4, Autumn, 2009, pp. 579-590 A satellite based assessment of the impact of urban expansion around a lagoon *M. Cetin Department of Computer Engineering, Yalova University, Yalova, Turkey *Corresponding Author Email: mufitcetin@hotmail.com Tel.: +90 226 814 30 00; Fax: +90 226 813 09 42 Received 18 March 2009; revised 29 June 2009; accepted 14 August 2009 Code Number: st09064 Abstract This paper examines the coastal regional trends in urbanization processes using remotely sensed images around the Kucukcekmece Lagoon as a case study, located in the western part of Istanbul, Turkey. Throughout the examination process, the coastline changes are determined for a long-term period. To achieve this goal, post-classification comparison method is applied to the CORONA and LANDSAT TM satellite images of 1963, 1987 and 2005. In order to identify the land use changes, common landscape structures in the region were distinguished as water, green and open land, urban and industrial areas. Due to the mix up of land-cover types between urban and industrial areas, the classified images are integrated with geographic information system data obtained from visual interpretation of the enhanced images and auxiliary data sets. The results of the change analyses in coastal region showed that important alterations are taking place in the area due to the unplanned urban and industrial expansions that has irreversibly changed the physical features of the Kucukcekmece Lagoon. According to image classification results, the urban land use area increased from 2 % of total area in 1963 to 38 % in 1987 and 46 % in 2005, most of which converted from agricultural and greenlands. At the same time, the ecological impact of the loss of specific land covers is highlighted based on the results of the land use changes and the previous scientific applications. Furthermore, some recommendations are given to planners, decision makers and politicians to maintain the sustainable coastal ecosystem management. Keywords: Coastal region; Environmental effect; Industrialization; Land-use change; Remote sensing INTRODUCTION Industrialization depending on the transportation networks around the world is centralized in the sea side and coastal areas. This industrial density has led to the settling of 60 % of the world population in coastal regions (Pernetta and Milliman, 1995; Nouri et al., 2008). Related to economic development, rapid and irregular urbanization, caused by population growth in residential areas also has increased the demand for land space in coastal areas (Cui et al., 2004; Banerjee, 2008). Especially, in developing countries, the irregular industrialization and urbanization has caused many environmental problems (Chowdhury and Rahman, 2008). Therefore, activities such as examining changes in land use, monitoring coastal areas and developing sustainable plans is important to maintain the regional ecosystems and coastal resources (Muttitanon and Tripathi, 2005). Particularly in the irregular urban development process, land use information has to be evaluated and compiled to assess the environmental impact of coastal changes (Giri et al., 2005). It should also be examined in the light of cause/effect relationships since there are causes and effects of each positive or negative urban development. Hence, future plans can be made more accurately using these cause/effect relationships. Very rapid urbanization in coastal regions makes it difficult to determine land use changes and to evaluate the cause/effect relationships by traditional methods for local and regional administrators on time. Since the early 1900s, local and regional governments have also used the aerial photographs which are more effective than traditional field studies as the data source for coastal mapping. However, there is a need to use many aeiral photos for coastal mapping at regional scale, which is costly and time-consuming for data collection and image analysis (Lillesand et al., 2004). On the other hand, spaceborne remote sensing technology developed at later time is an effective tool for spatial data acquisition to maintain the sustainable management of natural resources and to understand landscape evolution (Jensen, 1996; Campbell, 1997; Shaghude et al., 2003). Advantages of satellite imagery over aerial photography in the determination of land use changes include cost effectiveness, ability to reveal up-to-date information at large scale landscapes, ability to make evaluations for different purposes and ability to process in a short time (Wang and Moskovits, 2001). In addition, satellite images have a wider spectral range than aerial photographs to classify land use, particularly for the urbanized and industrial coastal regions. The land cover types can be well defined using satellite images in visible and infrared spectral bands (Alesheikh et al., 2007; Bandyopadhyay and Chattopadhyay, 2007). Therefore, spaceborne remote sensing technology offers new opportunities to identify problems of making and updating maps of coastal regions. During rapid industrialization years after 1960, the coasts of Marmara Sea became one of the domestic migrant destinations of Turkey. In addition, after the construction (between 1985 and 1992) of the trans european motorway (TEM) together with its connections to Route E-5 and the first and second Bosphorus bridges (Bogazici and Fatih Sultan Mehmet), the geopolitical importance of this region increased with fundamental changes in the economy (open economy and private sector development), transportation and communication (Kucukmehmetoglu and Geymen, 2009). During the past 50 years, the settlements and human population in the coastal areas of Marmara Sea has increased incredibly due to the economic development. Urbanization and industrialization, especially around the two Bosphorus Bridges and TEM Highway, causes forest decline within protection zones of drinking water reservoirs (Goksel, 1998; Musaoglu et al., 2005). A typical example of rapid urban growth in coastal areas is the case of Kucukcekmece Lagoon, located in the western part of Istanbul metropolitan area, Turkey. This coastal area hosts two of the most rapidly crowded districts of Istanbul which are Kucukcekmece and Avcilar. This region has been attracting the attention of researchers for several years due to the extremely rapid urbanization. Many studies have been conducted on different topics such as landslide mapping, water quality, watershed management, ecosystem modeling, urban ecology and land use change (Sunar, 1998; Tanik et al., 2000; Alparslan and Yuce, 2003; Duman et al., 2005; Maktav and Erbek, 2005; Cevik, 2006). The studies in the literature generally focus on two main issues, including the examination of water quality and the monitoring of land use changes in this region. The studies on water quality are conducted using several chemical and physical parameters for 1977, 1994 and 2003 (Gonenc et al., 1997; Demirci et al., 2006; Altun et al., 2009). These studies show that the water quality of the Kucukcekmece Lagoon is degraded by industrialization and urbanization activities over the last decade and that it is not compliant with safe drinking water standards due to the high level of pollution in recent years. At the same time, recently several land use studies have focused specifically on the water resource basin of the Kucukcekmece Lagoon (Coskun et al., 2008). These studies point out that a nearly 4-fold increase has occurred in the residential areas within the water-protection zone of Kucukcekmece Lagoon in the last decade. As a result of urbanization, new apartments, industrial factories, roads, highways and lifelines are constructed in the study area. In the coming years, changes in coastal land of the Kucukcekmece Lagoon will continue because new settlement areas are needed in the metropolitan city of Istanbul. Furthermore, this region is recommended as one of the most popular new settlement areas by regional managers (Duman et al., 2005). Therefore, periodic monitoring and determining of land use changes around the Kucukcekmece Lagoon have become necessary. The objective of this study is to determine and evaluate the spatial-temporal land use changes around the Kucukcekmece Lagoon, which is one of the fastest developing coastal zones in Marmara Sea Region, via the multi-temporal satellite data sets acquired at three different dates (1963, 1987 and 2005). Using satellite imagery, the changes in coastal land use were determined and analyzed via post-classification comparison method. Also, the GIS data obtained from the visual interpretation of satellite data sets are integrated to the classified images to improve the accuracy of the change detection results. This study represents a significant exemplary application showing the irreversible environmental effects of unplanned urbanization and industrialization activiies on green lands, agricultural and tourism development areas. MATERIALS AND METHODS Study area The study area, Kucukcekmece Lagoon, is situated on the European side of Istanbul City located in the Northern coast of the Marmara Sea, which constitutes an oceanographical link between the Black and Aegean Seas via Istanbul (Bosphorus) and Canakkale (Dardanelles) Straits (Fig. 1). Marmara Region, which constitutes a bridge between Asia and Europe, is the most densely populated region among the seven change geographical regions of Turkey due to its geopolitical position. This region has also two main roads: D-100 (Europe 5) motorway and the trans european motorway highway which continues to Europe from Asia. Kucukcekmece Lagoon is a small salt-water lake and is connected to the Marmara Sea by a narrow channel. Lake area is 16 km2 with a maximum depth of 20 m. The lake is 10 km in length and its widest part is 6 km. (Esen et al., 1999; Demirci et al., 2006). A large part of the region has light slopes with 200 m height differences. The shape of this region is shown to be controlled by structural lineaments (Gokasan et al., 2002). Especially, the west part of Kucukcekmece Lagoon is risky for residential and industrial settlements due to high landslide and seismic risks. The active northern branch of the Northern Anatolian Fault Zone passes through Izmit Bay, traverses Marmara Sea with 9 km south of the study area and reaches the Saros Gulf (Ambraseys, 2002; Duman et al., 2005). Recently, the Izmit earthquake of August 17, 1999 occurred with a magnitude 7.4 within 100 km south of this region (Hubert-Ferrari et al., 2000). Kucukcekmece Lagoon was a well-known domestic tourist destination of Istanbul for weekend trips to swim and fish until 1950s. The degradation due to human activities of the natural greenery around Kucukcekmece Lagoon started in the early 1960s. Kucukcekmece Lagoon with its long shoreline of 35 km and favorable geographic conditions has attracted the attention of many industrial and commercial companies. For that reason, since the 1980s, the coastal region of Kucukcekmece Lagoon has been one of the fastest industrially developing regions in Turkey. For instance, the Ikitelli organized industrial zone which is located on the Northeast part of the region houses very large national and international industrial companies. In addition, a nuclear energy research center and Ataturk (Yesilkoy) airport are located on the lake front and sea front respectively. On the other hand, heavy migration from the eastern rural parts of Turkey to the western metropolitan cities related to the socio-economic developments caused tremendous population growth around Kucukcekmece Lagoon. As shown in Table 1, the population increased more than 500-fold in the studied area from 1941 to 2007 due to industrial development and urban growth (TURKSTAT, 1982; 2008 and 2009). Data utilized Turkey has a poor tradition of cartographic data sources and therefore land use maps within the urban area are rarely available in the mid-20th century. For that reason, the forest maps of the general directorate of forestry (Scale 1: 25 000) and topographic maps of the general command of mapping (Scale 1: 25 000) were used mainly for making geometric corrections of the satellite images and to obtain ground truth data. Six sets of satellite images were utilized in this study (Table 2). Except Landsat-2 MSS data, multispectral satellite images were used to perform a classification analysis and visual interpretation. Besides, panchromatic images were used to perform image registration and to assess the accuracy of the classification results. Registration of multi-temporal remote sensing images is one of the most important preprocessing steps in detection applications since any misregistration greater than one pixel can cause erroneous results and lead to an overestimation of actual change (Stow, 1999). The July 2000 IRS-PAN image, selected as the master image, corrected with a first-degree polynomial equation using the universal transversal mercator (UTM) projection system was used as the nearest-neighbor method. A total of 23 control points, consistently distributed around the master image and topographic maps, were used during the rectification process. The master image was then used to rectify the other images (image-to-image). The RMS error for the master image and all the other images met the criterion of 0.5 pixels to provide inter-scene compatibility (Jensen, 1996; Lunetta and Elvidge, 1999). Field investigations are carried out to characterize some of the sample sites for the Kucukcekmece coastal areas in December 2008. The fieldwork supported TM/PAN fused images and aerial photographs using image interpretation results for land use and land-cover types. At the same time, additional field observations were conducted for accuracy assessment of classification results. Especially, the ground truth sites were examined for interpretation of the two time periods Landsat TM images dated in 1987 and 2005. Methodology In this study, a serie of methods are used to identify land use changes in the coastal areas of Kucukcekmece Lagoon in Istanbul, Turkey. The steps of the methodology are briefly illustrated in Fig. 2. Image enhancement and visual interpretation Visual interpretation is still one of the most widely used methods for detecting, identifying and characterizing the spatial features on an image since human brain is a good interpreter of images (Lillesand and Kiefer, 1994). On the other hand, image enhancement is a method widely used to provide effective display for image interpretation. Image enhancement techniques such as contrast enhancement, spatial filtering and image fusion, etc. improve the distinctness of the objects in images. Therefore, in this study multispectral images were enhanced with panchromatic images using Ehlers fusion technique, which has the ability to calculate in a short time and to preserve both spatial and spectral characteristics of source images. Experimental visual comparison results show that Ehlers method produces better results than other fusion techniques such as IHS, PCA (principal component analysis) and wavelet based methods (Ling et al., 2007; Cetin and Musaoglu, 2009). In the study area, spectral properties of urban and industrial classes are very similar. For that reason, visual interpretation using the enhanced images, topographic maps and auxiliary data is carried out in order to increase the accuracy of land cover mapping. Classification It is known that classification accuracy is largely dependent on the number of classes in addition to other factors like algorithm, training data, spectral and spatial quality of the used image, etc. Therefore, land use and land cover categories in 1963, 1987 and 2005 have been carefully examined by visual interpretation of fused satellite images, field survey skills, forest and topographic maps. As a result, it has been decided that six surface cover categories are optimum for the purpose of this study. These categories are composed of urban area, industrial area, greenland, water and open land. Water areas include the lakes, sea and other wetlands; urban is land that is used for urban and rural settlement; industrial area are areas of industrial and commercial interests; open land is area of exposed soil surface and bare land as influenced by human impacts or natural causes; greenlands contain vegetation with very low and high plant cover values. Greenlands were also divided into two different categories; greenland 1 and 2 includes the densest and less dense vegetation, respectively. In the used classification procedure, CORONA and LANDSAT TM satellite images of 1963, 1987 and 2005 were classified using density slicing and maximum likelihood algorithms. CORONA data was classified separately using density slicing technique since a panchromatic image consists of only one spectral band. The density slice algorithm classifies pixel values of the single band image according to a threshold value at which the best discrimination is obtained. Several threshold values are evaluated and finally the one with the best visual separation of class from others is applied to classify CORONA panchromatic image. Some areas in the urban areas and open land were misclassified as water due to highly reflective effects of sediment suspension near the coastline. Therefore, water areas are masked using the region growing segmentation method before the density slice classification. In order to validate the accuracy of the masked water area, the extracted water surface was compared manually on the topographical maps and fused image (Grosse et al., 2005). In addition, Landsat TM data were classified using maximum likelihood algorithm taking all bands except the thermal band to generate land use/cover maps of 1987 and 2005. The maximum likelihood classifier was chosen since it is based on statistical parameters and considered to be one of the most accurate classifiers. Finally, the urban and industrial spatial information obtained from the results of visual interpretation was integrated with the classified images (Fig. 3). Accuracy assessment Accuracy assessment is a very important indicator to form an idea about the quality and reliability of results and the uncertainty information derived from remotely sensed data (Congalton and Green, 1999). In the land use monitoring studies using the post-classification comparison method, it is necessary to pay attention to the classification accuracy of different classes since the classification error will affect the accuracy of the results of the change detection. For instance, Mather (2004) recommended that a standard of 85% accuracy is an acceptable level of digital image classification. Moreover, Congalton (1991) suggests that a minimum of 50 samples for each land cover class in the error matrix would be an acceptable guide to assess the classification results. Then, accuracy assessment for the classification was carried out using at least 100 pixels per group from fused images, topographic maps and field data. The location of the control points was chosen using random stratified method to represent different land cover classes of the area. In this study, the overall classification accuracy was found to be 90 percent for 1963, 94 percent for 1987 and 92 percent for 2005 (Table 3). Details of single class accuracy for all images of 1963, 1987 and 2005 can also be found in Table 4. This table shows that the accuracy for urban and industrial classes is higher than 85 percent for all images due to the integration of GIS data with the classified images. Normally, the accuracy was less than 60 percent for urban and industrial areas due to the mix up of small irregularly scattered industrial areas with urban settlements. Change detection Change detection is the process of identifying differences in land cover and land use properties using remotely sensed images acquired on the same geographical area at different times. In remote sensing applications, change detection has widespread methods, including those of monitoring deforestation, coastal dynamics, shoreline changes and river migration studies (Singh, 1989). In the last three decades, several change detection techniques have been developed and implemented to extract meaningful information from multi-temporal remotely sensed data. These methods include post-classification comparison, image regression, image differencing, principal components analysis, change vector analysis, band rationing and manual interpretation (Cohen et al., 1998; Lunetta and Elvidge, 1999; Lu et al., 2004; Cetin et al., 2008; Berberoglu and Akin, 2009). The type of method used to determine land use changes may have important effects on qualitative and quantitative results. Therefore, the selection of the appropriate method is quite important depending on implemented application and used images (Roy et al., 2002). The accuracy of the change detection results is affected by spatial, spectral and temporal resolution restrictions in remotely sensed data sets. For example, the low-resolution of multi-spectral images is not fit for change detection of the feature differences of urban because of detailed spatial structures of the cities. Besides, the scientific literature reveals that it is still difficult to provide a generic solution in any context for change detection using remote sensing images because the assessments of the regional land use changes pose complex problems due to a lack of historical knowledge and variability (El-Raey et al., 1999; Chan et al., 2001). Among change detection researchers, there is no agreement on the methods to produce the land use change maps. Surprisingly, postclassification comparison method is one of the most widely used methods of change detection applications. Because, the post-classification change detection method uses independently produced classified images for a pixel-by-pixel comparison. Furthermore, no radiometric normalization was needed for images obtained on different dates due to atmospheric, sensor and environmental differences and also it provides a complete matrix of change information (Jensen, 1996; Mas, 1999; Lu et al., 2003). For instance, Martin (1989) found that the comparative analysis approach of separate classified images produced a higher level of change detection accuracy. For that reason, the post-classification comparison method was used to find the land use changes that occurred between different time periods in this study (Jensen et al., 1995, Ridd and Liu, 1998). The final classified maps of 1963, 1987 and 2005 were overlaid using a post-classification comparison to generate a land use/cover change map of the coastal areas of Kucukcekmece Lagoon. Two different change images,1963-1987 and 19872007, were created by comparing the land use classes of later date from those of the previous date. Cross-tabulation analysis was carried out to determine which land-use of the earlier date has been replaced by a new land-use. This helps to determine and explain spatial patterns of land use change around Kucukcekmece Lagoon. Coastline change In this section of the study, coastline changes were examined using CORONA image of 1963, SPOT PAN image of 1993 and IRS-1C PAN image of 2000. In the studied area, coastal line of Kucukcekmece Lagoon for the intertidal and sea sides were extracted separately using region growing method and overlaid on the fused images for detecting the changes for 19631993 and 19932005 periods. RESULTS AND DISCUSSION The major outputs of this study are the compilation of relevant thematic information and evaluation of land use/cover distribution in 1963, 1987 and 2005. The visual interpretation of classified images for land use/cover changes confirms that there is a significant human-induced environmental effect of urbanization and industrialization around the Kucukcekmece Lagoon (Fig. 3). The land use/cover changes are obvious on the green and agricultural areas over the periods in 19631987 and 1987-2005. During 19631987, it is observed that unplanned industrial and residential areas increased gradually while the agricultural and greenlands gradually decreased especially in southern part of Kucukcekmece Lagoon which is nearest to the E-5 motorway, transit routes and harbors. In 1963, settlement was limited and there was no industry in the studied area as shown in Fig. 3a. Especially, during 1987-2005, major urban sprawl and industrial expansion are observed around TEM highway, which links Europe with the Middle East, passing from the northern part of the study area. In recent years, the rapid urban sprawl increased with airport and highway constructions causing a huge land space demand and environmental pressure around the Kucukcekmece Lagoon. Fig. 3c shows the urban expansion in the coastal region caused to the conurbation with Istanbul Province. In this study, post-classification comparison method is implemented with cross-tabulation GIS technique to identify the land use/cover changes during the periods 1963-1987 and 1987-2005. The statistical data about the spatial distribution of different land use/cover changes are summarized in Tables 5 and 6. The urban land use area increased from 2 to 38 % and industrial area increased from 0 to 5 % between 1963 and 1987 when the study area had the highest population growth rate related to industrial and economic developments (Fig. 4). Greenland covered 18374 ha in 1963, 9691 ha in 1987 and 7517 ha in 2005. It also shows that 59% of greenland has been converted into urban, industrial and open land between 1963 and 2005. At the same time, 2% of area of fresh water has been lost. Through cross-tabulation analysis it has been determined that 730 ha of open land is converted to urban and 871 ha to industrial area during 1987 to 2005 since a new airport, the TEM highway, new industrial and logistic zones were established in the area surrounding Kucukcekmece Lagoon. On the other hand, 1446 ha of bare land, urban and industrial area have been converted back to greenland. Furthermore, the urban, industrial and economic development caused a significant increase in population of this coastal region. Census data shows that Kucukcekmece and Avcilar cities have gone from 879 and 803 in 1940 to 669081 and 333944 in 2008 (Table 1). At the same time, the characteristics of the spatial and temporal variations in coastline changes are examined using the results of change detection and visual interpretation on the fused images. For this purpose, the coastal shorelines are extracted using the satellite panchromatic images in 1963, 1993 and 2000 and then overlaid on fused images. The created sub-maps from fused Landsat TM/IRS1-C image show that the shoreline of Kucukcekmece lagoon has been changing since 1963 (Fig. 5). The results clearly show that most of the costal shoreline changes have occurred due to indirect and direct human-induced effects such as sedimentation and land reclamation, filling materials for construction of harbors. After the establishment of many industrial zones in the 1980s, the Kucukcekmece Lagoon coastal region developed rapidly into an important manufacturing and trading region. Especially, several seaward shoreline expansions have occurred due to construction of harbors and ports as part of many industrial development zones between 1963 and 2005. It was observed that 340 ha of water area has been converted to land by filling the sea between 1963 and 1987. For 19872000 periods, 79 ha filled water areas were determined in the coastal areas. As shown in Fig. 5, the major coast line changes are seen in the sea side of the region as the construction of harbors, while the only few changes in the Kucukcekmece Lagoon have occurred due to natural effects such as reclamation and sedimentation. Over the last decade, land use changes caused by urbanization and industrialization in the coastal zone of Kucukcekmece Lagoon created tremendous environmental impacts on the coastal natural ecosystems at local and regional scales. The results obtained from previous scientific studies, which are implemented for water quality in Kucukcekmece Lagoon in different years, clearly show the environmental and ecological effects of land use changes (Acara and Gozenalp, 1959; Unlu et al., 1977; Gonenc et al., 1997; Demirci et al., 2006; Altun et al., 2009). According to these studies, heavy metal pollution has been identified in Kucukcekmece Lagoon due to the increasing industrialization in the region and water also has been found to be eutrophic when temporal pH, salinity, nitrate and phosphate values are examined historically. The heavy metal wastes, coming from industrial areas, are not dissolved in Kucukcekmece Lagoon due to salinity of the water and they are located in bottom sediments as chemical compounds. Therefore, the results of water quality analyses have given the impression that Kucukcekmece lagoon is not very polluted according to water quality standards. In fact, the Kucukcekmece Lagoon is much dirtier than its image suggests. Especially in spring, chemical fertilizers coming with rainfall from agricultural fields and domestic waste discharges coming from residential areas cause the amount of nitrate and phosphate in the water to increase. In the last decade, waste waters were discharged from the industrial and residential areas as point and non-point sources into the streams and several cases of fish death have been observed occasionally due to excessive pollution. Kucukcekmece Lake cannot be used anymore as a drinking water source due to excessive urbanization as a result of negligence of local governments since 1970s. On the other hand, even though previous scientific studies about the landslide mapping of the studied area indicate that this region is unsuitable for settlements (Duman et al., 2005). It is obvious that this problem is not taken into consideration by local and regional authorities. For instance, approximately one thousand people lost their lives during the 1999 earthquake, especially in the district of Avcilar. Even worse, new various industrial, commercial and residential future plans have continued to be developed and executed by local and regional governments in this region, which has the highest level of environmental impacts and a possible future earthquake risk. CONCLUSION As in all countries, it is well known that a rapid irregular urbanization comes with rapid industrialization and economic development. In the process, especially most of the coastal cities which are abundant, have comparatively cheaper living conditions and a temperate climate, have been the most attractive locations for people migrating from rural areas due to social-economic reasons. Unfortunately, the population growth caused by unplanned urbanization lead to enormous land use changes in the coastal areas in Turkey. As a case study, the various coastal land use/cover changes in the coastal zone of Kucukcekmece Lagoon such as urban, industrial, open and greenlands were examined using multisensor and multitemporal satellite images dated 1963, 1987 and 2005. The results show that one of the most important effects of urbanization and industrialization around the Kucukcekmece Lagoon is the decrease of green and agricultural areas transforming the region into an unhealthy coastal habitat. On the other hand, the residential and industrial areas increased especially in the north and west parts of the region while forests, semi-natural vegetations, agricultural fields and open areas decreased between 1987 and 2005. Change detection analysis around Kucukcekmece Lagoon has revealed that the vulnerability of uncontrolled industrialization continue with a complex urban administration system. Moreover, GIS information for the industrial areas, obtained from visual interpretation of remotely sensed images, are integrated with the classification results and implemented to increase the accuracy of the individual class categories. The results show that the integration of GIS data with satellite images using remote sensing techniques might provide valuable information to identify accurately the land use/cover changes especially in the urban areas which have fine spatial details. Since GIS data integration with the remotely sensed images facilitates the separability of major land cover classes having similar spectral properties such as open land, industrial and residential areas. Hence, industrial areas surrounded by settlements are separated from residential areas and open lands using GIS data integration technique in this study. This application shows that the integration GIS and remotely sensed data can be used as an important technique for providing accurate information to monitor and evaluate the land use/cover changes in the coastal region. Kucukcekmece lagoon is a key region in the Istanbul Province where proportion of industrial and residential areas are steadily increasing and it will be facing more space land pressure and environmental problems in the very near future. For that reason, the management of land use should be based on the presence/proportion of the green areas to protect coastal region ecosystems which can help to adapt more easily to environmental changes, including climate change. In this case, remote sensing techniques can be used as powerful and effective tools for the authorities to estimate the rate of the land use changes and to generate valuable data for the proper coastal management. Moreover, a central coastal management unit can be established by coastal district local governments to achieve the sustainable utilization of natural resources. Unfortunately, rapid urbanization and industrialization cause wrong land use in this coastal region and lead to water pollution problems in the Kucukcekmece Lake and its sustaining rivers due to insufficient waste water management. In determining, the relationships of the reason/result of the developments in this historical period should be carefully evaluated and analyzed by decision makers using remote sensing and GIS technologies. At the same time, the results and findings of this study also can be accepted as a basis for the authorities to review current urban conditions and to decide future urban plans. ACKNOWLEDGMENTS The author would like to thank the NIK construction and trading company for their data support. The author also would like to thank professor M. Dogan Kantarci for providing his insights on the ecology of Kucukcekmece Lagoon. REFERENCES
© IRSEN, CEERS, IAU The following images related to this document are available:Photo images[st09064f3.jpg] [st09064t2.jpg] [st09064f5.jpg] [st09064t5.jpg] [st09064f4.jpg] [st09064f2.jpg] [st09064t3.jpg] [st09064t1.jpg] [st09064f1.jpg] |
| |||||||||
