 |
| About Bioline | All Journals | Testimonials | Membership | News |
|
||||||
|
||||||
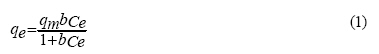
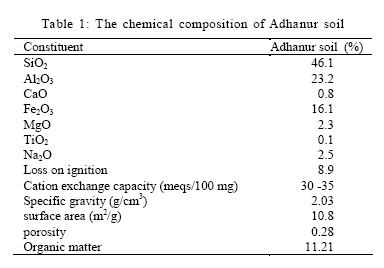
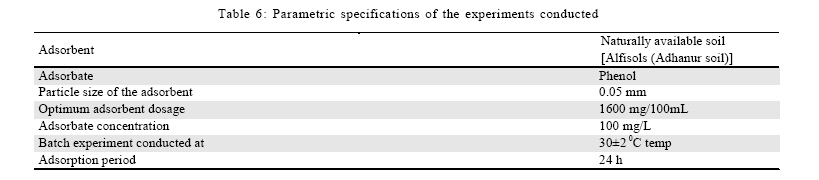
International Journal of Environment Science and Technology, Vol. 6, No. 4, Autumn, 2009, pp. 633-640 Linearized and non-linearized isotherm models comparative study on adsorption of aqueous phenol solution in soil *B. Subramanyam; A. Das School of Civil Engineering, SASTRA University, Thanjavur, India *Corresponding Author Email: subramanyam@civil.sastra.edu Tel./Fax: +91 4362 26410 1108 Received 25 September 2008; revised 20 June 2009; accepted 17 August 2009 Code Number: st09070 Abstract Use of native soil in adsorption of phenol from industrial wastewater has been one of the attractive option for dephenolation, especially in view of low cost and ease in accessibility, as well as scope for regeneration (or, at least reuse). However, an effective usage of the adsorbent necessitates a deeper understanding of the adsorption characteristics. Most of the study of adsorption characteristics are confined to analysis of mono- and bi- parametric isotherm models (and rarely, linearized multi-parametric isotherm models), due to the difficulties in solving higher parametric models, as well as fairly satisfying results by lower-parametric models. In the present study, adsorption batch studies were carried out using a naturally and widely available common soil of south India (namely, Adhanur soil), for removal of phenol from the aqueous solution, with an explicit objective of comparison of linear and non-linear regression methods for finding variation in isotherm coefficients and fitness of the models. Six linearized isotherm models (including four linearized Langmuir models) and three non-linear isotherm model were discussed in this paper, and their coefficients were estimated. Although all the studied isotherm models showed fairly good fit to the experimental data, but RedlichPeterson isotherm was found to be the best representative for phenol-sorption on the used soil adsorbent. Besides, it was observed that to determine the isotherm parameters non-linear isotherm models were found to be the best representative of adsorption characteristics, than their linearized counter-parts. Keywords: Adhanur Soil; Dephenolation; Multi-parametric coefficients; Regression Introduction Phenol toxicity in wastewater, largely contributed by the pharmaceutical, coke-oven, textile and leather industries (Fang and Chen, 1997; Murialdo et al., 2003), can be objectionable even up to 0.001 ppm in water (WHO, 1963). Also it causes several dreaded acute and chronic toxic effects on human health (inducing a wide range of symptoms: headache, vomiting, fainting, liver and kidney damage and other mental disorders) (ATSDR, 1998). A wide range of various treatment methods (namely, ion exchange, biodegradation, oxidation, solvent extraction and adsorption) have been reported to be used for removal of organic pollutants, in general and phenol, in particular, from industrial effluents (Kojima et al., 1995; Lanouette, 1977; Aksu and Yener, 2001; Kujawski et al., 2004; Dursun et al., 2005; Samarghandi et al., 2007; Agarry and Solomon, 2008). Yet, adsorption has been universally accepted as one of the most effective pollutant removal process, with low cost, ease in handling, low consumption of reagents, as well as scope for recovery of value added components through desorption and regeneration of adsorbent (Michot et al., 1991; Lawrence et al., 1998; Viraraghavan and Alfaro, 1998; Banat et al., 2000; Akbal, 2005; Abdel-Ghani et al., 2007). Use of adsorption for removal of phenol from industrial effluents are mostly confined to use of granular/powdered activated carbon as adsorbent has been widely used (Magne and Walker, 1986; Catural et al., 1988; Al Asheh et al., 2003; Goncharuk et al., 2002; Dabrowski et al., 2005). The various adsorption isotherm equations have been used to study the nature of adsorption, with the basic purpose of optimization of the design of adsorption-units for removal of pollutants from the wastewaters. For this purpose, most commonly used isotherms models include Langmuir, Freundlich and RedlichPeterson isotherm models (Porter et al., 1999; Srivastava et al., 2006; Bandyopadhyay and Chattopadhyay, 2007; Gueu et al., 2007; Vasanth Kumar and Sivanesan, 2007a). The linear least-square method has often been applied to confirm the consistency of the observed and experimental equilibrium data (using coefficients of determination) (Vasanth Kumar and Sivanesan, 2005; 2007b). However, the very approach of linearization of the nonlinear models necessarily yields rationalization of specific variables, which may have significant bearings on the adsorption process itself. In the present study, a comparison of linear least-square method and non-linear method of three widely used isotherms, Langmuir, Freundlich and Redlich-Peterson, was carried out based on experiment and computed phenol-sorption by the soil selected (namely, Adhanur soil) on phenol from its aqueous solution to estimate the effect of linearization on the accuracy of the model (on comparison with experimental values). The results, however, is limited to the specific soil-phenol system used and may not be extrapolated to every adsorption system, although the general trend may still be valid. The research has been conducted at Sastra University, Thanjavur, India in January 2008. Materials and Methods The soil (namely Adhanur soil) sample was collected from Thanjavur districts, Tamil Nadu in India. The samples was dried for 2 h, at 105 ºC in an electric oven, followed by crushing and sieving (100 - 635 SIEVE NO ASTM E11-87), to obtain the particles by an average diameter of 0.05 mm. The final sample, passed through the sieve then dried, desiccated and preserved in air-tight chamber for subsequent analysis and experiments. The chemical composition of Adhanur soil is shown in Table 1. According to United States Department of Agriculture (USDA), the Adhanur soil is classified as Alfisols (fine loamy, mixed, isohyperthermic) soil type (Soil Atlas, 1998). Phenol (C6H5OH) of analytical reagent (AR) grade supplied by Ranbaxi laboratories Ltd., India, was used for the preparation of synthetic adsorbate of concentration 100 mg/L. The required quantity of phenol was accurately weighed and dissolved in distilled water and make up to 1 L. Fresh stock solution was prepared every day and stored in a brown color glass bottles to prevent photo-oxidation. To study the equilibrium, batch experiments were conducted at room temperature (30 ± 2 ºC) for an adsorption period of 24 h. The effect of adsorbent dosage on the uptake of phenol on to the soil (namely Adhanur soil) was studied at different doses (50 to 1600 mg/100 mL) for the concentration of 100 mg/L. Adsorption isotherms In the present study, various adsorption isotherm models have been used to study the adsorption capacity and equilibrium coefficients for adsorption of phenol by naturally available soil. Three commonly used isotherms (viz. Langmuir, Freundlich isotherm and Redlich-Peterson equation) were studied. Langmuir's equation is a commonly used for isotherm modeling, which involves two parameter, expressed as follows. Langmuir isotherm equation is derived from simple mass kinetics, assuming chemisorption. This model is based on two assumptions that the forces of interaction between sorbed molecules are negligible and once a molecule occupies a site no further sorption takes place. Also these equations can reduce to Henry's law at lower initial concentrations. Alternatively at higher concentrations, it predicts a monolayer sorption capacity (Janos et al., 2003).
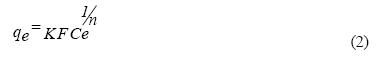
Where, qe is the amount of solute adsorbed per unit weight of adsorbent at equilibrium (mg/g), Ce is the equilibrium concentration of the solute in the bulk solution (mg/L), qm is the maximum adsorption capacity (mg/g) and b is the constant related to the free energy of adsorption (L/ mg). The Freundlich equation is an empirical model that considers heterogeneous adsorptive energies on the adsorbent surface and is expressed as follows:
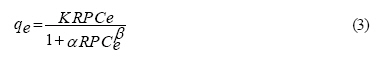
Where KF is a constant, it indicates the relative adsorption capacity of the adsorbent ((mg1-(1/n) L/n) /g)) and (1/n) is a constant. The equation characterized heterogeneity factor (1/n) so, it describes the heby term (1/n) and so the Freundlich isotherm describes heterogeneous system (Moon and Lee, 1983; Al-Duri and McKay 1998). The Redlich-Peterson equation is expressed as follows (i.e. features of both Langmuir and Freundlich isotherm assumptions):
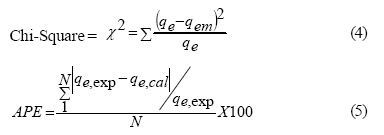
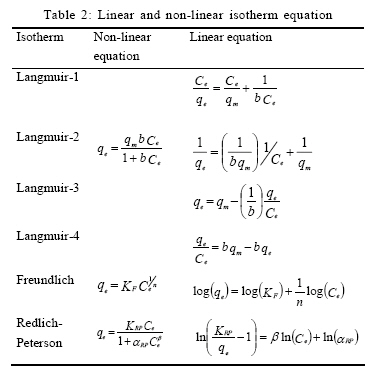
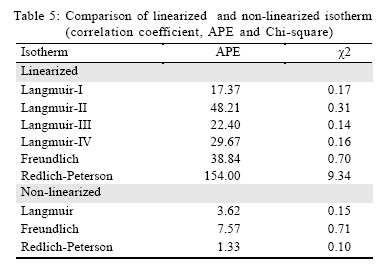
Where KRP (L/g) and a RP (L/mg)' are Redlich-Peterson isotherm constants and b is the exponent which lies between 1 and 0. The linearized equation of Langmuir, Freundlich and Redlich-Peterson are shown in Table 2. Results and Discussion Linear isotherm In the present study, to find out the models that can describe with precision the experimental results of adsorption isotherms compare the parameters that can be determined (linear and non-linearized isotherm) and also determine the theoretical adsorption isotherms. The experimental values of Ce and qe are initial deal with non-linear and linearized isotherm in order to determine the model parameters and build again using the determined values. Linear coefficients (r2) showed the fit between experimental and calculated values (Linearized isotherm models). Chi-square and average percentage errors (APE) are calculated by using Eqs. 4 and 5, indicates the fit between the experimental and calculated values of adsorption capacity.
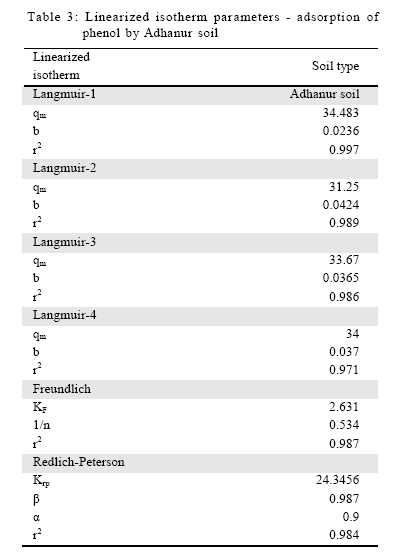
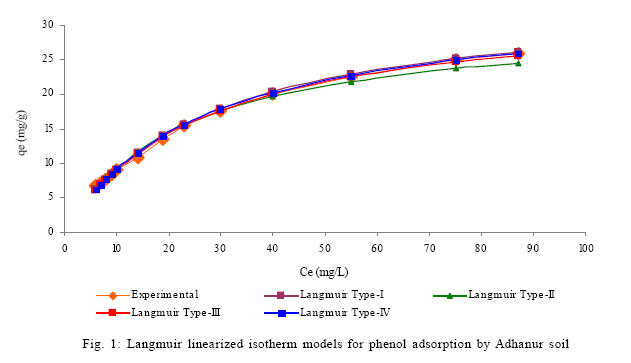
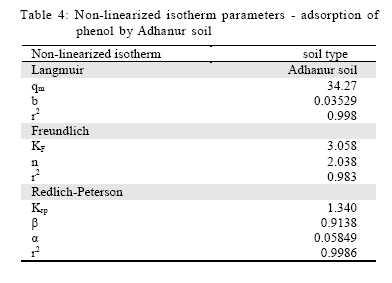
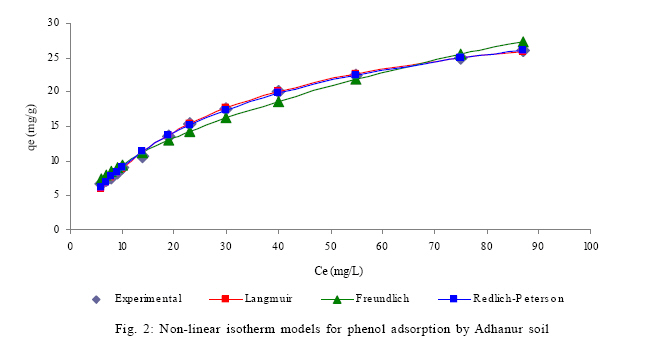
The non-linear and linearized forms of Langmuir, Freundlich and Redlich-Peterson isotherms are shown in Table 2. Langmuir isotherm equation can be linearized into four forms and simple linear regression results in different estimates (Gosh and Bhattacharya, 2002; Allen et al., 2003) and the Langmuir coefficients for four linearized Langmuir equation were obtained by plotting graphs between Ce/qe versus Ce (Type-I linearized equation), 1/qe versus 1/Ce (Type- II linearized equation), qe versus qe/Ce (Type-III linearized equation), and qe/Ce versus qe (Type-IV linearized equation). The calculated parameters are shown in Table 3. A plot was drawn between experimental and observed data as shown in Fig.1. From Table 3, it can be inferred that, different linear Langmuir equations show different Langmuir constants, as indicated by variation in errors, specific to the corresponding mode of linearization (Vasanth Kumar and Sivanesan, 2005). In the case of Adhanur soil, on comparison of the four linearized Langmuir equations, it is observed that the Type-I linearized Langmuir equation showed higher value of correlation coefficient (r2 = 0.997) than that of the other three linearized equations (Type- II to IV) as shown in Table 3. The adsorption capacity of Adhanur soil was found to be 34.483 mg/g for Type-I linearized Langmuir and that of Type- II and III are 31.25 mg/g and 33.67 mg/g, respectively. Thus, during linearization, errors in the computation of parameters may be responsible for the variation in adsorption capacity `qm' and adsorption constant `b' (from Type-I linearized isotherm form to Type-IV linearized isotherm). In other words, the transformation of non-linear isotherm model to linear isotherm models seems to implicitly alter the error functions, as well as the error variance and normality assumptions of the least-squares methods (Kinniburgh, 1986; Ho and Wang, 2004). The lower correlation coefficient values, suggest that it is not appropriate to use this type of linearization. In order to verify the validity of the Langmuir isotherm model, it is essential to calculate the average percentage errors and Chi-square values as shown in Table 5. It is clear from the Table 5 that the linearized Langmuir models (Type-I, Type-II, Type- III and Type-IV), the APE was more than 10 % percentage and Chi- square is high (indicating that the difference between experimental values and calculated values is very high), which indicates that the models are not able to describe equilibrium data. In spite of high correlation coefficient for Langmuir Type-I, it does not describe the equilibrium data adequately, because of high APE and Chi-square values. Hence, it is not appropriate to use the correlation coefficient values for comparing the best-fitting isotherms. Freundlich linearized equation is presented in Table 2 and the corresponding coefficients were estimated by plotting graphs between log (qe) versus log (Ce), using both experimental as well as observed data (Fig. 1). The values of the correlation coefficient (r2 = 0.987) for both linearized and non-linearized isotherms were found to be close to each other (Table 3), unlike the variation in Langmuir's linearized and non-linearized models. Also the coefficients (viz. KF and 1/n) for both linearized and non-linearized isotherms are found to be high as shown in Tables 3 and 4. The magnitude of the Freundlich adsorption capacity `n' gives an indication of favorability of adsorption. The values of `n' ranges from 2- 10 indicating good adsorption capacity,1-2 moderate adsorption capacity and less than one indicates poor adsorption capacity (Treybal, 1981; Hamdaouia and Naffrechoux 2007). The adsorption capacity for Adhanur soil is 1.87 for linearized model and 2.04 for non-linear model. In order to verify the validity of the Freundlich isotherm model, the average percentage errors and Chi-square values are shown in Table 5. It shows that there is not a good agreement between experimental and calculated data. Redlich-Peterson isotherm (using three-parametric modeling equation: Table 2 was plotted using experimental data between ln (KRPCe/qe 1) and ln (Ce). Redlich-Peterson isotherm contains three unknown parameters (viz. KRP,a and b), it is not possible to obtain three unknown parameters using lineralizing Redlich-Peterson isotherm. Thus, the three unknown parameters were obtained by minimization of the isotherm equation (and thus, by maximization of the correlation coefficient) (Table 3). In this case, the calculated parameters need not be unique (and could reflect the local optima) and hence the comparison of linearized and non-linearized isotherms may not be relevant. In order to verify the model validity the correlation coefficient was lower, as well as the average percentage errors and Chi-square value are very high (when compare other four linearized Langmuir and Freundlich). Therefore, the Redlich-Peterson linearized isotherm model is unable to explain the adsorption isotherm of phenol onto Adhanur soil. Non-linear isotherm In the present study, for studying non-linear isotherm models, Graph Pad Prism versions 5.0 have been used for determining the non-linear coefficients. The determined coefficients were shown in Table 4. Correspondingly, a plot was drawn between Ce versus qe (Fig. 2) using the experimental and predicted value by non-linear models. From Table 4 and 5, it was observed that the correlation coefficient value is high (r 2 = 0.998) and the average percentage error and Chi- square are very lower values (3.62 and 0.15, respectively).Thus, it indicates that the models are able to describe equilibrium data perfectly. Therefore, in the case of non-linear isotherm model, the error remains constant. Hence, it is appropriate to use the correlation coefficient values for comparing the best-fitting non-linear isotherm models. Table 4 shows a non-linear Freundlich model parameter values and Fig. 2 shows a plot between Ce versus qe. The correlation coefficient value is as same as that of linearized isotherm model. Table 5, shows average percentage error and Chi-square value. But, the average percentage error and Chi-square values show the improved up on linearized isotherm. When compare Freundlich with Langmuir isotherm model, the model is not able to describe equilibrium data perfectly. In the case of Redlich-Peterson model, the model parameter values are presented in Table 4. The correlation coefficients value was found to be as good as that of Langmuir isotherm model. The average percentage error and Chi-square values are shown in Table5. Parametric specifications of the experiments conducted are shown in Table 6. It is clear from Table 5 that the APE and Chi-square values of Redlich-Peterson model were better than Langmuir and Freundlich isotherm models. The model is able to describe experimental data perfectly. Consequently, the RedlichPeterson and Langmuir isotherms were the most suitable models for this sorption system. It was observed that the two isotherms (namely Langmuir and Redlich-Peterson isotherm) were found to closely correspond with each other, as per expectation (because the Langmuir isotherm is a special case of Redlich-Peterson isotherm, when value of beta approaches to unity). The similar findings have been reported by other researchers as well (Vasanth Kumar and Sivanesan, 2007b). Conclusion Often, linearization is used for estimating the adsorption characteristics of certain adsorption systems, due to the simplicity in estimation. The present paper clearly brings out the variation in estimation of the parameters, as well as the correlation coefficients (between the experimental and modeled values) and warrants against extensive linearization, which may lead to erroneous results (when compared to the non-linear optimized solutions). Besides, the various models of linearization adds to a specific aberration in the estimated values, as reflected by statistical tests. Thus, it is always better to find the isotherm coefficients by non-linear method, as far as practicable. In case of linearized models application, at least, the results must be accepted as approximate, not exact. ACKNOWLEDGEMENTS The author(s) thank the anonymous reviewers for helping us to present this research in a more effective manner. Authors also gratefully acknowledge the support received from SASTRA University. References
© IRSEN, CEERS, IAU The following images related to this document are available:Photo images[st09070t5.jpg] [st09070t4.jpg] [st09070f2.jpg] [st09070t6.jpg] [st09070t1.jpg] [st09070t2.jpg] [st09070t3.jpg] [st09070f1.jpg] |
| |||||||||
