 |
| About Bioline | All Journals | Testimonials | Membership | News |
|
||||||
|
||||||
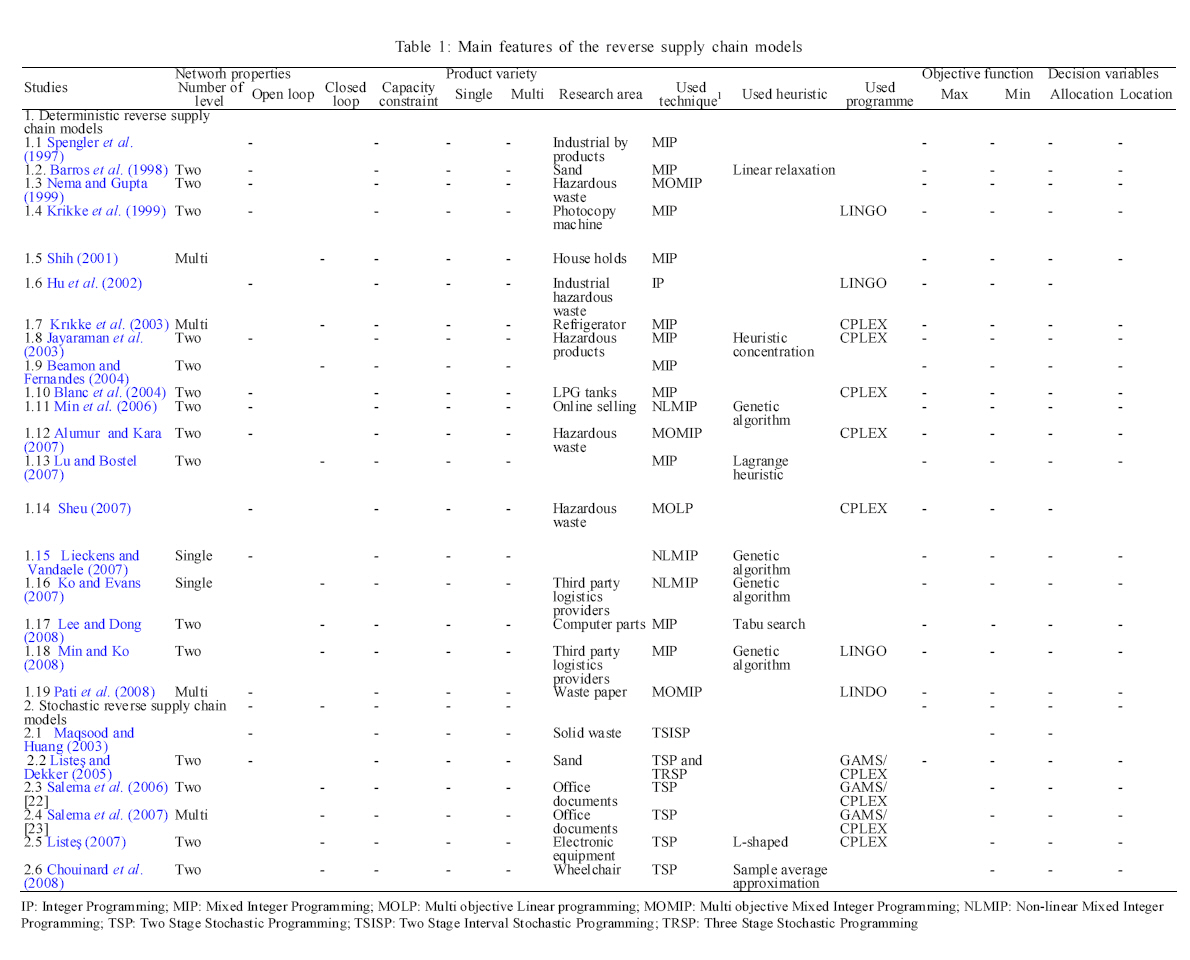
International Journal of Environment Science and Technology, Vol. 7, No. 4, 2010, pp. 717-730 A stochastic optimization approach for paper recycling reverse logistics network design under uncertainty *S. Soner Kara; S. Onut Department of Industrial Engineering, Faculty of Mechanic, Yildiz Technical University, 34349, Istanbul, Turkey *Corresponding Author Email: ssoner@yildiz.edu.tr Tel./Fax:+90 212 383 2902 Received 11 February 2010; revised 17 May 2010; accepted 26 July 2010 Code Number: st10071 ABSTRACT: One of the most important objectives of a manufacturing firm is the efficient design and operation of its supply chain to maximize profit. Paper is an example of a valuable material that can be recycled and recovered. Uncertainty is one of the characteristics of the real world. The methods that cope with uncertainty help researchers get realistic results. In this study, a two-stage stochastic programing model is proposed to determine a long term strategy including optimal facility locations and optimal flow amounts for large scale reverse supply chain network design problem under uncertainty. This network design problem includes optimal recycling and collection center locations and optimal flow amounts between the nodes in the multi-facility environment. Proposed model is suitable for recycling/manufacturing type of systems in reverse supply chain. All deterministic, stochastic models are mixed-integer programing models and are solved by commercial software GAMS 21.6/CPLEX 9.0. Keywords: Network optimization; Recycling; Two-Stage Stochastic programming INTRODUCTION In the past decade, rapid developments in technology, the emergence of new industrial products and shortened product life cycles have resulted in an increasing number of discarded products and caused growing environmental problems in the developed world. The current threatening level of environmental problems, along with related customer pressure and governmental regulations, motivates corporations to undertake environmentally-conscious initiatives (Tuzkaya and Gülsün, 2008; Lin et al., 2010). Due to the governmental regulations and consumer concerns regarding these environmental issues, an increasing number of companies have focused on reduction efforts in the amount of waste stream, diversion of the discarded products from landfills and disposition of the retired products properly. Increasing environmental problems enforce companies to be more environmental responsible (Tuzkaya et al., 2009). To facilitate the reverse flow of used products from consumers to manufacturers in an efficient manner, the most appropriate approach is to create a reverse supply chain network (Chien and Shih, 2007). Regarding the reverse supply chain networks for product recovery, reverse supply chain can be described as the process of collecting used products from the consumers to the manufacturers for the purpose of capturing value or appropriate disposal activities (Abdel-Ghani and Elchaghaby, 2007; Abdel-Ghani et al., 2009). These activities may include repairing of warranty returns, remanufacturing of the manufacturing of the same products, reselling of the products in good conditions and reusing of end-of-use returns. Reverse supply chain network design is a strategic issue of primary importance for the economic viability of product recovery activities. Design and implementation of reverse supply chain require setting up an appropriate network infrastructure for the increasing flows of used and recovered products (Jalili Ghazi Zade and Noori, 2008; Panjeshahi and Ataei, 2008). The reverse flow of the product originates from several points and is consolidated at just a few (or one) destinations. General network structure, most appropriate physical locations, the number of echelons, the number of facilities required, their capacities, the type of necessary facilities and transportation links between the network elements need to be determined to convey used products from their former users to a producer and to future markets again. Furthermore the markets for recovered products have to be identified (Listeº, 2007). A number of modeling tools and techniques have been mentioned in the literature for designing reverse supply chain networks (Bandyopadhayay and Chaltopadhayay, 2007; Chowdhury and Rahman, 2008). Most of the existing models have been developed through conventional mathematical programming techniques (Farzaneh and Saboohi, 2007). Some related studies for reverse supply chain network design utilizing these techniques can be summarized in Table 1. MATERIALS AND METHODS Two-stage stochastic programming The set of decisions is divided into two groups in two-stage stochastic programming:
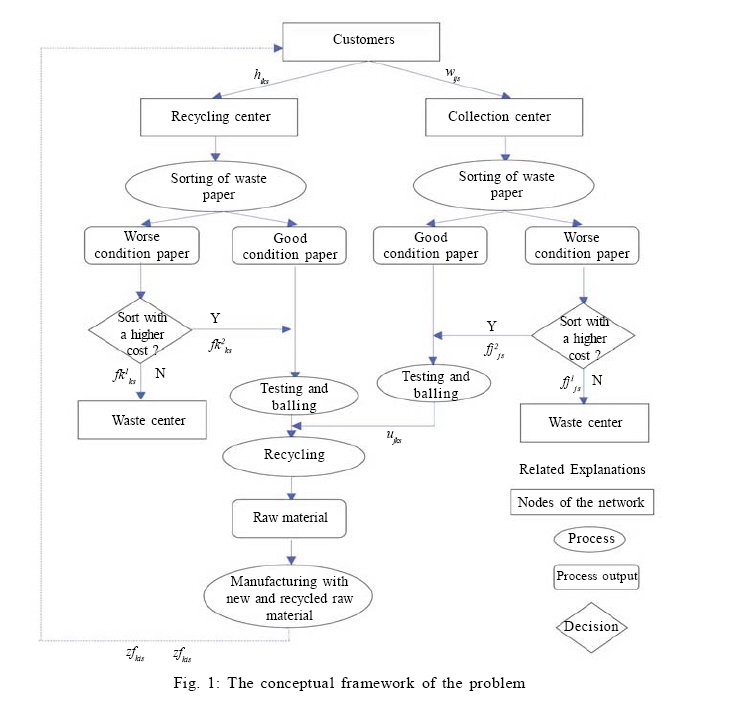
The first-stage decisions are represented by the vector x, while the second-stage decisions are represented by the vector y or y(ω) or even y (ω, x) and ζ(ω) is the random event. The sequence of events and decisions is thus summarized as x→ ζ(ω)→ y (ω, x). The definitions of the first and the second stages are only related to before and after the random experiment and may in fact contain sequences of decisions and events. The general model is as follows (Birge and Louveaux , 1997): min z = cT x + E ζ [min q(ω)T y(w)] (1)(1) s.t Ax = b (2) T(ω)x +Wy(ω) = h(ω ) (3) x ≥ 0, y(ω) ≥ 0 (4) Case study As a real world case study, paper recycling network problem is proposed to verify the model. This case study is a proposal for a newly installing firm which has an objective to recyle 280,000 tons of waste paper. One ton waste paper recycling prevents; cutting 17 big trees, using 4100 kw/h energy, spending 25,900 lt water and leaving 30 kilos hazardous gas into the air. Besides waste paper is the easiest reusable material in packing materials. Waste paper can be recycled between one to twelve times. Network design models try to determine suitable facilities, the optimal locations and capacities of facilities and flow of amounts between nodes of network considering cost factor. This study considers the design of single-product, two-echelon, capacitated reverse network. Network characteristics Two types of facilities are considered in the study: 1) Collection center: Collected waste paper is transferred from customers to collection centers. Mixed waste paper is sorted, pressed and baled. In the sorting process some products in bad condition are sorted in a longer time. For these kinds of products, the model decides to send them to waste center or to sort them in a longer time. 2) Recycling center: Some waste paper which is not sent to a collection center is directly transferred to recycling center. Same processes are carried out for sorting process. In the sorting process some products in bad condition are sorted in a longer time. For these kinds of products the model decides to send them to waste center or to sort them in a longer time. In this way, raw material is gained after recycling process. Also new raw materials are used to manufacture new products to satisfy customers' demand. Hence, in recycling center; manufacturing, recycling and sorting processes can be put into practice; on the other hand, in collection center only sorting process can be put into practice. Each collection center and recycling center can be supplied by more than one node. Also there are existing sites in the model. Customers and waste center are the existing sites in the network. Customers are grouped in zones. Each customer zone has a demand that must be satisfied. Moreover, used waste paper is collected from customers for recycling. There are two strategies for recycling of used products: The first one is regional strategy. The idea is to transport collected waste paper to collection center. In sorting activity, better conditioned products are transported to recycling center, while products in bad condition are evaluated according to the cost factor. Some of them are sorted in a longer time and then transported to recycling center or to waste center. The second one is central strategy. The idea is to directly transport used products to recycling center and to do all the same sorting and recycling activities in this center. Both two strategies are integrated in the model. A customer may be served by more than one collection center and recycling center. Demand and the number of reused products that can be collected from customers are assumed as uncertain. Therefore, in the stochastic model these two parameters are represented by scenarios. The following assumptions are accepted in the model:
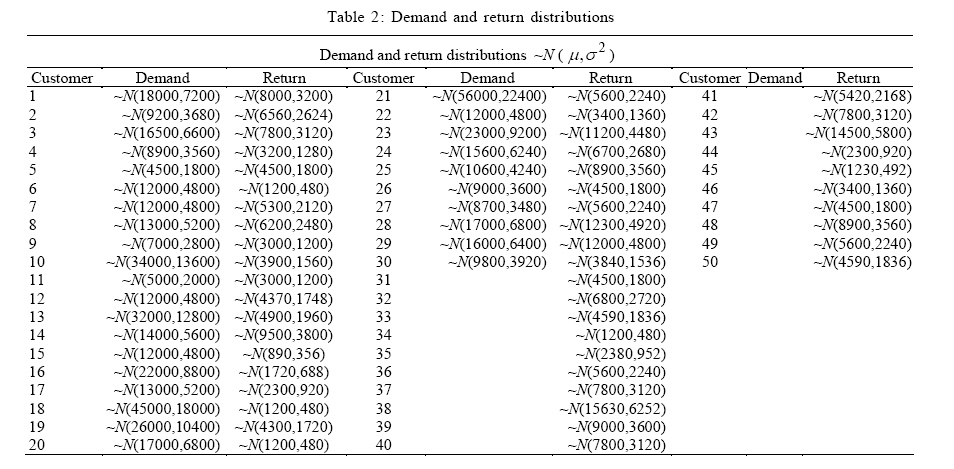
50 customers are involved in the problem and 17 collection centers and 17 recycling centers are evaluated for selection. Model is designed for single product. The conceptual framework of the problem addressed in this study is depicted in Fig. 1. A feature of network design problem is that the network must be able to meet the amount of products coming from customers. However, it is difficult to predict the amount of collected products. This is generally uncertain. Likewise customer demand is generally uncertain. It is appropriate to disclose uncertainty by expressing it with scenarios. Forty scenarios are generated for demand and the amount of products that can be collected from customers individually. These parameters are assumed to fit to normal distribution. Last year's data is obtained and assumed as mean values for normal distribution. 2.5 % of mean values is used as variance. Table 2 summarizes these parameters' distributions in scenarios. Forty random numbers are generated and forty scenario values for these two parameters are calculated. Also all scenario probabilities are assumed as same in order not to emphasize any of the scenarios. In two-stage stochastic programming, as mentioned in the second
section, decisions can be made before and after uncertainty is disclosed. The
problem is how to efficiently locate collection centers and recycling center
and how to allocate flows to gain maximum revenue under uncertainty. In this
study, the first stage decisions correspond to the location decisions that
must be made for opening facilities before the values of the random parameters
become known and the second stage decisions correspond to the flow amount decisions
through the established network after the values of the random parameters become
known. Consequently, the location variables x are assigned as the first
stage variables and the allocation variables y are assigned as the second
stage variables. In this way, value of x is fixed in the first stage,
the second stage decisions depend on scenarios and hence variables y change
under different realizations of First phase is the preliminary research phase. In this phase, the related problem is defined, studies in literature are investigated and expert arguments are taken. In the second phase, parameters, variables, costs, constraints are determined and the model is solved. In the last phase model's results are obtained and if results are not valid, essential corrections are done. Eventually, results are represented. The notation can be represented as follows:
Sets i = Customer
j = Collection center j =1,2.....,p Parameters ais = The number of products that can
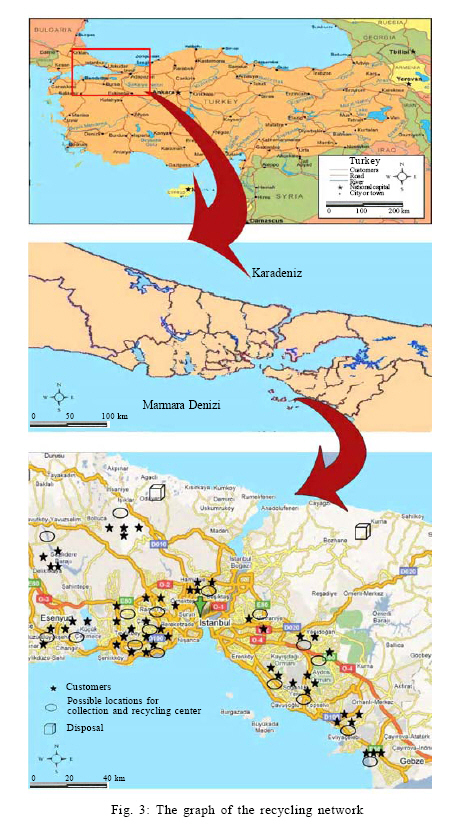
be collected from customer i in scenario s Variables xj = 1 if collection center j is opened 0 otherwise According to the model parameters, related data is obtained from a waste paper recycling company. For that reason, a detailed survey is conducted through the distribution of a comprehensive questionnaire for the managers and the related authorities in the company. Furthermore a large number of face-to-face interviews were held to develop solid information on the possible alternatives. During the interviews 17 possible locations are determined for recycling and collection centers in Istanbul, Turkey. The study is applied in 2009. Fig. 3 shows possible locations and customers. Also there are two waste centers in Istanbul which are in Eyup and Sile. Stochastic model formulation for reverse logistics network design The problem can be formulated as follows:
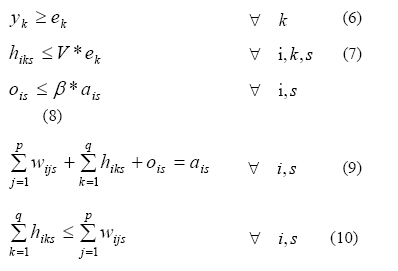
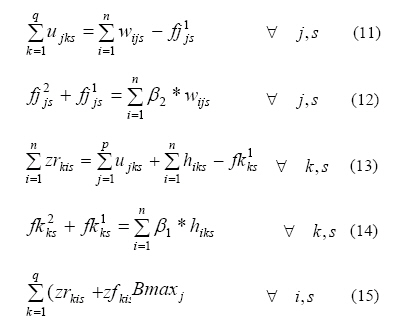
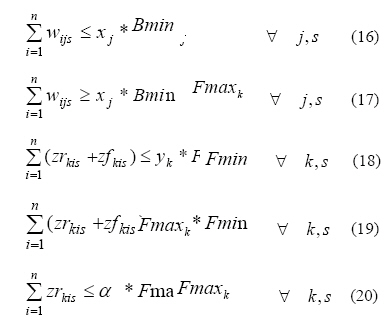
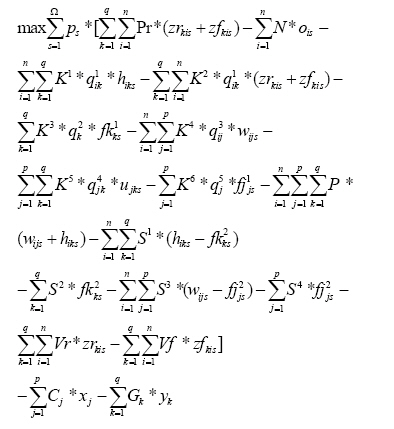
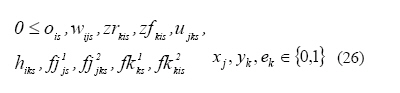
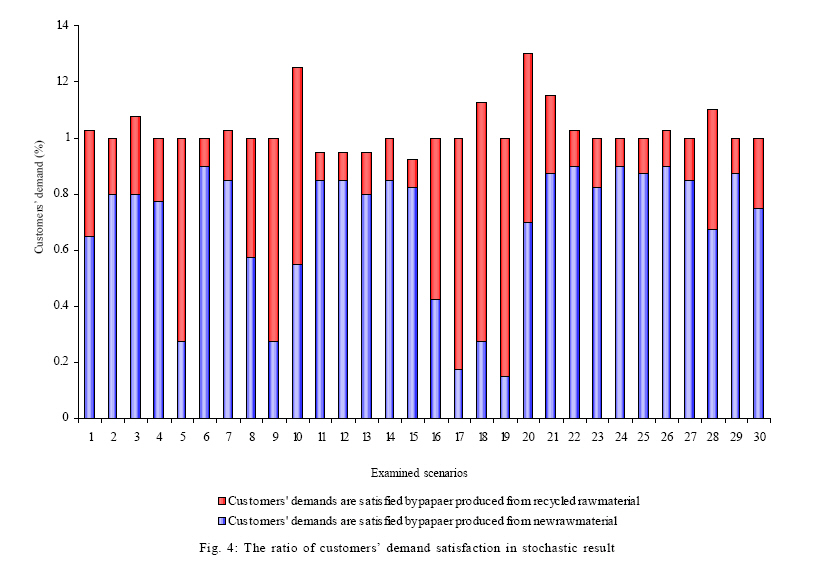
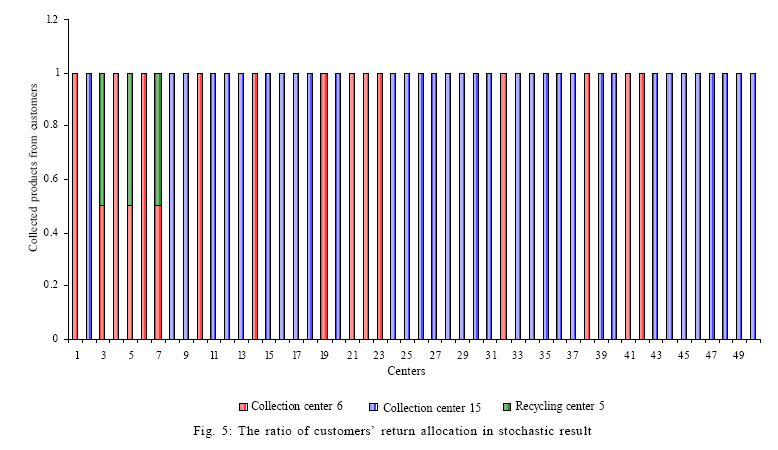
The objective function tries to maximize the profit consisting of revenue from products minus overall costs. The first term is revenue, the second term is penalty cost for not collecting products from customers, the third, the fourth, the fifth, the sixth, the seventh and the eighth terms are the transportation costs from customers to recycling center, from recycling center to customers, from recycling center to waste center, from customers to collection center, from collection center to recycling center, from collection center to waste center, respectively. The ninth term is the collection cost from customer, the tenth and the eleventh terms are sorting costs in recycling center, the twelfth and the thirteen terms are the sorting costs in collection center, the fourteenth and the fifteenth terms are the processing costs and the last two terms are the installation costs for collection center and recycling center, respectively. Constraint (6) guarantees that sorting capability can only be assigned to recycling center which is opened. Constraint (7) ensures that all collected products have to be sorted in recycling center. Constraint (8) limits the amount of uncollected products. Constraint (9) is flow conservation constraint. Constraint (10) ensures that the amount of products that are transferred to collection center are greater than the amount of products that are transferred to recycling center. Constraint (11) ensures that the outgoing flow of products can not exceed the incoming flow in collection center. Constraint (12) guarantees that all products in bad condition in collection center are transferred to waste center or are sorted with a higher cost. Constraint (13) is mass balance constraint in recycling center. Constraint (14) guarantees that all products in bad condition in recycling center are transferred to landfill or are sorted with a higher cost. Constraint (15) is demand satisfaction constraint. Constraints (16) and (17) are the maximum and minimum capacity limitations for collection centers and constraints (18) and (19) are the maximum and minimum capacity limitations for recycling center, respectively. Constraint (20) assigns a portion of capacity for products which are produced from recycled raw materials and constraint (21) assigns a portion of capacity for products which are produced from new raw materials. Constraints (22) and (23) ensure maximum and minimum numbers for opening collection center and constraints (24) and (25) ensure maximum and minimum numbers for opening recycling center, respectively. Constraint (26) specifies the integrality of the location variables and non-negativity for flow variables. RESULTS AND DISCUSSION Both deterministic and stochastic models are solved in Windows XP Centrino 1.66 GHz and 512 MB of memory. All models are mixed-integer programming models and solved by commercial software GAMS 21.6/CPLEX 6.0. The objective functions, CPU times, number of continuous and integer variables, iterations and constraints are summarized in Table 3. The deterministic value which is mentioned here is the mean value of forty deterministic models which use the values of every scenario. As can be seen from the Table 3, the mean objective value of forty deterministic models is higher than the stochastic model's objective value. Also when this stochastic objective value is compared with forty deterministic models' objective values, it has still lower objective value than the most of these forty objective values. This lower objective value is because of selecting the optimal and economical locations for recycling and collection center. Therefore, it can be concluded that the stochastic model's results propose more economical and compromised solution. In the stochastic model's result, the fifth location is chosen for the recycling center and the sixth and the fifteenth locations are chosen for the collection center. These choices are meaningful because the sixth location is situated in the Anatolian side of Istanbul and the fifteenth location is situated in the European side of Istanbul. Also the sixth and the fifteenth locations are nearer to the industrial zones, this will cause an decrease in transportation cost and response time. Another good aspect of being close to industrial zones is that these places are far from residential area. This will eliminate bad social effects. Hence, optimal locations are chosen for collection centers. These results reflect that all customers that are located in Anatolian and European sides can be served completely. Besides, compared to the other locations all the selected locations (mostly the fifth) are located in an area where high level of industrial population exists. It is found in the stochastic model's results that all customers' demands are satisfied by the new product produced from both new and recycled raw material in all scenarios as shown in Fig. 4. The graphic shows in what percentage of the examined scenarios the customers' demands are satisfied by products which are produced using new or recycled raw materials. For example in 65 % of the scenarios, customer 1's demand is satisfied by products produced using recycled raw materials while in 38 % customer 1's demand is satisfied by products produced using new raw materials. Thereby; in 3 % of the scenarios, customer 1's demand is satisfied by products produced using both new and recycled raw materials. On the other hand; in 80 % of the scenarios, customer 2's demand is satisfied by products produced using recycled raw materials while in 20 %, customer 2's demand is satisfied by products produced using new raw materials. Hence, some customers are served by products produced using either new or recycled raw materials but some customers are served by products produced using both new and recycled raw materials. As can be seen from the graph, ten customers have their demands satisfied with products produced using both new and recycled raw materials while twenty of them have their demands satisfied with products produced using either new or recycled raw materials. Another investigation is done for allocation of the collected products from customers. This is explained in Fig. 5. The graphic reveals the fraction of the collected products from customers that is served by each center. For example, the collected products from customer 1 is totally brought to collection center 6, while the collected products from customer 2 is totally brought to collection center 15 whereas half of the collected products from customer 3 is brought to collection center 6 and half of its products is directly brought to recycling center 5. Thus, some of the collected products from customers are brought only to collection centers but others are brought to both collection centers and recycling center. As can be seen from the graph the collected products from only three customers are brought to both collection centers and recycling center. All results indicate that the two-stage stochastic model is suitable for recycling network design. CONCLUSION Some activities of the reverse supply chain, like the recycling of the products, have been put into practice for years, hence the existing growth in utilization exhibits efficient results. These are; reducing resources, waste and environmental pollution. These efficient results motivate producers to pay attention to these issues. Combined with economical benefits, reverse supply chain activity is the best strategy for producers. The design of supply chain networks is a difficult task because of the complexity. Moreover in reverse logistics the decisions are harder to make than traditional supply chains. The location/allocation decisions play an important role in the success of design of infrastructure of the network. Uncertainty is one of the characteristics of the real world. The methods that cope with uncertainty help researchers get realistic results. Stochastic programming is a sufficient approach in dealing with uncertainty. In the real world, factors are not always certain, however in deterministic programming, factors are assumed as certain. But stochastic programming is a programming method that deals with uncertainty. In this paper, as a real world case study of paper recycling, a reverse supply chain network design problem is presented under uncertainty. The model takes into account a number of alternative scenarios for demand and the amount of products that can be collected from customers. These solutions are progressively less sensitive to realizations of the data in a scenario set. The objective of this study is to analyze stochastic programming techniques for reverse supply network design problems. Compared with the deterministic model, stochastic model can corporate uncertain information. This study is suitable for recycling/ manufacturing systems in reverse supply chain. The model includes some constraints that exist in the literature but additional ones are proposed which are not related to previous models. Also different variables are included in the model. This model can be extended in different aspects in order to deal with complex decisional issues more accurately. For further research a more detailed model can be presented. Also the number of alternatives and scenarios can be increased. Lastly, heuristics and decomposition methods can be combined with the method to decrease running times. ACKNOWLEDGMENTS The author is partially supported by the TUBITAK-Turkish Scientific and Technologic Research Association and wish to thank its financial support. REFERENCES
© IRSEN, CEERS, IAU The following images related to this document are available:Photo images[st10071t2.jpg] [st10071f1.jpg] [st10071f5.jpg] [st10071t3.jpg] [st10071f2.jpg] [st10071f4.jpg] [st10071t1.jpg] [st10071f3.jpg] |
| |||||||||

