 |
| About Bioline | All Journals | Testimonials | Membership | News |
|
||||||
|
||||||
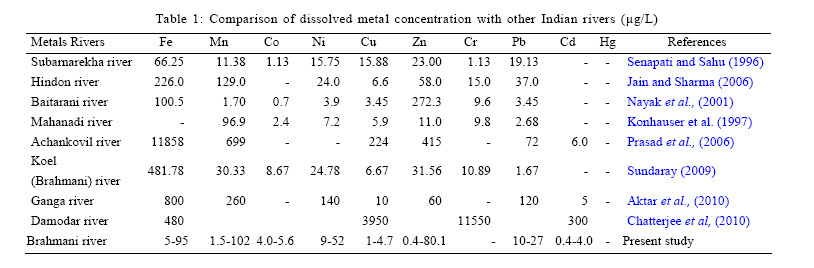
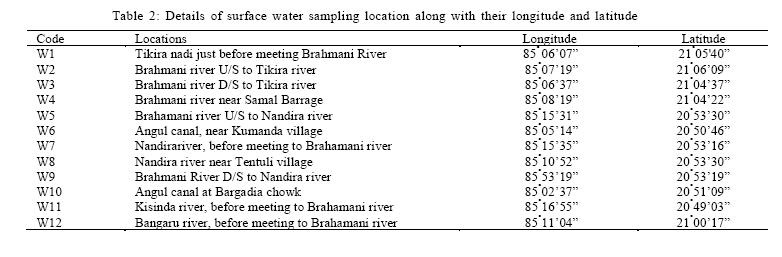
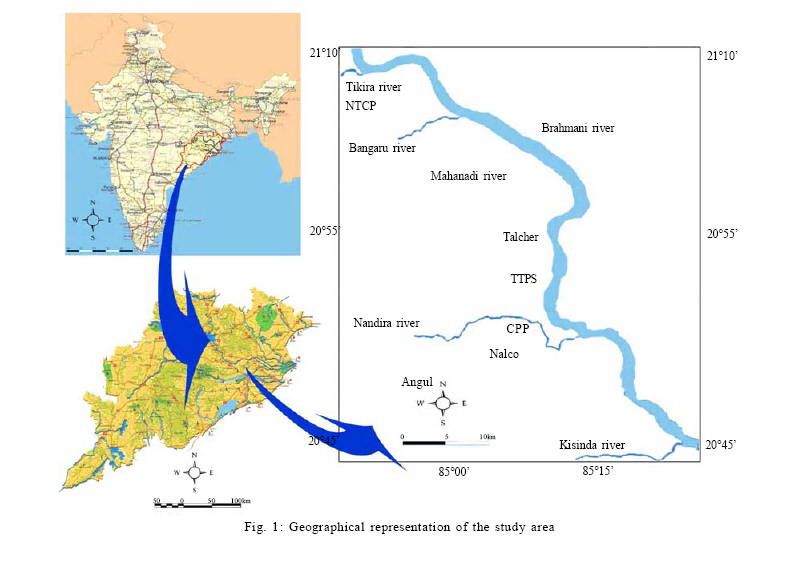
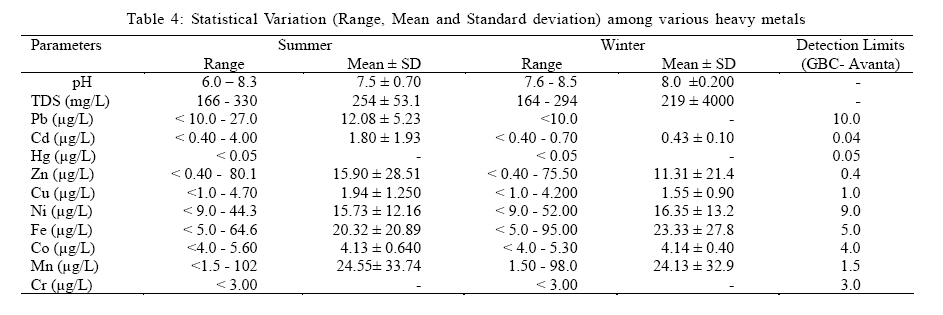
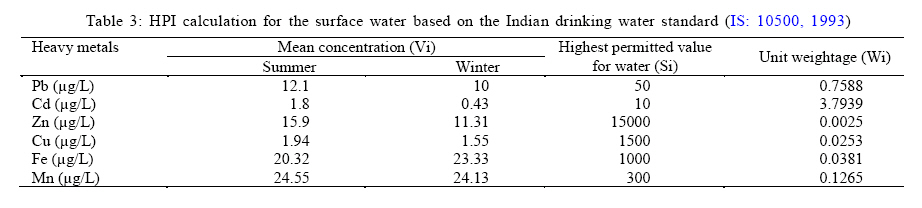
International Journal of Environment Science and Technology, Vol. 7, No. 4, 2010, pp. 785-792 Heavy metal contamination and its indexing approach for river water *R. Reza; G. Singh Department of Environmental Science and Engineering, Indian School of Mines, Dhanbad-826004, Jharkhand, India *Corresponding Author Email: raza_ism@rediffmail.com Tel./Fax: +91326 2296 624 Received 10 May 2010; revised 13 June 2010; accepted 2 August 2010 Code Number: st10077 ABSTRACT: The objective of the study is to reveal the seasonal variations in the river water quality with respect to heavy metals contamination. To get the extend of trace metals contamination, water samples were collected from twelve different locations along the course of the river and its tributaries on summer and the winter seasons. The concentrations of trace metals such as cadmium, cromium, copper, cobalt, iron, manganese, nickel, lead, mercury and zinc were determined using atomic absorption spectrophotometer. Most of the samples were found within limit of Indian drinking water standard (IS: 10500). The data generated were used to calculate the heavy metal pollution index of river water. The mean values of HPI were 36.19 in summer and 32.37 for winter seasons and these values are well below the critical index limit of 100 because of the sufficient flow in river system. Mercury and chromium could not be traced in any of the samples in the study area. Keywords: Heavy metal pollution index; Industrial pollution; Seasonal variation INTRODUCTION Rapid urbanization and industrial development during last decade have provoked some serious concerns for the environment. Heavy metals contamination in river is one of the major quality issues in many fast growing cities, because maintenance of water quality and sanitation infrastructure did not increased along with population and urbanization growth especially for the developing countries (Sundaray et al., 2006; Karbassi et al., 2007; Akoto et al., 2008; Ahmad et al., 2010). Trace metals enter in river from variety of sources; it be can be either natural or anthropogenic (Bem et al., 2003; Wong et al., 2003; Adaikpoh et al., 2005; Akoto et al., 2008). Usually in unaffected environments, the concentration of most of the metals is very low and is mostly derived from the mineralogy and the weathering (Karbassi et al., 2008). Main anthropogenic sources of heavy metal contamination are mining, disposal of untreated and partially treated effluents contain toxic metals, as well as metal chelates from different industries and indiscriminate use of heavy metal-containing fertilizer and pesticides in agricultural fields (Hatje et al., 1998; Amman et al., 2002; Nouri et al., 2006; Nouri et al., 2008). Metals enter into river water from mining areas through various ways such as mine discharge, run-off, chemical weathering of rocks and soils, wet and dry fallout of atmospheric particulate matter (Macklin et al., 2003; Bird et al., 2003; Kraft et al., 2006; Singh et al., 2008;Venugopal et al., 2009). The mine water, run-off from abandoned watersheds and associated industrial discharges are the major source of heavy metal contamination, total dossolved solid (TDS) and low pH of streams in mining area (USEPA, 1997; Mohanty et al., 2001; Cravotta, 2008; Shahtaheri et al., 2008). Rivers in urban areas have also been associated with water quality problems because of the practice of discharging of untreated domestic and small scale industries into the water bodies which leads to the increase in the level of metals concentration in river water (Rim-Rekeh et al., 2006; Khadse et al., 2008; Juang et al., 2009; Venugopal et al., 2009; Sekabira et al., 2010). Trace metal contaminations are important due to their potential toxicity for the environment and human beings (Gueu et al., 2007; Lee et al., 2007; Adams et al., 2008; Vinodhini and Narayanan, 2008). Some of the metals like Cu, Fe, Mn, Ni and Zn are essential as micronutrients for the life processes in animals and plants while many other metals such as Cd, Cr, Pb and Co have no known physiological activities (Kar et al., 2008; Suthar and Singh, 2008; Aktar et al., 2010). Metals are non-degradable and can accumulate in the human body system, causing damage to nervous system and internal organs (Lee et al., 2007; Lohani et al., 2008). However, the rivers play a major role in assimilation or transporting municipal and industrial wastewater and runoff from agricultural and mining land (Singh et al., 2004). The present study aimed to envisage the water quality status of River Brahmani and its tributaries with respect to its heavy metal concentrations in various seasons at Angul district of Orissa. The research work was carried during summer (May, 2008) and winter (January, 2009). Metal concentration in river water in various places of India is illustrated in Table 1. MATERIALS AND METHODS Study area The study area (Angul-Talcher region) is bounded by latitudes 20° 37' N to 21° 10' N and longitudes 84° 53' E to 85° 28' E and situated at an average height of 139 m above mean sea level. The river catchment is characterized by Precambrian granites, gneisses and schists of Eastern Ghats with local intrusive and volcanic lithologies; lime stone, sand stone and shales of the Gondwanas (Sene-Johansen, 1995; Panda et al., 2006; Sundaray et al., 2006). The area comes under sub tropic monsoon climate with an average annual rainfall of 1370 mm. The temperature varies from 11.9° C to 44.4° C (Sundaray et al., 2006). At present, it accommodates several large and medium scale industries such as Nalco Smelter and its Captive Power Plant (CPP-960MW), Talcher Super Thermal Power Station, NTPC (TSTPS-3000MW), Talcher Thermal Power Station (TTP-460MW), Iron and Steel industries and various coal mines. The drainage pattern is controlled by the River Brahmani along with its tributaries. River Brahmini play as a major source of water, as well as sink for effluent for the existing industries. These industrial activities affect various components of ecology and the environment and impart heavy metal contamination in the river water. Field sampling In order to achieve the research objective, samples were collected from twelve different locations of Brahmani River along with its tributaries in Angul-Talcher Region to evaluate the heavy metal contamination during various seasons (summer and winter) (Table 2). Criteria for selection of sampling station were based on the locations of industrial units and land use pattern to quantify heavy metal concentration. Five sites were selected along the Brahmani River and seven sites were located along its main four tributaries, named as Tikira River, Bangaru River, Nandira River and Kisinda River (Fig. 1). The Samples were taken from 10 to 15 cm below the water surface using acid washed plastic container to avoid unpredictable changes in characteristic as per standard procedures (APHA, 1998). Samples were collected in May 2007 for summer season, and in January 2008 samples were collected for winter season. Care was taken to collect subsequent samples from same location in both the seasons. Laboratory methods Water samples were collected from all the respective sampling stations of Brahmani River. The collected samples were filtered (Whatman no. 42) and preserved with 6N of HNO3 for further analysis (APHA, 1998). Concentrations of heavy metals in water samples were determined with an atomic absorption spectro-photometer (GCB-Avanta) with a specific lamp for particular metal. Average values of three replicates were taken for each determination. Appropriate drift blank was taken before the analysis of samples. The working wave length for the heavy metals are 248.3 nm for Fe, 279.5 nm for Mn, 213.9 nm for Zn, 324.7 nm for Cu, 232 nm for Ni, 228.8 nm for Cd, 357.9 nm for Cr, 217 nm for Pb, 240.7nm for Co and 253.7nm for Hg. Indexing approach Heavy metal pollution index (HPI) is a method of rating that shows the composite influence of individual heavy metal on the overall quality of water. The rating is a value between zero and one, reflecting the relative importance individual quality considerations and defined as inversely proposal to the recommended standard (Si) for each parameters. Water quality and its suitability for drinking purpose can be examined by determining its quality index (Mohan et al., 1996; Prasad and Kumari, 2008; Prasad and Mondal, 2008). The calculation involves the following steps First, the calculation of weightage of ith parameter; Second, the calculation of the quality rating for each of the heavy metal; Third, the summation of these sub-indices in the overall index. The weightage of ith parameter is: Wi = k/Si (1) Where, Wi is the unit weightage and Si the recommended standard for ith parameter (i = 1-6), k is the constant of proportionality. Individual quality rating is given by the expression Qi = 100Vi /Si Where, Qi is the sub index of ith parameter, Vi is the monitored value of the ith parameter in µg/L and Si the standard or permissible limit for the ith parameter. The heavy metal index is then calculated as follows: HPI =∑ni=1 (QiWi )/ ∑ni=1W (3) Where, Qi is the sub index of ith parameter. Wi is the unit weightage for ith parameter, n is the number of parameters considered. Generally, the critical pollution index value is 100. RESULTS AND DISCUSSION The results revealed that in most of the sampling stations, water was slightly alkaline except at very few stations in the upper course of the River where the water was found to be slightly acidic. The range of pH was 7.6-8.5 during the winter, while in summer it was slightly acidic to alkaline (6.0-8.3). The above values usually indicate the presence of carbonates of calcium and magnesium in water (Begum et al., 2009). High pH of the River water may result in the reduction of heavy metal toxicity (Aktar et al., 2010). In the case of Total dissolved solids (TDS), there was a considerable amount of dissolved ions in all the sampling locations. Higher concentration of TDS was observed in the River water near the middle part of the River Basin. It was in the range of 166-330 mg/L and 164-294 mg/L in summer and winter seasons, respectively. Various large and small industries are concentrated in these areas. The effluents from these industries are directed into the River course which increases the concentration of TDS in the water body (Phiri et al., 2005; Rim Rukeh et al., 2006). The concentration ranges, mean and standard deviation of individual metals are illustrated shown in Table 4. The maximum Fe concentrations were found 64.6 and 95.0 µg/L in summer and winter season respectively. It may be assigned to the soil-water interaction especially within the middle and lower part of the River stretch during winter season. Lead was found in winter season while in summer it was below the detection limit. It may be due to the less soluble of Pb containing minerals in natural water (Venugopal et al., 2009a; b). The maximum lead concentration in River water were observed as 27.0 µg/L) during summer season (Neal et al., 2000). The low values of Cu indicate there is no significant source of pollution. The maximum Cu was found 4.7µg/L and 4.2µg/L in respective seasons. It may be attributed to domestic sewage and run-off from extensive farmed areas (Wu et al., 2008). The relatively higher concentrations of zinc in some of the sampling stations were 80.1µg/L and 75.5µg/L during summer and winter season, respectively. It is attributed to the presence of unused remains of zinc sulphate in fertilizers (Wu et al., 2008). Highest value of Co was found (5.6µg/L) in summer season, it may be due to effluent from metal alloys industries (Brian and Bishop, 2009). The major source of Cd is the coal combustion, metal industry and waste incineration (Brian and Bishop, 2009). The maximum concentration Cd in the area was 4.0 µg/L in summer season. It may be due to coal- combustion which is very frequent in industries (Thermal Power Station) and domestic purpose. The maximum value of Ni was 52 µg/L in winter while Mn was 102 µg/L during summer season. The concentration of Hg and Cr could not be detected in any of the samples. Most of the dissolved heavy metals showed slightly high concentrations during the summer period than that of the winter season. These kinds of pattern indicate the accumulation of the metal concentration during low flow condition of River. It may be attributed to high evaporation rate of surface water followed by elevated temperature (Abdel-Satar, 2001). Few metals such as Fe and Ni were high during winter, it may be due to the effect of rain (Phiri et al., 2005). The previous studies has been ensure that the atmospheric precipitation is very much responsible for metal contamination in surface water (Wong et al., 2003; Wu et al., 2008; Pandey et al., 2009). Statistical tests showed that the metal concentrations were significantly different between sampling stations. It was also observed that for all (ten) metals studied; there was a trend of increasing concentrations from the upstream stations to the downstream stations. In order to calculate the HPI of the water, the mean concentration value of the selected metals (Pb, Cd, Zn, Cu, Fe, Mn) have been taken into account (Prasad and Mondal, 2008). Table 3 details the calculations of HPI with unit weightage (Wi) and standard permissible value (Si) as obtained in the presented study. The mean of heavy metal pollution index values are 36.19 and 32.37 in summer and winter season, respectively, while the maximum value of HPI was (66.15) found at sampling location (w11) in summer season. It may be attributed to domestic sewage. The critical pollution index value, above which the overall pollution level should be considered unacceptable, is 100 (Prasad and Kumari, 2008; Prasad and Mondal, 2008). This indicates the water is not critically polluted with respect to heavy metals. CONCLUSION The present study reveals that most of the water samples of River system at Angul were found less polluted in heavy metal contamination profile and shows a trend in seasonal variation. Very few samples evidenced the slightly significant metal concentration in water samples in the middle of the River catchment during summer season. It is attributed to the concentration of various mines and associated industries along with the River course. The HPI is very useful tool in evaluating over all pollution of water bodies with respect to heavy metals (Prasad and Kumari, 2008). The HPI values of the present study indicate that the water samples from the River are not critically contaminated with respect to heavy metals. It is due to presence of enough flow rate of River water, the metal concentration from mine water and other industrial effluents has been diluted rapidly with respect to a very small distance. More over metal pollution by mining and associated industrial activities is somewhat mitigated because of strict implementation of clean technology and environmental measures by industries. ACKNOWLEDGEMENTS The authors are thankful to State Pollution Control Board Orissa, for sponsoring this study. Authors are also grateful to professor T. Kumar, Director, ISM to providing research facilities. One of the authors (Rizwan Reza) is grateful to Indian School of Mines/MHRD/Government of India, for granting a great support. REFERENCES
© IRSEN, CEERS, IAU The following images related to this document are available:Photo images[st10077t2.jpg] [st10077t3.jpg] [st10077t1.jpg] [st10077t4.jpg] [st10077f1.jpg] |
| |||||||||
