 |
| About Bioline | All Journals | Testimonials | Membership | News |
|
||||||
|
||||||
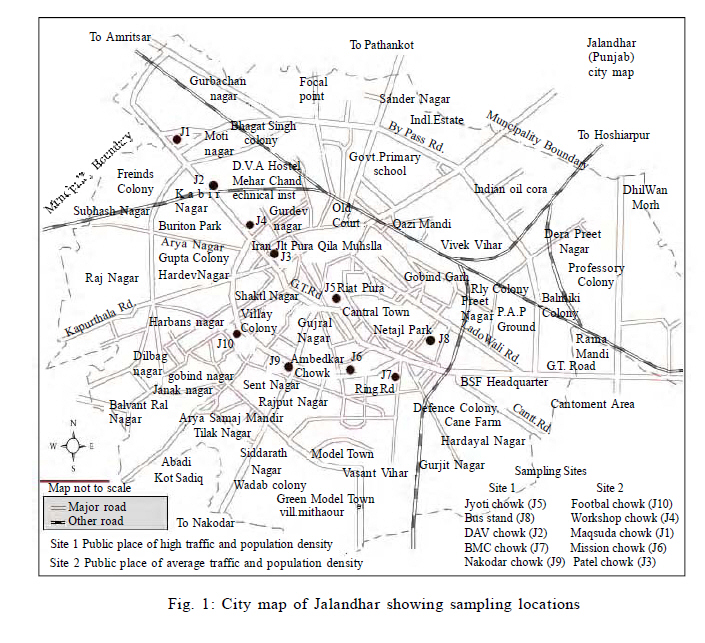
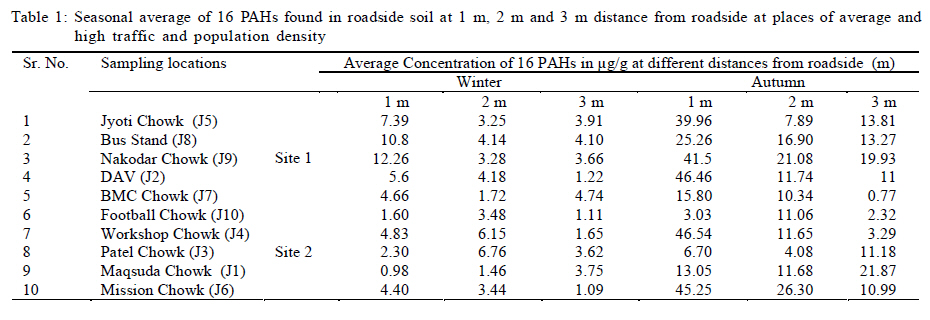
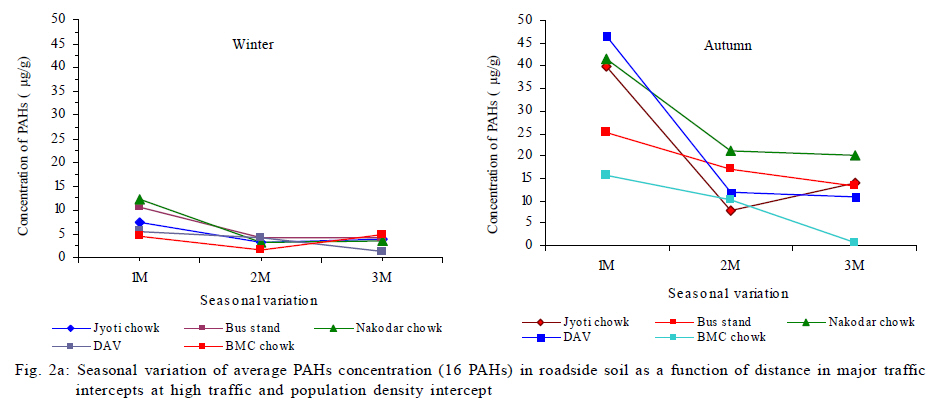
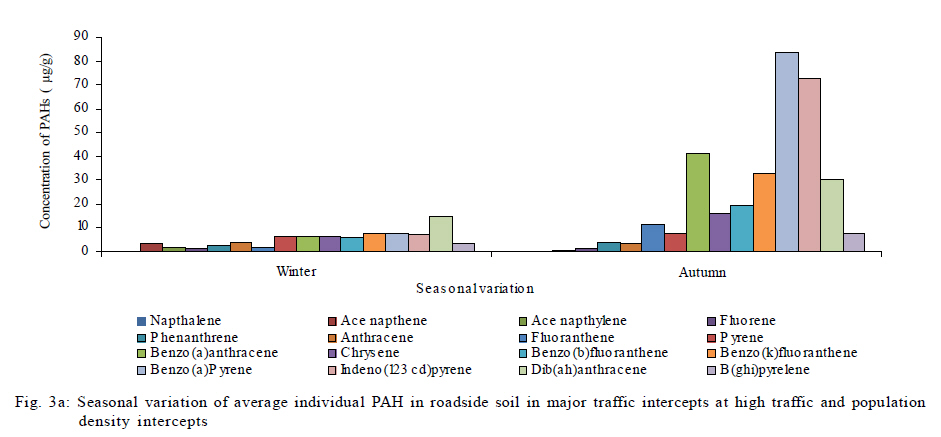
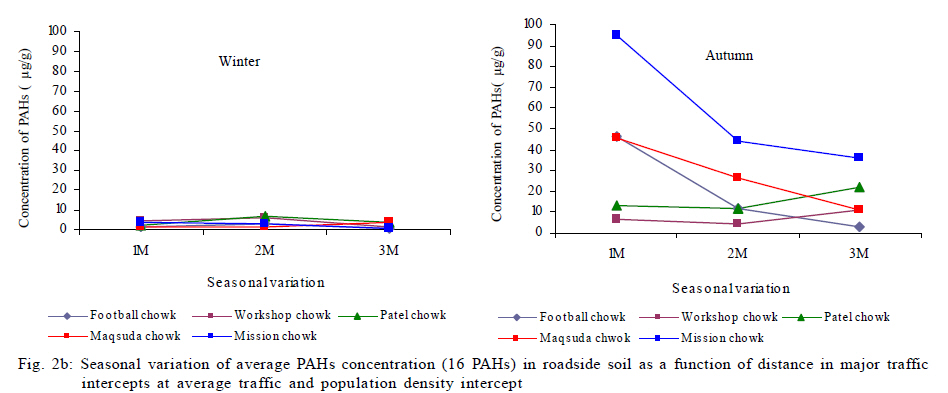
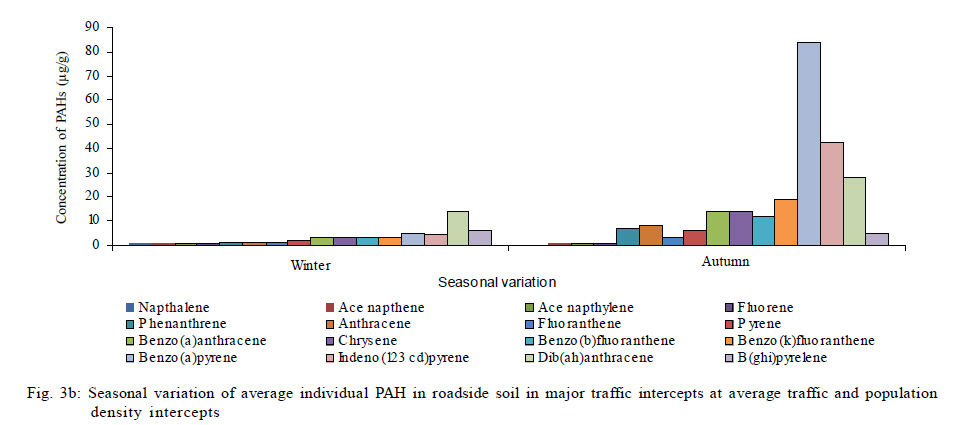
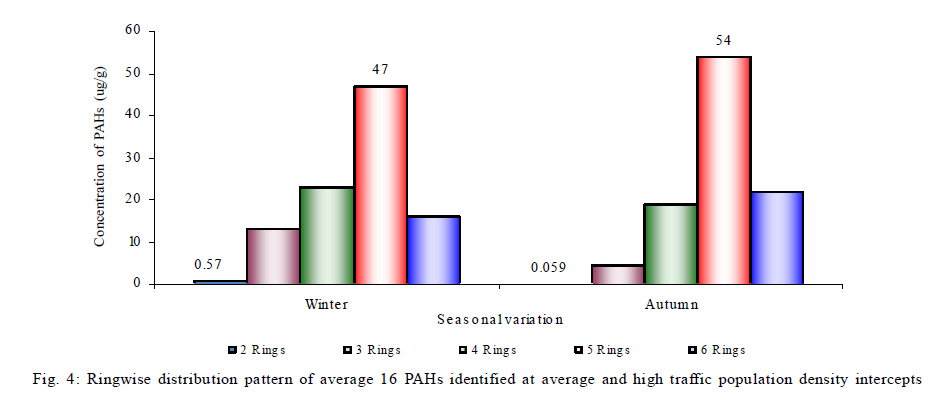
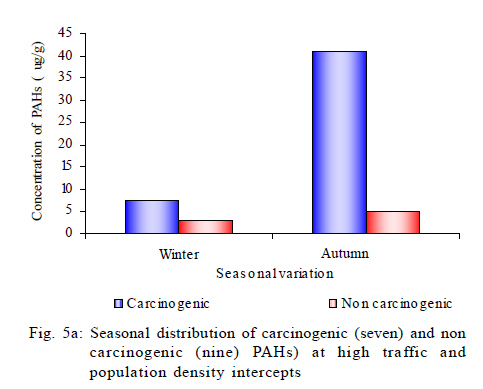
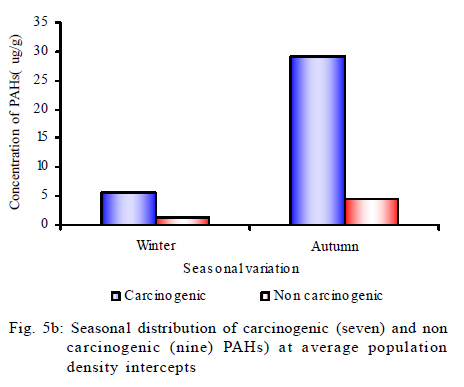
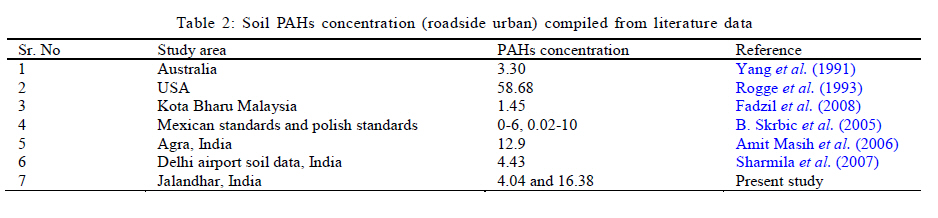
International Journal of Environment Science and Technology, Vol. 8, No. 1, 2010, pp. 63-72 Distribution behavior of polycyclic aromatic hydrocarbons in roadside soil at traffic intercepts within developing cities V. Kumar; *N. C. Kothiyal Department of Chemistry, Dr. B. R. Ambedkar National Institute of Technology, Jalandhar, Punjab, India *Corresponding Author Email: kothiyalnc@nitj.ac.in Tel.: +91-9417274496; Fax: 0181-2690301 Received 11 June 2010; revised 28 October 2010; accepted 19 November 2010; available online 1 December 2010 Code Number: st11006 ABSTRACT: A study of polycyclic aromatic hydrocarbons pollution in roadside soil was conducted in developing city environment of northern India during autumn and winter season to ascertain the contamination levels and their distribution behavior in soil. The concentration of polycyclic aromatic hydrocarbons was determined at ten locations of Jalandhar city, Punjab in India at 1, 2 and 3 m distances from roadside in soil covering all the major traffic intercepts within city. The samples were extracted in acetone and dichloromethane (1:1) using soxhlet extraction. The extracts were then filtered on a silica gel micro column to remove impurities and elute was subjected to GC-FID. The total average concentration (city average) was found to be 4.04 µg/g and 16.38 µg/g during winter and autumn respectively. DiBenzo (ah) Anthracene and Benzo (a) Pyrene were the individual polycyclic aromatic hydrocarbons found in highest concentration at all the intercepts ranging between 0.008 to 28.4 µg/g during winter and 0.01 to 252.55 µg/g during autumn. Average concentration of non-carcinogenic and carcinogenic polycyclic aromatic hydrocarbons during winter and autumn was found to be 2.1 and 6.4 and 4.74 and 35.08 µg/g respectively. The average ratio of non-carcinogenic and carcinogenic Polycyclic Aromatic Hydrocarbons was found to be 1:3 during winter, and 1:7.6 during autumn at most of the intercepts. Total carcinogenic polycyclic aromatic hydrocarbons concentration was found quite high (80 %) in comparison to non-carcinogenic polycyclic aromatic hydrocarbons (20 %) at most of the intercepts. Keywords: Gas chromatography; Season; Traffic density; Pollutants; Samples INTRODUCTION Environmental analyses often involve wide variety of matrices, ranging from air to sewage water to polluted soil samples (Khan et al., 2005; Igwe et al., 2008; Shah et al., 2009). Motor vehicles are thought to be the major source of atmospheric polycyclic aromatic hydrocarbons (PAHs). PAHs occur in particles (Bodzek et al., 1993) or in the vapour phase and are often emitted into the atmosphere (Fromme et al., 1998; Nielsen et al.,1996). Some of these compounds e.g. Benzo (a) Pyrene have been classified as carcinogenic and mutagenic materials (Dipple et al., 1999; Wei et al., 1996). PAHs compounds are extracted from the filter with a solvent and analyzed by high performance liquid chromatography with a fluorescence detector or gas chromatography with a flame ionization detector, or gas chromatography-mass spectrometry (Hansen et al., 1991; Dabek-Zlotorzynska et al., 1996, Marvin et al., 1999; Soltanali and Shams Hagani, 2008). GC/MS was used to detect and quantify PAHs because it is more selective (Soltanali and Shams Hagani, 2008), while GC-FID is used for PAHs and Polychlorinated biphenyls due to its higher sensitivity. Automobile is an extremely important segment of modern human society. The impact of automobile emissions on environment, predominantly on soil, air and water is increasing day by day. Automobile emissions have shown a tremendous impact on the environment during the past few years (Kumata et al., 2000). One of the toxic contaminants found in roadside soil and dust includes PAHs. Literature review shows the existences of a large number of PAHs in the environment some of which are known potential carcinogens and mutagens (Neilson, 1998). However, the persistence of PAHs is lower than that of heavy metals (Nwuche and Ugoji, 2008 and 2010). Some studies have reported the major origin of PAHs in road dust as exhaust gases from automobile (Takada et al., 1990). Degradation rate of PAHs adsorbed into sediments or soil is very slow and depends upon several factors. Slow degradation of such chemicals pose a potential risk to human being coming in contact with contaminated soil. Other sources of PAHs in environment include lubricating oils, atmospheric depositions, power plants, domestic heating systems, petrol and diesel engines and various industrial activities (Mastral et al., 1996; Lee et al., 1998; Khanfekr et al.,2009; Arulazhagan et al.,2010; Fagbote and Olanipekun, 2010). Concentrations of PAHs in soil were assumed to be influenced by traffic density, road condition, traffic behavior, meteorological condition, particulate matter in environment and their rates of deposition (Edwards, 1989; Jones et al., 1989). PAHs concentration in road soil was found to vary according to distance from the source of origin. Once such PAHs seep into the soil, they got accumulated in horizons rich in organic matter, where they are likely to be retained for many years due to their persistence, hydrophobicity and slow degradation (Krauss et al., 2000). PAHs have been documented to cause several health problems (Zhang et al., 2009). Some PAHs and their derivations are highly toxic in nature (Okafor and Opuene, 2007; Juang et al., 2009). Reduction of industrial emissions of volatile organic compounds (VOCs) is a part of a global strategy to reduce pollution (Granström and Månsso, 2008; Jafari and Ebrahimi, 2007). Literature survey shows a limited soil PAHs contamination in any fast growing city of India where two, three and four wheelers (i.e. cars, trucks and buses) with varying oldness ranging from 1 to 20 years ply on the same roads within the city. Lack of proper maintenance, poor planning, socio economic conditions and slow pace of infrastructure development has aggravated the problem further. Smaller vehicles (two three and four wheelers) which run mainly on petrol and diesel fuels have contributed a lot to PAHs in city atmosphere (air and soil). PAHs have drawn considerable attention of the widespread scientific community due to their carcinogenic and mutagenic nature (Yang et al., 1991). It is important to understand types and distribution behavior of PAHs in soil and how their concentration in soil varies significantly with season and correlate it with the corresponding levels in air (Nam, et al., 2003). In India, especially in metropolitan cities, extensive literature shows the presence of PAHs mostly in ambient air, roadside dust and soil. The objective of the present study was to determine the concentration level, ratio of carcinogenic and non-carcinogenic PAHs and to understand their distribution behavior (16 potential carcinogenic PAHs identified EPA) during winter and autumn season in the roadside soil. Samples of the soil were taken at a distance of 1, 2 and 3 m from the road side at places of high/average traffic and population density within Jalandhar city, in the state of Punjab, India. Soil samples were taken during mid autumn (September 15, 2009) and winter (February 15, 2009). Ten sampling locations (both public and commercial places) were chosen on the basis of high traffic density, urban populations and geographical dispersion. The major road intercepts chosen as sampling sites were Maqsuda (J1) , DAV (J2), Patel (J3), Workshop (J4) , Jyoti (J5), Mission (J6), BMC (J7), Bus Stand (J8), Nakodar (J9) and Football (J10) chowks (intercepts) as shown in the Fig. 1. MATERIALS AND METHODS Sampling sites Punjab is one of the prosperous and fast developing states of India. Jalandhar, one of the major expanding cities within the state, is located at the center of Punjab between Beas and Sutlej rivers. The city, which has major rail and road connections, is a market for agricultural, textile, leather goods, wood products, hand tools and sport goods. Jalandhar is situated at 710o 31' East and 300o 33' North at a distance of 146 kms from state capital Chandigarh on Delhi-Amritsar national highway (grand trunk road). According to 2001 Census (provisional), the area of Jalandhar district was 3,401 sq. km and total population of the district was 1,953,508 persons. The city has shown tremendous growth in terms of population, infrastructure and traffic density during the past decade. The climate of this district is on the whole dry except during the brief south-west monsoon season (July to September). The average annual rainfall in the district is 703.0 mm. Based on population and traffic density, above ten locations were divided into places of high population and traffic density i.e. sites 1 (where traffic was high but slow during 9 am to 9 pm) and places of average traffic and population density, i.e. site 2 (places with normal traffic speed and average population density during 9 am to 9 pm). Fig.1 shows the road map of sampling sites and their location codes. Sampling period and Meteorological condition The samples were taken for a span of one year during autumn and winter seasons in the year 2009. A total of sixty samples were collected from ten major locations (J1 to J10). During autumn maximum, minimum temperature during the sampling period was 35°C and 3ºC and humidity was between 20% to 80%, while during winter the temperature was between 20° C and 1°C and humidity was 75 % to 30 % and the entire region had dense fog during the night and day. Sampling Technique Three soil samples were collected from each sampling location at a distance of 1, 2, and 3 m from different directions of the road (left and right side). Samples were collected by scooping 6 cm below the surface layer. The samples in bulk, collected sites, were stored in polyethylene bags and were brought to the laboratory. Stones, leaves, debris and other extraneous materials were sieved out before analysis. All the samples were dried in a hot air oven maintained at 40 to 60 °C for 24 hrs for the removal of free moisture. The samples were preserved in desiccators and stored in dark before extraction. Chemicals Analytical grade reagents, solvents and standards used in the study were procured from Merck Specialty Chemicals, Pvt. Ltd. Mumbai, India. PAH standards used in GC studies were procured from Dr Ehrenstorfer GmbH Chemicals, Merck, Germany. Glasswares All glasswares of Borosil make glass (A grade) were used in the study. Glasswares were dipped in dilute Nitric acid and washed with plain and double distilled water every time before use. Equipments PAHs present in the samples were analyzed on Nucon make microprocessor based Gas Chromatograph, (Model No 5765) using RH 5 capillary column (30 m length, 0.53 ID X 3.0 µm using FID detector). Rotavapor and soxhlet extraction apparatus were used for extraction of PAHs from the soil. Extraction of PAHs About 20 g of pre-dried soil samples were heated at 40 to 60 °C to remove any trace of moisture before extraction. Dried soil samples were transferred in soxhlet apparatus and extracted using acetone and dichloromethane (1:1 ratio) as solvents at the rate of 3 cycles per h for 8 h. The extract was allowed to cool and filtered through a whatman filter paper no. 41. The filtrate was concentrated to 1 mL volume using rotary evaporation at 60 °C under gentle vacuum. The samples prepared were preserved in amber colored sample tubes stored in refrigerator below 4ºC before analysis. Samples were later analyzed for types and concentration of PAHs by GC. RESULTS AND DISCUSSION The results of average concentration of PAHs determined in sixty soil samples during two seasons at different distances have been shown in Table 1. The ten sampling locations were divided into high/average population and traffic density areas and categorized as site 1 and site 2 (Table 1). In the present study 16 PAHs (EPA identified) were determined namely Nap, Napthalene; Ace Nap, Acenapthene; Ace Naph, Acenapthylene; Flu Fluorene; Phen, Phenanthrene; Anth, Anthracene; Flan, Fluoranthene; Pyr, Pyrene; B (a) A, Benzo (a) Anthracene; Chry, Chrysene; B (b) F, Benzo (b) Fluoranthene; B (k) F, Benzo (k) Fluoranthene; B (a) P, Benzo (a) Pyrene; IP, Indeno (123cd) Pyrene; Dib (ah) A, Di Benzo (ah) Anthracene ;B (ghi) P, Benzo (ghi) Pyrelene. Behavior of PAHs at places of high population and traffic density intercepts Types and concentration of PAHs at various intercepts were found to differ from place to place. Average concentration of 16 PAHs at a distance of 1 to 3 m were determined during two seasons and the results obtained have been shown in Table 1. Fig. 2a shows variation of average concentration with distance during two seasons. The results shown in Fig. 2a indicated that the average concentration of PAHs decrease with distance from roadside soil in most cases from 1 to 3 m in two seasons. The observed behaviour was perhaps due to close proximity of intercepts from roadside in the form of buildings, plants, shops in the areas of high population and traffic density. It has been interpreted from Table 1 that during autumn, the average highest concentration of 16 PAHs among five locations was 46.46 µg/g at a distance of 1 m from the roadside at the location J2. The observed value was perhaps highest in roadside soil, among any metro or fast developing city within India or in other cities of the world. Pyr and IP were two individual PAH (among 16 PAHs) found in highest concentration i.e. 28.4 and 250.64 µg/g (at 1 and 2 m distances) at J2 during winter and autumn respectively. Fig. 3a shows the average concentrations of individual PAHs (average within 3 m). Fig. 3a indicates that B (a) P was an individual PAHs found in highest concentration during autumn, whereas, Dib (ah) A was in highest concentration at most intercepts during winter. The results obtained for various locations indicated that concentration of the individual PAH (average of 16 PAHs at 5 locations) varies from place to place seasonally. Location J2 was an intercept surrounded by 5-6 educational institutes, where thousands of students were exposed to high percentage of PAHs. The result also indicated that there was a distinct variation in PAHs concentration with season and meteorological conditions. In general, concentration of all PAHs during winter was low as compared to autumn. The winter season in the city experiences high humidity and dense fog during day and night and temperature drop to zero and sub zero. During winter due to high humidity and dense fog in the day time, less photochemical degradation of these PAHs is responsible for their low concentration. Behavior of PAHs at places of average population and traffic density intercepts Average concentration of 16 PAHs at a distance of 1 to 3 m was determined during two seasons. The results obtained have been shown in Table 1, whereas graphical representations of the results are shown in Fig. 2b. The results showed that average concentration of 16 PAHs in general decreases with distance during autumn and winter. Large open area along roadside at these intercepts was responsible for different dispersion, suspension and distribution behavior of PAHs. It has been interpreted from Table 1 that the average highest concentration of 16 PAHs in five locations was 46.54 µg/g at distance of 1 m from roadside at the location J4 during autumn. The value observed was one of the highest in roadside soil in any metro or fast developing city in India. Dib(ah)A was an individual PAHs (among 16 PAHs) which was found in highest concentration i.e. 26.4 and 252.55 µg/g (1 and 3 m at J4 and J1 intercepts) during winter and autumn respectively. Average concentration of an individual PAHs (average within 1 to 3 m at five locations) have been shown in Fig. 3b. The figure indicated that B(a)P was an individual PAH which was found in highest concentration during autumn, whereas, Dib (ah) A was found in highest concentration during winter. PAHs contamination sometimes give more serious risks when their concentrations exceed recommended maximum limits than those related to outdoor exposures (Banerjee, 2008). Ringwise distribution pattern of carcinogenic and noncarcinogenic PAHs detected at high and average traffic and population density intercepts Graphical representation of ringwise distribution pattern of 2, 3, 4, 5 and 6 ringed PAHs (average % concentration within 3 m) and their seasonal variations have been shown in Fig. 4. The results indicated that all five ringed PAHs i.e. B(a)P, B(k)F, B(b)F and Dib(ah)A were present in highest concentration (around 70 %) at these intercepts in comparison to two ringed PAHs which were present in low concentration (around 0.50 %) during the two seasons. In general, the ringwise order of their concentration (% age) was 5> 4 >6 > 3 > 2 during winter and 5>6>4>3>2 during autumn. USEPA has identified seven PAHs as potential human carcinogens i.e. B(a)P ,B(k)F, B(b)F, Dib(ah)A, B(a)A, IP, B(ghi)P (Lunch, 2005), out of which four were five ringed, two were six ringed, and one of them was four ringed PAHs. All seven PAHs were detected in the current area of the study. The results indicated that the percentage of carcinogenic PAHs in soil within a developing city environment of the present study was quite high. The results of seasonal variations (average concentration) in carcinogenic and non-carcinogenic PAHs observed in the study at high and average traffic population and traffic density intercepts have been shown in Fig. 5a and 5b respectively. The results indicated that the total percentage of carcinogenic PAHs found at high and average traffic population density intercepts were as high as 85 % whereas, non-carcinogenic PAHs were only 15 %. The ratio of non-carcinogenic to carcinogenic PAHs was found to be 2.1 µg/g and 6.4 µg/g (i.e. 1:3) during winter and 4.74 µg/g and 35.8 µg/g (i.e. 1:7.55) during autumn. The high ratio of non-carcinogenic to carcinogenic PAHs at most of the intercepts in any fast developing city was the sign of potential risk to the residence of the city. Seasonal Variation Sampling periods of the present study was broadly divided into two seasons i.e. autumn and winter. Figs. 2 to 5 summarize the average concentrations, ringwise distribution pattern and ratio of carcinogenic and non-carcinogenic PAHs in the soil at two sites and their seasonal variations. The results indicated that the city average concentrations of PAHs during autumn were comparatively higher than winter i.e. 16.38 µg/g and 4.04 µg/g respectively. The difference in PAHs concentration in soil during two seasons was perhaps due to the characteristics of individual sites, vehicular and population density and meteorological condition during the period. Fig. 2a showed that, in general,average concentration of PAHs during two seasons was maximum near the road and minimum away from the road at most intercepts. From the studied area, the dense fog was observed during entire winter season with temperature decline below zero degree. Differences in dispersion and distribution of soot and smoke during winter due to fog has changed the dispersion and setting behavior which leads to decline in PAHs concentration during the seasons. Figs. 2a and 2b indicated that, in general, concentration of PAHs in soil was higher in high traffic density intercept as compared to average traffic density intercepts. Figures also indicated that average concentration of PAHs was higher during autumn than in winter. These results indicated that seasonal variation and concentration of PAHs at various intercepts was directly related. Figs. 3a and 3b indicated that average concentration of individual PAHs was higher during autumn as compared to winter season. Average concentration of individual PAH was also highest at high traffic than average traffic density intercept. The Fig. 4 indicated that higher molecular weight PAHs (i.e. 4, 5 and 6 rings) were in higher concentration than lower molecular weight PAHs (2 and 3 rings) during two seasons. Average concentration of B(a)P (a most carcinogenic PAH) was maximum during autumn, whereas, Dib(ah)A was highest during winter at high and average traffic density intercepts. Average individual PAHs concentration was highest during autumn as compared to winter. Temperature of soil was an important factor in determining the mobility of soil PAHs. Autumn seasons of sampling region receives high temperature ranging between 3 to 35 oC. During autumn city environment was dry, cool and environment experienced high concentration of particulate matter. The particulate matter which also included soot may adsorb many volatile and non volatile PAHs and settled them in nearby roadside soil. Fig. 4 indicated that average PAHs percentage concentration of 5 ringed PAH was maximum in autumn as compared to winter. Fig. 5a and 5b indicated that concentration of carcinogenic PAHs was higher than noncarcinogenic PAHs during two seasons. Average concentration of carcinogenic and non carcinogenic PAHs during autumn and winter was 41.02 µg/g, 29.15 µg/g and 4.99 µg/g, 4.49 µg/g at high traffic density intercepts and 7.48 µg/g, 5.47 µg/g and 3.06 µg/g, 1.27 µg/g at average traffic density intercepts respectively. It has been found that high concentration of carcinogenic PAHs in the soil at various locations within city and their exposure may be harmful to the people travelling through these regions. Statistical analysis of results In order to find exposure of the PAHs to human from roadside soil at high and average population and traffic density intercepts of the city, the ratio of carcinogenic and non-carcinogenic, PAHs was determined. Ratio of carcinogenic and non-carcinogenic PAHs was higher during autumn than in winter. Although there was no toxicity limit fixed for PAHs along roadside soil in India, the noncarcinogenic and carcinogenic PAHs results were found to be significant due to high ratio of these PAH in roadside soil. Due to no PAHs limiting values in soil in India, the present data was compared with Mexican standards (0-6 µg/g), Polish standards (0.02-10 µg/g), (Skrbic et al., 2005) and world wide data given in Table 2. Comparison of Jalandhar city average of 16 PAHs during autumn (16.38 µg/g) and winter (4.04 µg/g) with available literature data, it was found to be quite high as compared to many other cities of the world such as Kota Bharu, Malaysia (1.45 µg/g, Fadzil et al., 2008), Australia (3.30 µg/g ,Yang et al., 1991) , Delhi airport soil (4.43, µg/g, Ray et al., 2008), Agra, India (12.9 µg/g, Masih and Taneja, 2006) , but lower than few other cities of the world such as USA (58.68 µg/g, Rogge et al., 1993). In order to compare the city average concentration of 16 PAHs of developing city like Jalandhar with other cities of India, two tailed t-test was applied to the data. The results of the test applied to Jalandhar city average (during autumn, 16.38 µg/g current study), a developing city to that of New Delhi airport soil data (4.43 µg/g) a metro city (Ray et al., 2008), indicated that the data of two places differ significantly at 5 % level of significance. This showed that PAHs contamination level and distribution pattern (hence exposure to human being) of two places was quite different. The results of the test applied to Jalandhar city average during winter (4.04 µg/g current study), a developing city to that of New Delhi airport soil data (4.43 µg/g) a metro city (Ray et al., 2008) indicated that it does not significantly differ at 5 % level of significance. This showed equal level of PAHs contamination at two places. On the other hand on applying the test to Malaysia road side (Fadzil et al., 2008) soil data (1.45 µg/g) the data of two places differ significantly at 5 % level of significance. This shows that PAHs contamination level and distribution pattern of two places were quite different. Our data indicated that residents living in these areas were at potential risk of exposure to the toxic effect of various types of PAHs, in agreement with other studies, which demonstrated a potential risk for exposure to high levels of PAHs for road users and those living in urban environment of fast developing city. CONCLUSION This is the first comprehensive information on PAHs spatial distribution pattern at different distances (1, 2 and 3 m) from roadside in the soil in a fast developing city of India. This work revealed the roadside soil contamination with PAHs and found that 1 m distance from roadside was highly contaminated with many carcinogenic PAHs. PAHs concentration was highest during autumn as compared to winter.It was observed from the results that carcinogenic PAHs (4 to 6 rings) were found to be in higher concentration (around 85 %) than non-carcinogenic PAHs (2 to 3 ring, around 15 %) at most intercepts. High concentration of carcinogenic PAHs within city could be toxic to human. B(a)P and Dib(ah)A was an individual PAHs present in higher concentration during two seasons at most of the intercepts. It was also concluded from this study that even developing cities were showing equal or even higher concentration of carcinogenic PAHs than the metropolitan cities, which is a dangerous sign towards human exposure. This study suggests that the pollution of PAHs in developing cities like Jalandhar should emphasize on controlling the traffic exhaust specially diesel exhaust. The study could be of considerable significance for the planners while considering environmental remedial measures. ACKNOWLEDGEMENTS The authors are grateful to Ministry of Human Resource Development, Government of India, New Delhi for providing fellowship (No. F. 9-2/2007 TS.I). The authors are also greatful to the authorities of National Institute of Technology Jalandhar for providing the necessary laboratory facilities and infrastructure to carry out the present work. REFERENCES
© IRSEN, CEERS, IAU The following images related to this document are available:Photo images[st11006t1.jpg] [st11006f5b.jpg] [st11006f3b.jpg] [st11006f2a.jpg] [st11006f1.jpg] [st11006f3a.jpg] [st11006f5a.jpg] [st11006t2.jpg] [st11006f2b.jpg] [st11006f4.jpg] |
| |||||||||
