 |
| About Bioline | All Journals | Testimonials | Membership | News |
|
||||||
|
||||||
International Journal of Environment Science and Technology, Vol. 8, No. 1, 2010, pp. 73-82 Separation of metal laden waste using pulsating air dry material separator 1*Y. He; 1C. Duan; 1H. Wang; 1Y. Zhao; 2D. Tao 1School of Chemical Engineering and Tech, China Univ. of Mining
and Tech, Xuzhou,
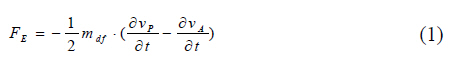
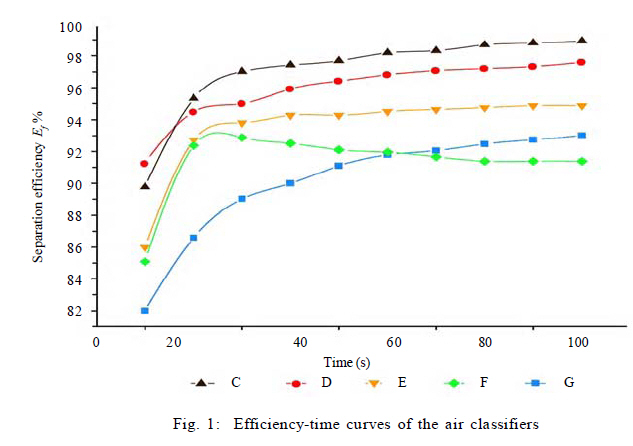
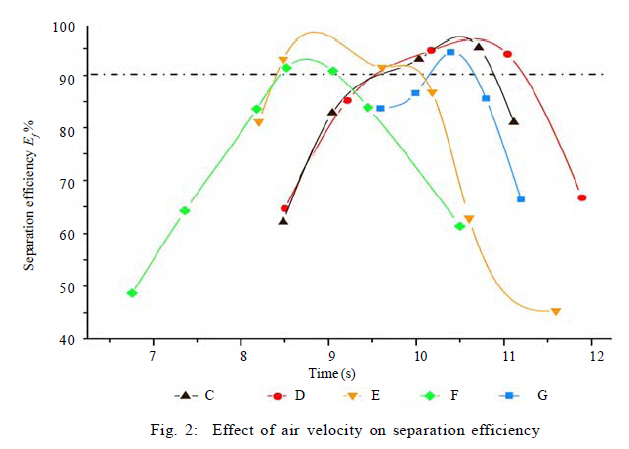
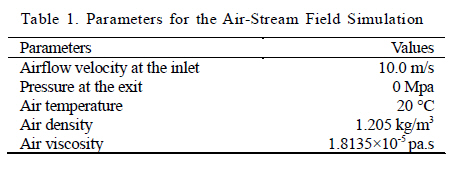
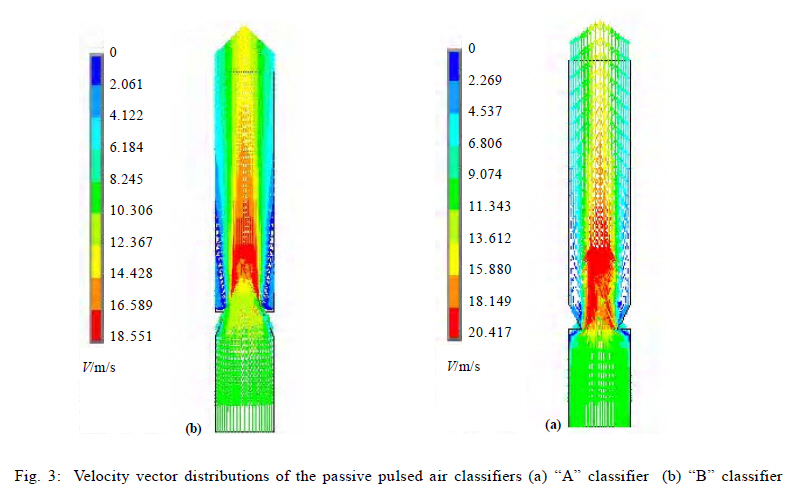
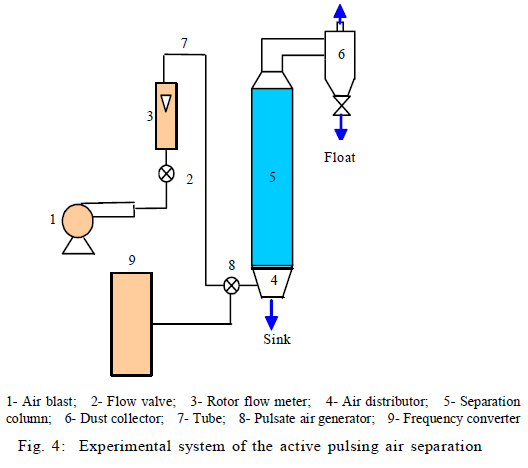
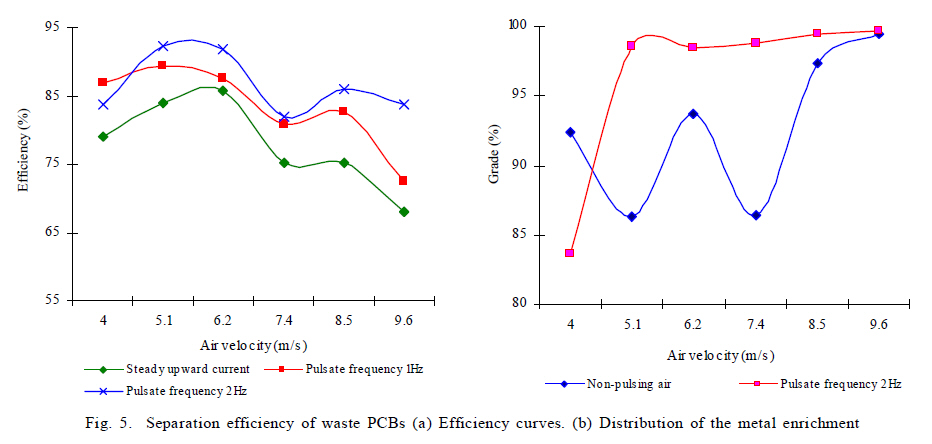
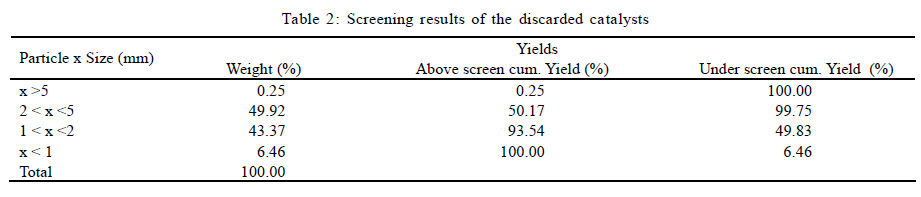
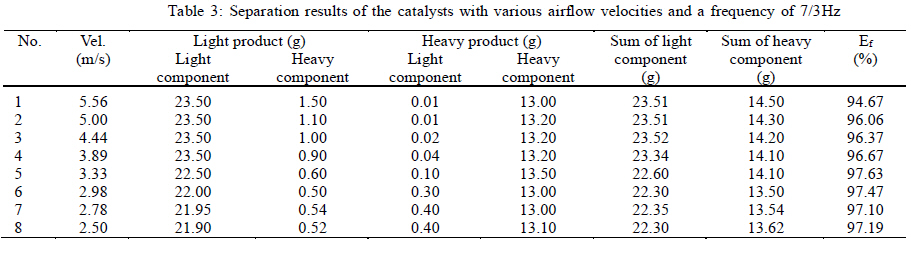
Jiangsu 221008, China *Corresponding Author Email: yqhe@cumt.edu.cn Tel.: +86 516 83591099; Fax: +86 516 83591059 Received 30 July 2010; revised 4 October 2010; accepted 24 November 2010; available online 1 December 2010 Code Number: st110007 ABSTRACT: Separation of metal laden solid wastes for their recycling utilization using passive pulsed air and active pulsing air classifiers was studied. Laboratory investigation showed that the active pulsing air separator performs more efficiently than the passive pulsed air separator due to the ability to accurately control operating parameters. By studying the difference of drag coefficients of the particles moving through the airflow of varying Reynolds numbers, models of the dynamic particle motion were developed and a computer simulation was prepared. Results of the simulation were reported to predict the observed results with artificial tracing spheres being separated by the laboratory equipment. Two different, real world feed materials were separated with the laboratory scale active pulsing air classifier. The discarded catalyst consisting of precious metal components and sintered magnetic beads was separated with the separation efficiency, of 97.6 %. The second real-world feed, electronic scrap crushed to a size of 0.5 to 2 mm, showed a separation efficiency of 92.41 %. At the same time, the grade of the recovered concentrate of metals was above 98 %. Key word: Dynamic equation; Electronic scraps; Pulsating air; Recycling; Simulation INTRODUCTION Electronic scraps are the fastest growing solid waste in modern society (Winter and Courtney, 2001). They contain significant toxic and hazardous substances and if improperly disposed, are harmful to the environment and health (Nwachukwu et al., 2010). However, recycling and re-utilization of valuable components can be achieved when they are separated effectively (Zhang et al., 1998; Cui and Forssberg, 2003). Wet processing for electronic scraps classification produces washing sludge. Its entrainment of heavy metals and other wastes may cause more serious environmental impacts (Kozlowski et al., 2000; Luga et al., 2001; Igwe et al., 2008; Nwuche et al.,, 2008; Shah et al., 2009). Thermal plasma technology also offers a very promising alternative of electronic waste treatment, but it is still in the laboratory (Tippayawong and Khongkrapan, 2009; Tehrani et al., 2010). Discarded catalysts can be prepared for recycling by chemical processes, such as substance solution, settlement, ion-exchange and continuous extraction. Then the prepared spongy materials contain platinum, palladium, rhodium, gold, silver and so on (Khanfekr et al., 2009). These spongy materials are difficult to separated from sintered beads by wet separation processes. Air classification of dry materials with a steadily rising airflow has been used to separate chaff from grain for thousands of years (Joseph, 1979). It is based on the particles' nature of having different terminal velocities in free fall, which in turn, are dependent upon the particles' varying size, shapes and densities (Stessel, 1992; Feng et al., 2009; Wu and He, 2010). Because the terminal velocities of valuable minerals and tailings often overlap, low separation efficiency is obtained when utilizing a conventional straight-pipe air classifier. Therefore, the desired density-dominant separation is not achieved (Jackson et al., 1988). For achieving a density dominant separation, principles of the pulsating air classification and equipment were studied (Senden, 1978; Taub and Peirce, 1983). The passive pulsed air classification was systematically researched by Peirce and Stessel of Duke University (Peirce and Wittenberg, 1984; Stessel and Peirce, 1986). In the 1990s, S. Ito of the National Institute of Resource and Environment (NIRE) in Japan studied the performance of the pulsating air classification with a laboratory scale passive pulsed air separator (Ito, 2003). The direction or sectional area of the separation column of passive pulsed air classifiers is changed. This design varies the air velocity, affects air acceleration, and achieves the objective of separating particles by density (Stessel and Peirce, 1986). The methodology of active pulsing air classification was put forward in the early 1990s. The pulsating air generator achieves a better performance than the passive pulsed air separators because the particles receive a new acceleration action in every pulsating period. During the process of air accelerating, turbulence is produced in the active pulsing airflow field. Since the flow pattern is complex, the mechanism of the separation of particles by density is still being investigated.The mail objectives of this work are to study the law of density dominant separation of particles by pulsing air action and to model the dynamic equation of the motion particles. The laboratory separator design and separation experiment began in 2005 and was completed in 2008 in the Ministry Key Lab of Mineral Processing in China University of Mining and Technology. The modelling was successed in 2009. MATERIALS AND METHODS Laboratory Test on Passive Pulsed Air Separator Laboratory Experiment Two passive pulsed air separators were used as the experimental settings in this laboratory separation test. "A" represents a design where the amplifications have a ramp cross-section, which gradually introduces a constriction when passing from the bottom to the top of the device. The total length of the separating column is 2000 mm and the lowest constricting damper is fitted 300 mm above the column bottom. The damper reduces the column radius by 15 mm over a vertical distance of 20 mm. "B" represents an alternate design where the constriction is gradually reduced when passing from bottom to top. Otherwise, its geometric parameters are the same as classifier "A". The laboratory classifiers are fitted with three or four dampers. Dampers, whose dimensions are the same as that in the classifier "B", were fitted at the flange joints. Four configurations of the classifier were tested by installing one, two, three and four dampers. These were marked respectively classifiers C, D, E and F. The air classifier marked G is a standard straight-pipe air classifier without any damper.Pieces of aluminum and polyester plastic were mixed as a feed. The pieces had specific gravities of 2.70g/cm3 and 1.60g/cm3, respectively. The geometric sizes of the aluminum pieces and the polyester plastic pieces were 10×7×2.8mm and about 10×10×3mm. They were weighed and then mixed together and fed into the air classifier. After a given time, the samples were collected at a top collecting plate and from a bottom discharge gate. When the separating time reaches 60 sec there were almost no additional light particles being separated, suggesting that the separating operation completes by this time. For evaluating the separation effect, the total separation efficiency, Ef, of light and heavy production is a key index. And, it can be calculated by the formula (Crowe and Peirce, 1988). Ef=[(x1 /xo)×(y1/ y0)]1/2 Where x1 is the mass of light material in the product; xo is the total mass of light material in the feed; y1 is the mass of heavy material in the product and y0 is the total mass of the heavy material in the feed. Separation experiments of the materials indicate that air classifier D, which has 3 dampers, obtains the highest separation efficiency, followed by classifiers C and E shown in Fig.1. The results of separation experiments also indicate that pulsed air classifiers C, D, E and F, which are fixed with dampers, are more efficient than the standard non pulsating air classifier before 60 seconds separating time. After the separating time exceeds 60 sec, nearly no additional light products in air classifiers marked C, D and E are separated. Only in air classifier F are there a few heavy products reported as light products, so the separation efficiency of air classifier F falls. This phenomenon shows the number of dampers should be within an appropriate extent. Another important criterion for evaluating a good classifier design is that it can maintain high separation efficiency over a wide range of airflow rates. The criterion can be defined as the effective air flow rate over which the separation efficiency is greater than 90 %. Fig. 2 shows the relationship between separation efficiency and separation airflow velocity for different configurations of the classifiers. It indicates that the effective air flow rate for a standard non-pulsating air classifier is only 0.52m/s, while it gets 1 m/s or more for the passive pulsed air classifiers fitted with dampers. The effective airflow rate of the air classifier C even reaches 1.72m/s. According to this result, it is understood that the effective range of airflow rates of the passive pulsed air classifiers are wider than that of the non-pulsating air classifiers (Duan et al., 2003). Simulation of the passive pulsed airflow For studying the air-stream fields of the passive pulsed air classifiers, simulations were prepared for laboratory experimental tests. It is assumed that the air velocity is symmetrical at the inlet and that the cross air velocity, perpendicular to the direction of inlet airflow, is zero. The boundary condition is no slippage at all sides (all velocity embranchments are zero). Because the airflow is within a low speed range (<100m/s), the flow of air can be regarded as uncompressed flow. The simulation parameters are shown in Table 1. According to Reynolds formula, it was calculated that the Reynolds number, Re, is more than 2000. Hence, the flow in the separating column is turbulent. To study the effective regions of the separating column of the two passive air classifiers, the fluid kinetic computation software ANSYS FLOTRAN for airflow pattern analysis was used. The simulated flow fields are used to examine the mechanisms of material separation and to interpret the differences in separating performance between standard and the passive pulsed air classifiers. Only a representative section of the separating column was selected for computer simulations of the airflow fields in the separating area (Wang, 2004; He et al., 2005). In Fig. 3(a) a sharp break of airflow velocity can be observed near the damper, which reaches 18.5m/s in the central part of the column. Dampers cause changes in airflow acceleration. The acceleration effect is highly favorable for achieving the density-dominant separation of particles. The velocity vector distribution of the passive pulsed air classifier "B" 1 is plotted in Fig. 3(b). Here, it is shown that the effect of the damper on the airflow velocity distribution is significant. The airflow velocity around the damper and at the central part above the damper reaches about 20 m/s. This is twice the velocity as at the inlet and greater than the corresponding velocity of the passive pulsed air classifier "A". Also, the velocity gradient is steeper than seen in the classifier "A" of Fig. 3(a). The high velocity air stream in the centre of the column takes the light particles out quickly. Therefore, the separating time is shortened. The analysis above for flow patterns indicates that the classifier configuration "B" is more effective than the classifier "A" in flow acceleration. This is the reason why classifier "B" was selected as the laboratory separation experiment. Active Pulsating Air Separation Experimental System Typically, as a particle moves through a steady upward air current, forces such as gravity, air buoyancy, drag act on it. Because the fluid flow pattern under study is the active pulsing airflow, the particle will obtain a "new" pulsating air action in every pulsating period, which accelerates the particle. Birkhoff (1960) and Batcelor (1967) considered that the particle not only receives the effect of drag force, but through energy transmission would replace the mass of the fluid, which might resist the particle moving through the flow. This value, a function of the fluid density, the volume and velocity of the particle, is called acceleration effect or "the extra mass force" and can be calculated by Taylor's Theorem of fluid mechanics (Wang and Xiong, 2003). A laboratory scale active pulsing air separator and experimental system were developed shown in Fig.4 (He et al., 2005). The separation column with several segments, whose internal diameter is 50mm and the length 200mm, were joined together by flanges to make a 1750mm high separator. The active pulsing airflow is produced by the pulsating air generator. The frequency of the pulsating air can be adjusted with a frequency converter. In the laboratory scale active pulsing air classifier, the rotational speed of the air-valve transmission motor is 1400r/min and the reduction ratio of the reducer is 20:1. Therefore, the required time for one cycle of the pulsating air valve should be 0.857 second. Because the active pulsating air generator was modified from a butterfly valve, when it rotates one cycle, two pulsating peaks of air velocity would be produced. To serve as comparison of the computer simulation result and the laboratory separation performance, the pulsating frequencies of 0.857 second and its multiples were applied while in simulation. Separation Performance to Waste PCBs Early research showed that PCBs has the characteristic of selective crushing (Cao et al., 2002). After two-stage crushing, the components analysis indicated that metals are mainly enriched in -2+1mm and -1+0.5mm size fractions. The grades of the metal enrichment in the two size fractions are 45.8 % and 55.7 % respectively. Though the yield of the crushed product in the fraction -2+0.5mm is 55.38 %, the metal distribution rate in the fraction reaches 72.77 %. So, it can be concluded that the main metals enrich in the size fraction of -2+0.5mm, and this fraction was then taken into the laboratory separation test. Fig. 5 explains the separation result with the laboratory scale active pulsating air classifier for the crushed waste PCB material. In size fraction -2+0.5mm, the separation efficiency of crushed waste PCBs is 92.41 %. This is determined by measuring the metal to non-metal components. The grade of the recovered concentrate of metals is above 98 %. Discarded Catalysts Processing Catalysts usually contain precious metals, such as platinum, palladium, rhodium, gold and silver. After catalysts lose their activity, they would become the hazardous waste to the environment. However, if these precious metals can be recycled by processing, recycling and reutilization of these discarded catalysts will be achieved. Therefore, by means of substance solution, settlement, ion-exchange and continuous extraction, the precious components can be extracted in sponge materials while the tails leave in sintered beads. The laboratory active pulsating air separator was used to separate the sponge materials with precious metals from the sintered beads. The feed material was sized by a standard vibrating multi-deck screen set with apertures of 5mm, 2mm, 1mm, and was screened through vibration for 4 min. The size distribution of the materials is shown in Table 2. In above 457.4g feed material, the density of the sponge components is between 0.8g/cm3 and 0.9g/cm3. The heavy components, which are sintered beads, have density of 1.2 g/cm3 to 1.3g/cm3. From laboratory separation test with the active pulsating air separator, the best separation efficiency was obtained while the frequency of pulsating air was 7/3Hz. Table 3 tells the test result of separating the sponge materials with precious metals from the sintered beads. Table 3 shows that the best separation efficiency, 97.63 %, was achieved with the pulsating frequency of the air being 7/3Hz and airflow velocity being 3.33m/s. In particular, there was a small amount of light component mixed among the sink product, because that is important for concentrating the precious light component. Methodology of the Active Pulsating Air Classification Non-linear Dynamic Equations As the basic parameter for studying the nature of particles
moving through fluid, drag can be expressed as a product of drag coefficient
and some relevant factors. However, the factors which influence the drag of
particles moving relative to the fluid are complicated and usually they can
be described by setting forward an expression of a non-dimension number (Carstens,1952;
Karanfilian and Kotas, 1978). To derive the drag coefficient, it is
found that in a lower Reynolds number regime (0
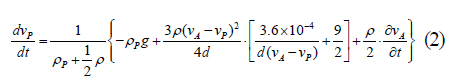
From the above description and by force equilibrium, the following equations were derived. When 0
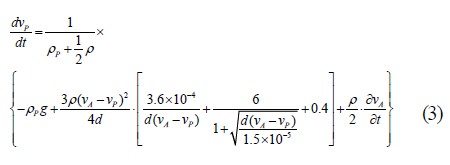
Or, when 0d"Red"2×10⁵,
Simulation and Optimization
For numerical simulation, the imitated materials were used,
which were the virtual spherical particles with diameters of 3.5mm, 6mm, 0.94mm
and densities of 2.4g/
cm3, 1.4g/cm3, and 8.9g/cm3 respectively.
For the imitated materials, the calculation of the terminal settling velocity
of the particles should be considered in the situation of the Reynolds number
being within the range of the pressure drag. It means that the Newton-Rittinger
formula is used to calculate the terminal settling velocity of the particles
in the flow of turbulence. Under the environment of normal room temperature,
the air density is 1.205kg/m3. The terminal velocities vglass would
be 14.312m/s, where vplastic is 14.310m/s, and vbronze equals
14.361m/s.
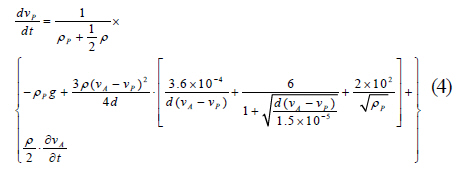
However, the result of the simulation showed a great divergence
to the laboratory separation test. The deduced dynamic equations could not
reflect the actual response of the particles, and the models were therefore
modified. By comparing the results of laboratory study, and by investigating
the nature of the pressure drag coefficient, A modification of drag coefficient
for particles moving through the pulsating air fluid was provided (Houghton
and Carpenter, 2002; Olayiwola and Walzel, 2007). The modification is
shown in equation (4) (He et al., 2007).
Result of Laboratory Experimental and Simulation
For investigating the suitability of dynamic equation (4),
the Memrecam Ci3 Motion Particle Dynamic Analyzer (MPDA) made by NAC Corporation
of Japan, was used for taking photographs and analyzing the digital image data.
A specialized image analyzing software, the New Movies, was joined for image
computations to obtain the kinematic characteristics of the moving particles
in the pulsating air fluid. The photographing speed of the Memrecam Ci3 high-speed
camera can be adjusted within a range of 100-2000 frames per second. A portable
memory storage device, Iomega Jaz, was used for storing the data. This MPDA
was used for comparing the result of laboratory tests and the numerical simulation
of moving particles kinetics. As the partial differential equation (4) of the
dynamic model is expressed as non-identical functions,
in which the pulsating air velocity produced by the pulsating
air generator is expressed as vA=v0×|1- cosa|,
where v0 is an air velocity while the generator is entirely
opened, and a is the rotation angle of the valve. To resolve
this problem, a functional operator was developed that reduced the equations
to identical form. Then a four or five-rank Runge-Kutta method was applied
to solve the resulting set of the equations. In this way a computer simulation
was prepared that showed the traces of the particles with different densities
and/or diameters, but similar aerodynamic characteristics, as they moved through
the turbulent air flow (Zhao et al., 2008; He
and Zhao, 2009). These simulated results were compared to the laboratory
separation results by using the tracing sphere particles.
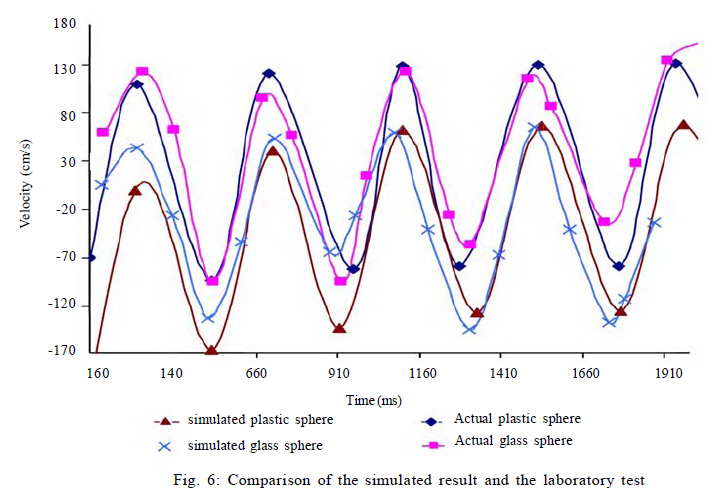
The comparison of the numeric simulation and the laboratory
test using the tracing spheres is shown in Fig.6.
The diameter and density of the spheres in the laboratory test were 4.7mm and
1.3g/cm3. In the simulation, the velocity of the airflow was set
at 9m/s, while the velocity of the air in the laboratory test was 9.72m/s.
The reason that a somewhat larger velocity was used in the laboratory test
than in the numeric simulation is to compensate for the pressure head loss
and pipe resistance of the laboratory equipment. In Fig.
6, the range of the imitated velocity curve of the plastic spheres varies
between 0.8m/s and 1.2m/s, with the mean value near 0.3m/s. This result is
very close to the MPDA analyzing result, where the photographed
positive velocity of the particle is around 1.23m/s,
which reaches 1.5m/s in the fifth pulsing period,
precisely because this velocity peak makes it become a
float product. The bottom of the curve was determined
by MPDA at 0.9m/s and this result is almost
identical with the results of the simulation. Furthermore,
this identical result between simulations and
laboratory tests were proven with glass, metal and other spheres.
CONCLUSION
ACKNOWLEDGEMENTS
The authors gratefully acknowledge the financial support provided
by the National Natural Science Foundation of China (50574094) and a China
Education Ministry Key Laboratory Open Program (CPEUKF06-11). Authors also
appriciate to a funding from the Science and Technology Innovation Program
of Xuzhou, Jiangsu, China (200600242).
REFERENCES
© IRSEN, CEERS, IAU |
| |||||||||
