 |
| About Bioline | All Journals | Testimonials | Membership | News |
|
||||||
|
||||||
International Journal of Environment Science and Technology, Vol. 8, No. 1, 2010, pp. 115-128 Application of algae in biomonitoring and phytoextraction of heavy metals contamination in urban stream water 1*K. Sekabira; 2H. Oryem Origa; 3T. A. Basamba; 2G. Mutumba; 2E. Kakudidi 1Department of the Environment, School of Engineering and Applied
Science, Kampala International University,
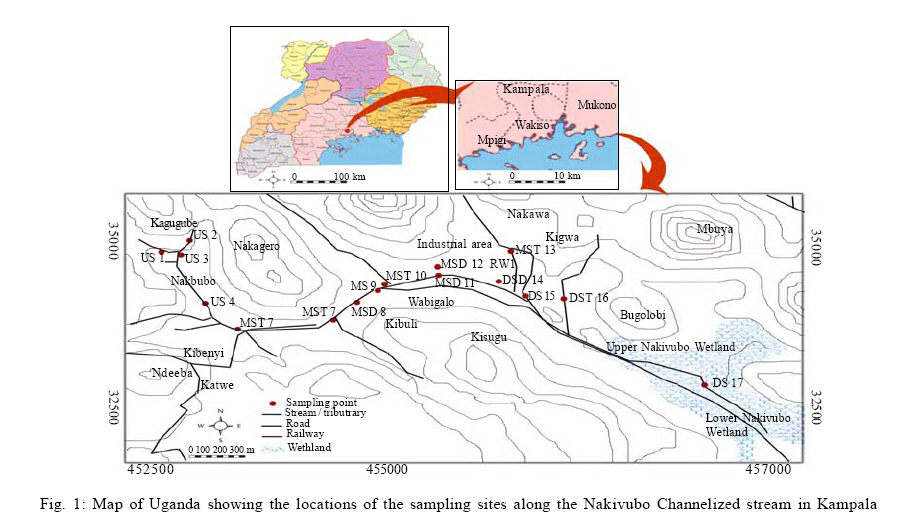
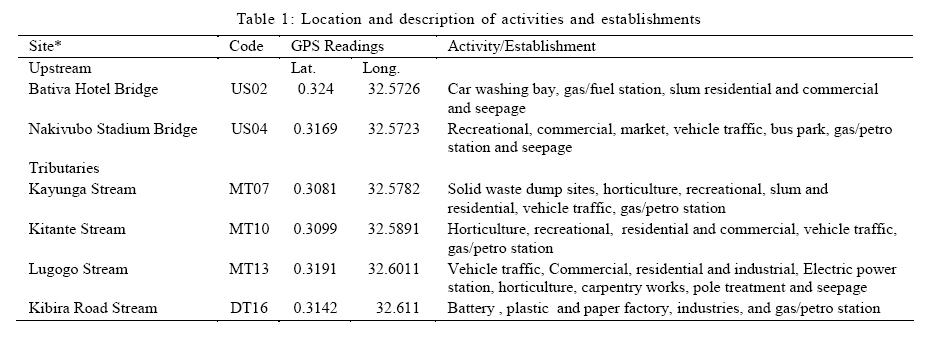
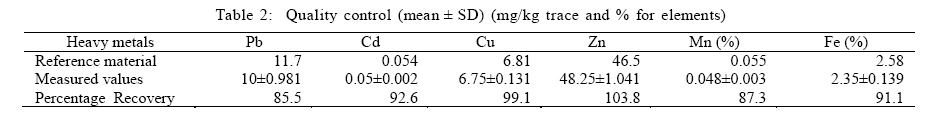
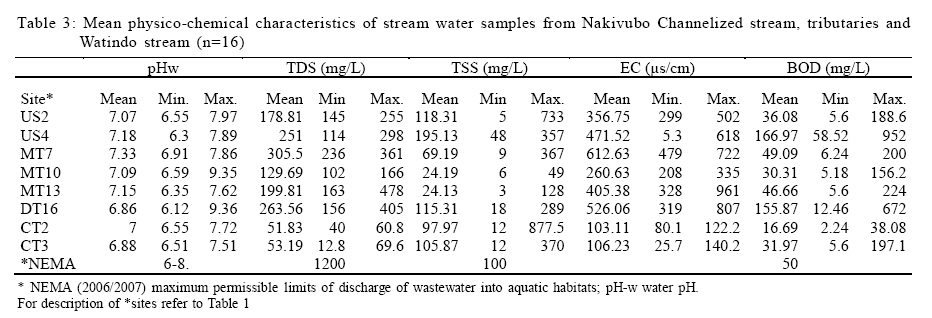
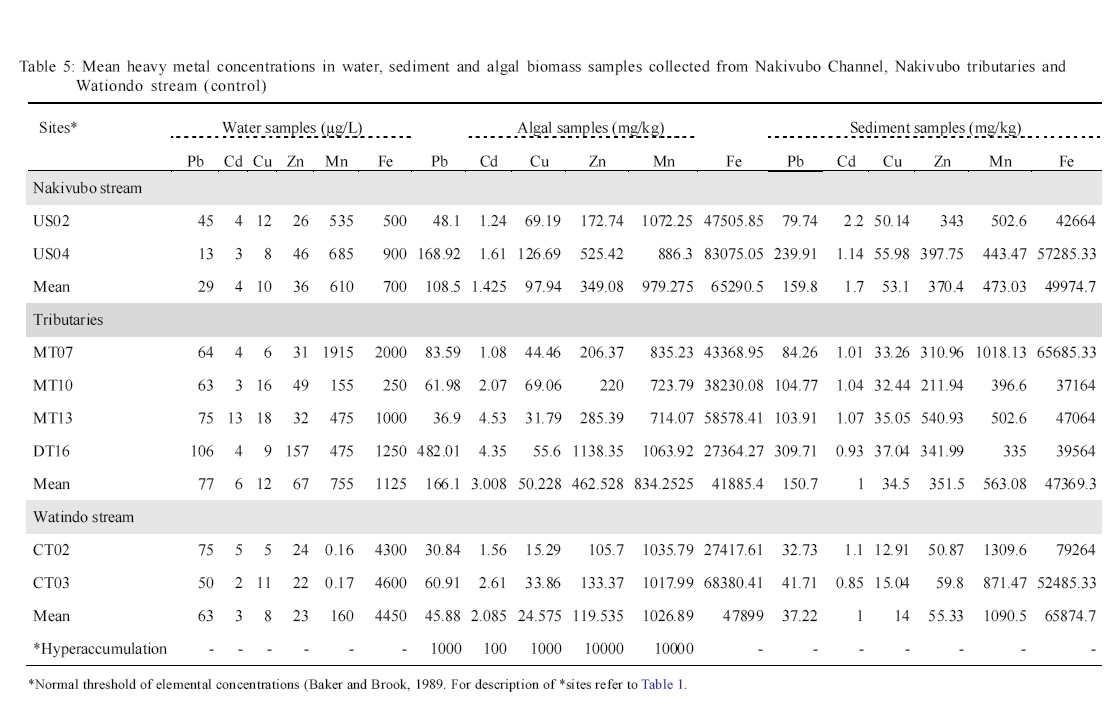
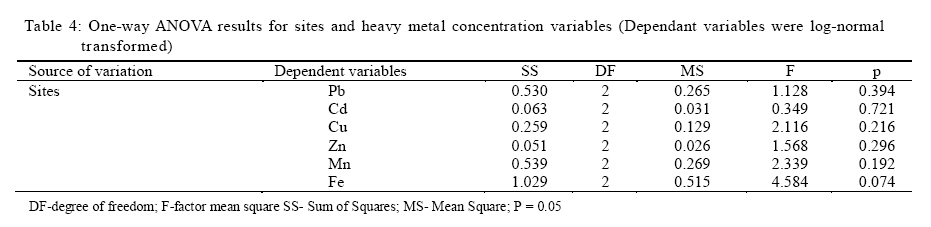
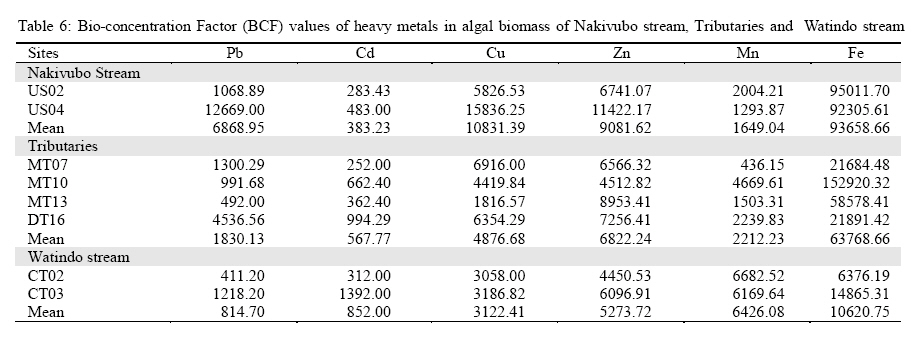
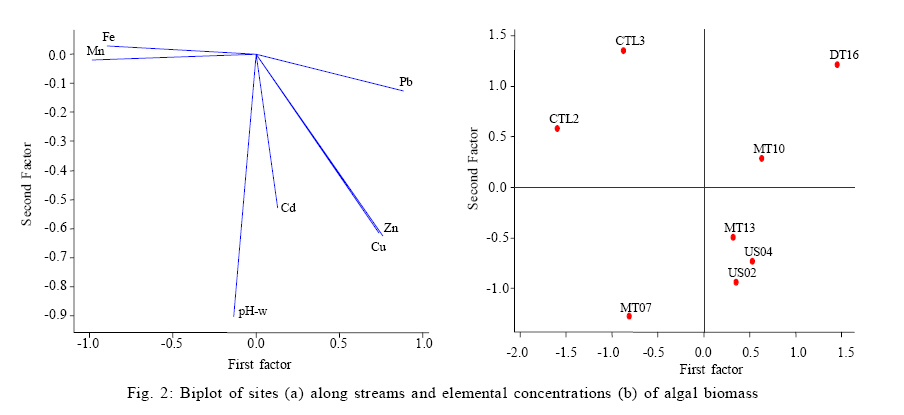
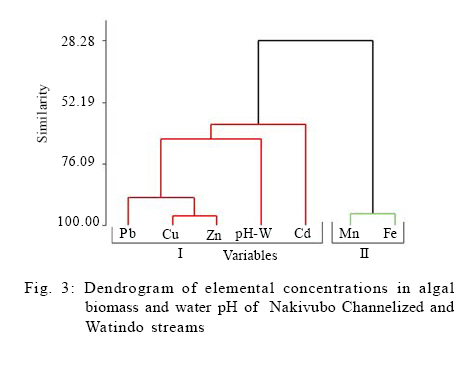
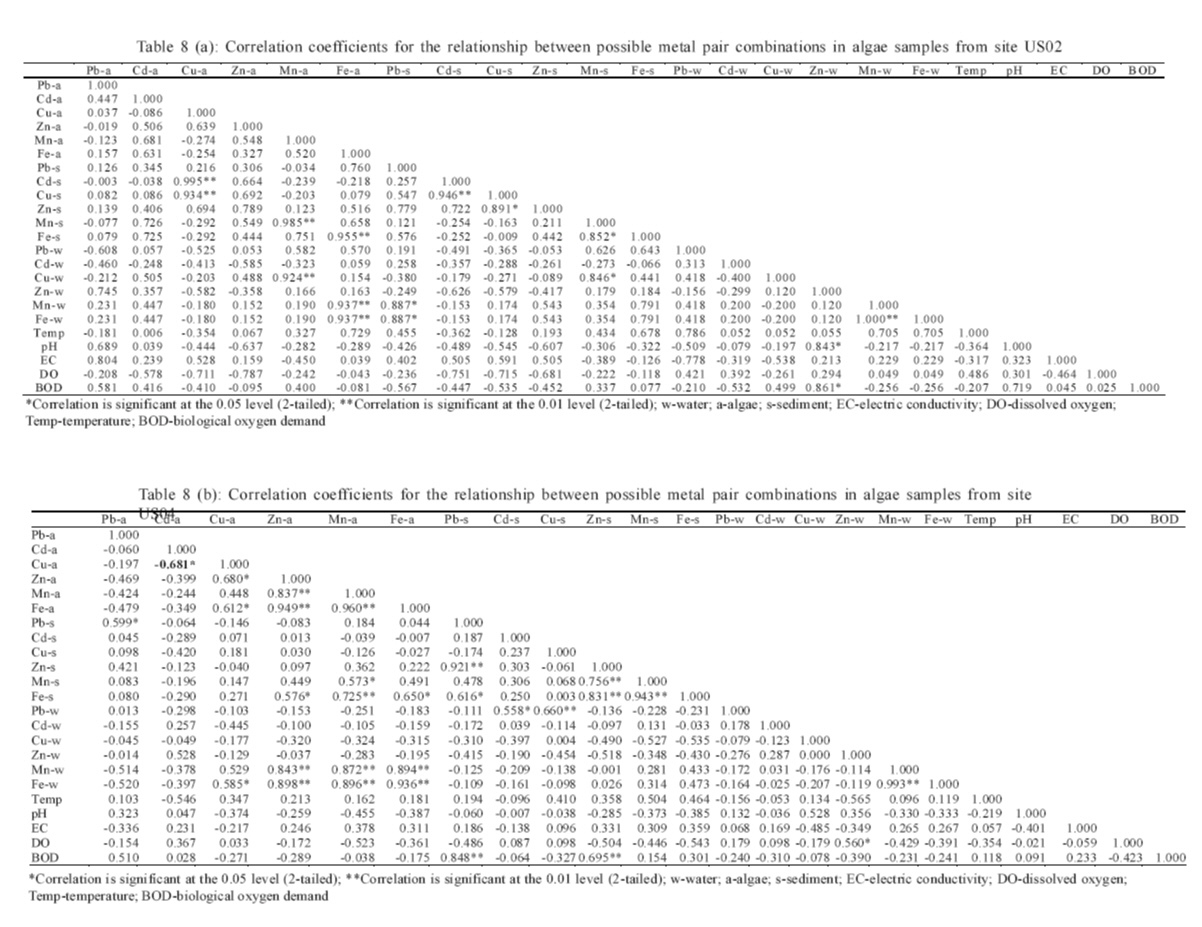
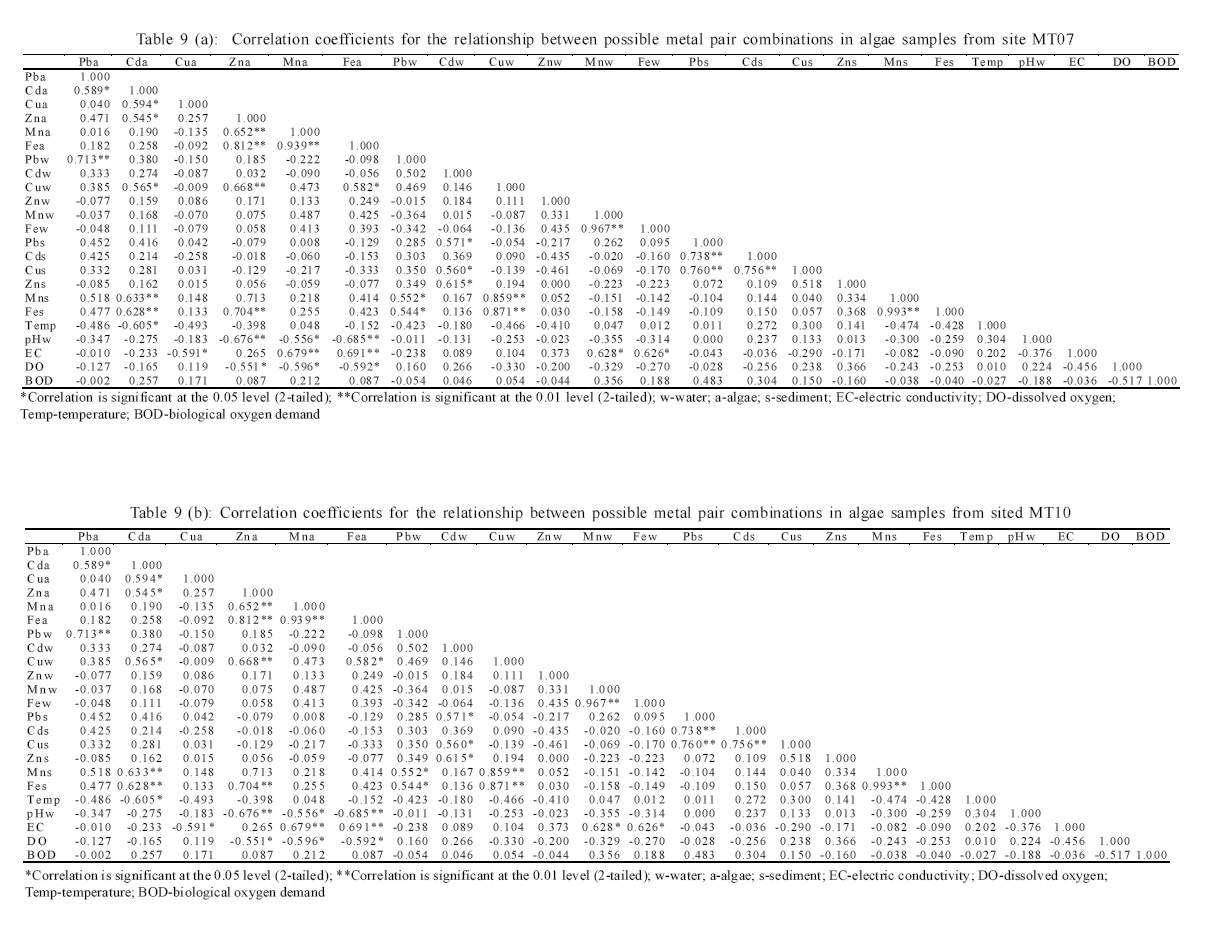
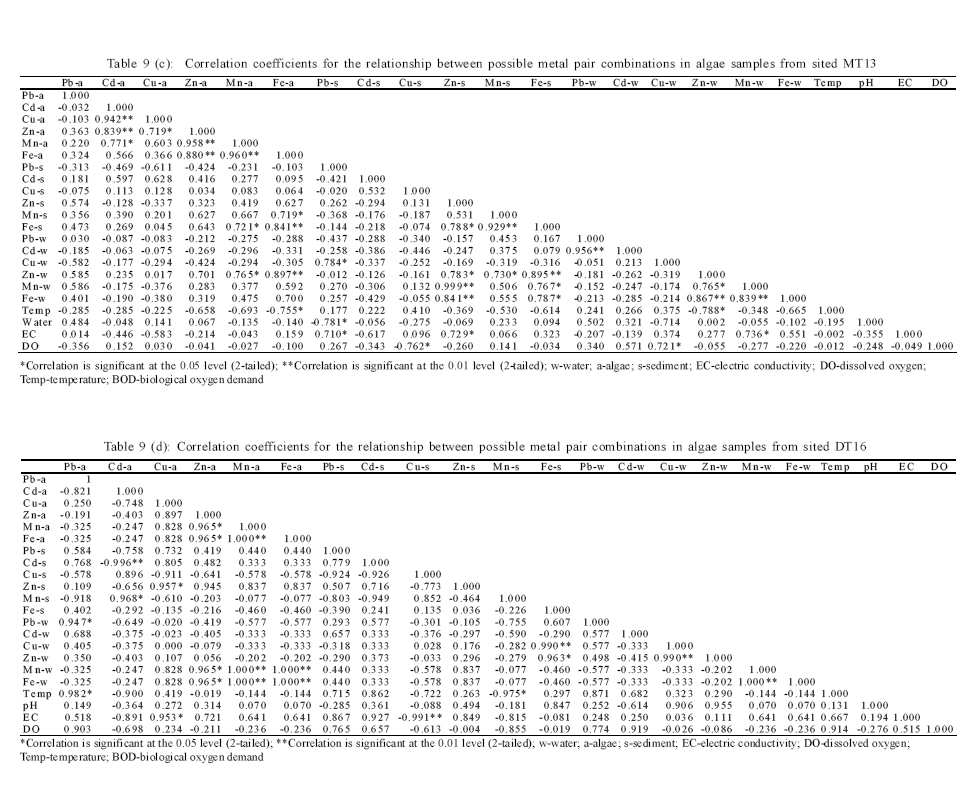
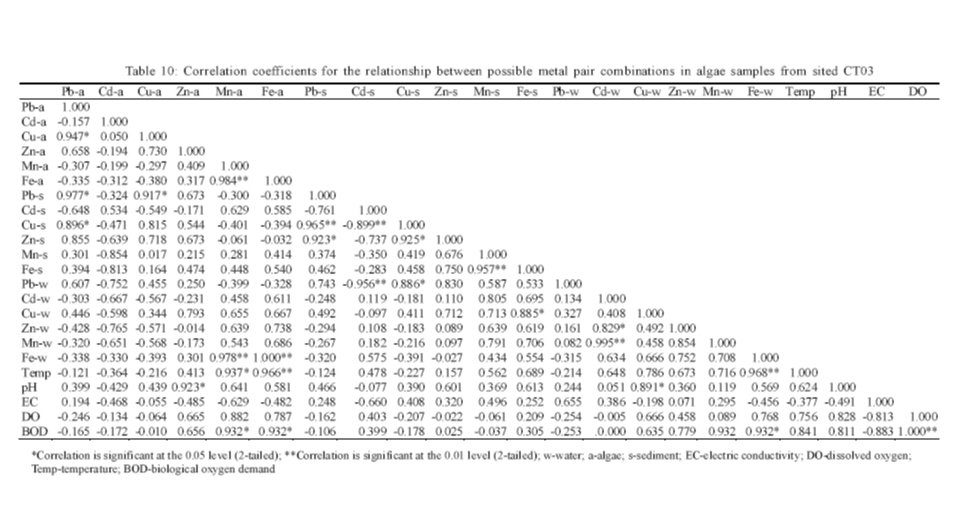
P. O. Box 20000, Kampala, Uganda *Corresponding Author Email: ssekaba@gmail.com Tel.: +256 772 855 348 Received 28 August 2010; revised 25 October 2010; accepted 15 November 2010; availabe online 1 December 2010 Code Number: st11011 ABSTRACT: Biological technologies for wastewater remediation techniques employed to remove contaminants in urban stream water are increasingly receiving attention worldwide. The purpose of this study was therefore to determine the concentrations of lead, cadmium, copper, zinc, manganese and iron in algal biomass and establish the feasibility of using algae in phytoextraction and bio-monitoring of environmental quality. Analysis of algal biomass samples in the Nakivubo urban stream ecosystem, Kampala, Uganda, showed that there was contamination by lead, cadmium, copper and zinc as indicated by enrichment factor and pollution load index values. It is suspected that industrial and vehicular emissions are the major sources of these pollutants. Calculated bio-concentration factor was ≥ 1000 but with low concentration thresholds in each element, suggesting that algal biomass was a very good heavy metal accumulator. The bio-concentration values in algal biomass were found to be in the order of copper > zinc > lead > cadmium in the Nakivubo Channelized stream. In conclusion, algae can be a promising aquatic bio-filter plant for phytoextraction and bio-monitoring of polluted urban stream ecosystems and wastewater. Keywords: Bio-filter; Biomass; Green algae; Phytosorption; Wastewater INTRODUCTION Recent developments in environmental research have revealed that many living organisms can accumulate certain toxicants to body concentrations much higher than present in their environments (Nyangababo et al., 2005a; Igwe et al., 2008; Kord et al., 2010). This makes chemical analyses in biota important for use in routine assessment and monitoring procedures (Lam and Gray, 2003; Nwuche and Ugoji, 2008). Body contaminant concentrations can further be used in assessing and monitoring the uptake of contaminants by living organisms and the increase in concentrations of pollutants from the environment to the organisms (bioaccumulation/bio-concentration). Green algae have been recognised as one of the most important primary producers in some aquatic ecosystems that have a role to play in the regulation ofdissolved oxygen in water through the phenomenon of photosynthesis. The adsorption, phytosorption and affinity of algae for heavy metal cations in wastewater treatment because of its high negatively charged surface (cell wall components) have been acknowledged for a long time. This property gives algae an added advantage as heavy metal accumulator in view of phytoextraction of such elements in urban stream ecosystems (Chmielewska and Medved, 2001; Kar et al., 2008 ). Algae have been qualified as a precise biomonitoring tool for determining and quantifying of heavy metals in aquatic ecosystems (Levkov and Krstic, 2002; Shah et al., 2009). Biological water remediation techniques are preferred to chemical and physical treatment technologies because of their effectiveness, low cost and reduced impact on ecosystem (Thangavel and Subbhuraam, 2004). Recently, interests have focused on the study of aquatic plants in remediation and biomonitoring of heavy metal contaminants in aquatic ecosystems (Girgin et al., 2010; Nouri et al., 2009).. In view of this, the environment is able to absorb pollutants and clean up itself through natural biological processes as bioremediation (Wuana et al., 2010). The uses of submerged aquatic plants in water quality assessment have been recognized and are reported to bio-concentrate and scavenge heavy metals in wastewater (Scott, 1992; Goyal et al., 2008). Plants have the ability to bioconcentrate metals at levels 100-fold greater than those typically measured in non-accumulator plants and can be categorised as Cd > 100 mg/kg, Pb and Cu > 1000 mg/kg and Zn and Mn >10000 mg/kg (Baker and Brooks, 1989). The extreme level of metal tolerance in vascular plants is called hyper-accumulation (Baker and Brooks, 1989). BCF values ≥ 1000 (Zayed et al., 1998) can be used together with the concentration thresholds in each element as mentioned by Baker and Brooks (1989) to characterise a plant as a good accumulator (hyperaccumulator). Bioconcentration Factor (BCF) is regarded as a better indicator to classify a particular plant as a hyperaccumulator because BCF takes into account the trace element concentrations in the solution (Zayed et al., 1998). BCF standard is applied as a threshold, above which a substance is considered bio-accumulative and therefore able to cause long term environmental impact. The objectives of this study were: 1) to determine the concentrations of Pb, Cd, Cu, Zn, Mn and Fe in algal biomass in urban stream water .2) to assess the feasibility of using algae in bio-monitoring of environmental quality. 3) establish the possibility of using algae for phytoextraction in urban stream water and wastewater. This study was conducted between August, 2008 and November 2009, along the Nakivubo Channelized stream of Kampala in Uganda. MATERIALSAND METHODS Study area and sites The sampling area [0015’N and 32030’E] is shown in Fig. 1. Algal materials were sampled from different localities along the Nakivubo Channelized stream (Table 1). The stream drains through Kampala city center, the most industrialised areas and Nakivubo wetland before discharging into Lake Victoria. The channel is the major recipient of runoff, organic and inorganic industrial and domestic waste effluents. Nakivubo Channel was constructed basically to carry storm water from Kampala city into Lake Victoria to minimise flooding and ponding effects. Sampling and laboratory analytical procedures Algal samples were collected for over one year along the Nakivubo drainage system (Table 1) as described by Chmieleseská and Medved’ (2001). Samples were oven dried at 105 °C for 2 h and homogenized into a fine grainedsize. Decomposition of samples was performed using 20.0 mL fuming HNO3 in open beaker digestion, left over night using a thermalmetrically controlled hot plate. Then 5.0 mL of hydrogen peroxide was added to complete the digestion and heated again to dryness. The beaker walls were washed with 2.5 mL of deionised water and heated to boiling point. The digest liquor was transferred into 25.0 mL flask and filled with deionised water to the mark. Sampling and chemical analysis of water and sediment samples were carried out as described by Sekabira et al, (2010 a, b). Heavy metals were analysed using Perkin- Elmer model 2380 Flame atomic absorption spectrophotometry. Accuracy of the analytical method was evaluated by comparing the expected metal concentrations in certified reference materials with the measured values. Simultaneous performance of analytical blanks, periodic aspiration of the standard, certified reference (JG-3) and calculation of the average recoveries of heavy metals show that the accuracy of the method was within acceptable limits (Table 2). Heavy Metal Assessment Bio-concentration Factor (BCF) or coefficients: Bioconcentration Factor can be employed to qualify the toxic element accumulation efficiency in plants by comparing the concentrations in the biota (algal biomass) and an external medium (e.g. water). BCF = Cb/Cw Where, Cb and Cw are heavy metal concentrations in the biota (mg/kg) and in water (µg/L), respectively. BCF was categorised as: < 1 excluder, metal accumulator > 1 and ≥ 1000 a good metal accumulator (Zayed et al., 1998). Analysis of variance (ANOVA): ANOVA was employed to determine whether groups of variables have the same means on data that are continuous or normally distributed and with homogeneous variance. Additionally, it was employed to assess the relationship between heavy metal concentrations and their elemental interaction at each site. Correlation analysis: Pearson’s correlation analysis was adopted to analyse and establish inter-metal relationship and physico-chemical characteristics of the stream water. RESULTS AND DISCUSSION Heavy metal concentrations in water, algal biomass and sediments Mean physico-chemical characteristics are indicated in Table 3. Water pH ranged between 6.12 and 9.36 and was within the maximum permissible limit of discharge for wastewater except along Kibira Road and Kitant tributaries. Total dissolved solid ranged between 102.0 and 478.0 mg/L, Total Suspended Solids 3.0 and 733.0 mg/ L, EC 5.3 and 961.0 µs/cm and BOD 5.6 and 952.0 mg/L. Nakivubo Stadium Bridge along Nakivubo Channelizedstream showed very high BOD and TSS in the upstream section suggesting high decomposition of organic matter and anoxic conditions. Table 5 shows metal concentrations (µg/L) in water samples that were collected from Nakivubo stream, its tributaries and Watindo stream. The total mean heavy metal concentrations in the Nakivubo Channelized stream water were in the sequence of Fe (700 µg/L) > Mn (610µ g/L) > Zn (36 µg/L) > Pb (29 µg/L) > Cu (10 µg/L) > Cd (4µ g/L). The mean trace heavy metal concentrations in the water samples from tributaries were Fe (1.125 µg/L) > Mn (755 µg/L) > Pb (77 µg/L) > Zn (67 µg/L) > Cu (12 µg/L)>Cd (6 µg/L). The mean concentrations of heavy metals in Watindo stream which is considered to be unpolluted were in the sequence of Fe (4450 µg/L) > Mn (160 µg/L)> Pb (63 µg/L) > Zn (23 µg/L) > Cu (8 µg/L) > Cd (3 µg/L l). The mean heavy metal levels in tributaries and Watindo stream showed a similar sequence. Results show that elemental concentrations in water are comparable with that reported by Muwanga and Barifaijo (2006) but lower than those reported by Nabulo et al. (2008) in industrial effluents released into the Nakivubo Channelized stream and its tributaries. However, the concentrations of Pb, Cd, Cu, Zn and Mn in sediments are higher than those reported earlier by Muwanga and Barifaijo (2006). The mean heavy metal concentrations in the algal biomass (Table 5) in the Nakivubo stream followed the trend Fe (65290.45 mg/kg) > Mn (979.275 mg/kg) > Zn (349.08 mg/ kg) > Pb (108.51 mg/kg) > Cu (97.94 mg/kg) > Cd (1.425 mg/kg) Table 3. In Nakivubo tributaries, heavy metals were observed in the sequence Fe (41885.430 mg/kg)>Mn (834.253 mg/kg) > Zn (462.528 mg/kg) > Pb (166.12 mg/kg) > Cu (50.228 mg/kg) > Cd (3.008 mg/kg). Watindo stream elemental concentrations followed the sequence Fe (47899.010 mg/kg) > Mn (1026.890 mg/kg) > Zn (119.535 mg/kg) > Pb (45.875 mg/kg) > Cu (24.575 mg/kg) > Cd (2.085 mg/kg). Heavy metal concentrations in algal biomass followed a similar sequence in Nakivubo tributaries and Watindo stream as well as Nakivubo stream water. Generally, metal ions with greater electronegativity and smaller ionic radii are preferentially sorbed by algal biomass. The concentrations of heavy metals in algal biomass were higher than those in the water and sediments in the Nakivubo Channelized stream sediments and water in the order of Algal biomass > sediments > stream water. This observation differs from the findings made by Levkov and Krstic (2002), since heavy metal concentrations were high in the sediments (sediments > algal biomass > river water) for most of the elements. Lead concentration was exceptionally high in sediments at site DT16 in this study (Muwanga and Barifaijo, 2006). Table 5 showed high mean heavy metal concentration in algal biomass at site DT16 for Pb, Cd, Zn, and Mn. These high heavy metal concentrations in algae are attributed to Uganda Batteries factory, Plastic manufacture by Uganda House of plastics and a petrol station (Pb and Cd) and manufacture of galvanised iron sheets by Uganda Baati (Zn). The phenomenon show low heavy metal levels in water with algal biomass (Levkov and Krstic, 2002). The study shows that the value of algal bio-concentration factor at most of the sites including US02, US04, MT07, DT16 and CT03 were greater than 1000. The results of heavy metal bio-concentration in algal biomass qualify it as a good heavy metal accumulator (Conti and Cecchetti, 2003). The high rates of bio-concentration in algae may be attributed to its cell wall components. However, these algal samples showed total concentration in dry biomass< 100 mg/kg Cd, < 1000 mg/kg Cu Pb and < 10000 mg/kg Zn and Mn (Table 5) and thus algae could not be classified as a hyper-accumulator (Baker and Brooks, 1989). Thetrend of heavy metal concentrations in the algal biomass correspond to the heavy metal content in water, sediments and BCF at each sampled site. Heavy metal concentrations in the Nakivubo stream sediments (Table 5) followed the trend Fe (49974.670 mg/ kg) > Mn (474.030 mg/kg) > Zn (370.370 mg/kg) > Pb (159.820 mg/kg) > Cu (53.060 mg/kg) > Cd (1.670 mg/kg). The mean heavy metal concentrations in the tributary sediments followed the order Fe (47369.330 mg/kg) > Mn (563.080 mg/kg) > Zn (251.450mg/kg) > Pb (150.660 mg/ kg) > Cu (34.450 mg/kg) > Cd (1.010 mg/kg). Watindo stream sediments heavy metal concentrations followed the order Fe (65874.670 mg/kg) > Mn (109-.530 mg/kg)> Zn (55.330 mg/kg) > Pb (37.220 mg/kg) > Cu (13.970 mg/ kg) > Cd (0.970 mg/kg). Generally, heavy metals in the Nakivubo stream, its tributaries and Watindo stream sediments follow a similar elemental concentration trend. Sediments accumulated more heavy metals than the water in this study as revealed by Eja et al. (2003), suggesting high deposition of heavy metals into stream sediments. High heavy metal concentrations in sediments are attributed to vehicular and industrial emissions and residential establishments along the Nakivubo channel and support the findings of Nyangababo et al, (2005a) and Muwanga and Barifaijo (2006). Analysis of variance (ANOVA) was employed to determine whether heavy metal variables have the same mean on data that are normally distributed (Table 4). ANOVA results were based on BCF of heavy metals in algal biomass. Sites showed no significant effect on variations between means of heavy metal bioaccumulation factor (p > 0.05) (Table 4). This suggests that green algae follow a similar pattern of heavy metal sequestration since they are not differentiated into plant parts and heavy metals are mobile in solution form. The mean BCF in all of the sites and elements in algal biomass were several orders higher (BCF > 1) (Table 6). The mean BAF values in algal biomass of the Nakivubo Channelized stream follow the trend Fe (93658.66) > Cu (10831.39) > Zn (9081.62) > Pb (6868.95) > Mn (1649.04) >Cd (383.23). The mean BAF values in tributaries can therefore be ranked in order of decreasing magnitude as Fe (63768.66) > Zn (6822.24) > Cu (4876.68) > Mn (2212.23)> Pb (1830.13) > Cd (567.77). Also Watindo stream algal biomass BCF values were ranked as Fe (10620.75) > Mn (6426.08) > Zn (5273.72) > Cu (3122.41) > Cd (852.00) > Pb (814.70). BCF values ranged from 30.84 to 482.01 for Pb, 1.08 to 4.53 for Cd, 15.29 to 126.69 for Cu, 105.7 to 1138.35 for Zn, 714.07 to 1072.25 for Mn and 27364.27 to 83075.05 for Fe. The sampled algae showed that BCF ranged between 411.20 and 12669.00 for Pb, 252.0 and 1392 for Cd, 1816.57 and 15836.25 for Cu, 4450.53 and 11422.17 for Zn, 436.15 and 6169.64 for Mn and 14865.31 and 95011 for Fe. Cluster Analysis (CA) and Factor Analysis (FA): Cluster analysis was performed on the data using average linkage and correlation coefficient distance. Results of cluster analysis are shown in Fig. 2. Two groups of elemental associations with eigenvalues > 1 were extracted in the analyses. Heavy metal elements were fused into groups or clusters because of their relative elemental concentration in algal biomass at each site and their similarity coefficients. Group I contains Pb, Cu, Cd and Zn as well as sediment pH. Group II contains Mn and Fe (Fig. 3). Biplot of sites and elemental concentrations (Fig. 2) suggest that inflows from Kibira Road and Lugogo are sources of Pb, Kitante streams are sources of Pb, Cu and Zn, whereas inflows from Kayunga stream are loaded with Fe, Mn and Cd. Bativa Hotel Bridge in flows are sources of Cd, Cu and Zn to Nakivubo Channelized stream. The first two factors account for 79.9 % of the total variance in the data set. The rotated factor matrix is explained by the two factors with high communalities of elements except Cd. The first factor accounts for 53.0 % of the total variance and contains Mn and Fe with high variable loadings on this factor and corresponds to group II of the cluster analysis. This association may be due to theircommon occurrence in the basic rock attributed to terriginous influence. The second factor accounts for 26.9 % of the variance and contains Pb, Cd, Cu and Zn as well as water pH with high variable loadings and corresponds to group I of cluster analysis. This may suggest the influence of vehicular and industrial emissions and water pH as the controlling factor, whereas the association of Cd and Zn may be due to their geochemistry. Tables 8 (a), 9a-b, 9c-d, 10 represent correlation coefficients for the data obtained for Nakivubo Channelized stream (US02 and US04), its tributaries namely Kayunga stream (MT07), Kitante stream (MT10), Lugogo stream (MT13) and Kibira Road stream (DT16), respectively, for possible paired elements. Table 8 (a) shows that elemental pairs Cd-s/ Cu-a, Cu-s/Cu-a, Mn-s/Mn-a, Fe-s/Fe-a, Cu-w/Mn-a, Mnw/ Fe-a, Fe-w/Fe-a, Mn-w/Pb-s, Fe-w/Pb-s, Cu-s/Cd-s, Zns/ Cu-s, Fe-s/Mn-s, Cu-w/Mn-s, Fe-w/Mn-w, Zn-w/pH and Zn-w/BOD are positively correlated with the same elements and each other. The rest of the elemental pairs were not significantly correlated with each other. In Table 8 (b), elemental pairs Pb-s/Pb-a, Zn-a/Cu-a, Mn-a/Zn-a, Fe-a/Cu-a, Fe-a/Zn-a, Fe-a/Mn-a, Fe-s/Zn-a, Mn-s/Mna, Fe-s/Mn-a, Fe-s/Fe-a, Zn-s/Pb-s, Fe-s/Pb-s, Pb-w/Cds, Pb-w/Cu-s, Mn-s/Zn-s, Fe-s/Zn-s, Fe-s/Mn-s Mn-w/ Zn-a, Mn-w/Mn-a, Fe-w/Cu-a, Fe-w/Zna, Fe-w/Mn-a, Few, Fe-a, Fe-a/BOD, Zn-s/BOD and Fe-w/Mn-w are positively correlated with the same elements and each other except Cu-a/Cd-a which was negatively correlated. The rest of the elemental pairs were not significantly correlated. Table 9 (a) shows that elemental pairs Cd-a/ Pb-a, Cu-a/Cd-a, Zn-a/Cd-a, Pb-w/Pb-a, Mn-a/Zn-a, Fe-a/ Zn-a, Fe-a/Mn-a, Cu-w/Cd-a, Cu-w/Zn-a, Cu-w/Fe-a, Mns/ Cd-a, Fe-s/Cd-a, Mn-s/Zna, Fe-s/Zm-a, Pb-s/Cd-w, Cus/ Cd-w, Zn-s/Cd-w, Mn-s/Pb-w, Fe-s/Pb-w, Mn-s/Cu-w, Fe-s/Cu-w, Fe-w/Mn-w, Cd-s/Pb-s, Cu-s/Pb-s, Cu-s/Cds, Fe-s/Mn-s, Zn-a/pH-w, Mn-a/pH-w, Fe-a/pH-w, Mn-a/ EC and Fe-a/pH are positively correlated with the same elements and each other, except Cu-a/EC, Zn-a/DO, Mna/ DO, Fe-a/DO, Mn-w/EC and Fe-w/EC which were negatively correlated. The rest of the elemental pairs were not significantly correlated. Elemental pairs in Table 9 (b) shows that Pb-s/Cd-a, Fe-a/Zn-a, Zn-s/Zna, Mn-s/Zn-a, Fe-s/Zn-a, Zn-s/Mn-a, Mn-s/Fe-a, Fe-s/Fe-a, Cd-w/Mna, Zn-w/Fe-a, Mn-s/Zn-s, Fe-s/Zn-s, Cd-w/Mn-a, Cd-w/ Zn-s, Fe-s/Mn-s and Mn-w/Cd-w and Fe-w/Cd-w, as well as Mn-a/pH, Zn-s/pH, Cd-a/BOD and Pb-s/BOD are positively correlated with each other except Fe-w/Zn-w and Mn-a/DO which are negatively correlated. The rest of the pairs were not significantly correlated. Table 9 (c) shows that Cu-a/Cd-a, Zn-a/Cd-a, Zn-a/Cu-a, Mn-a/Cda, Mn-a/Zn-a, Fe-a/Zn-a, Fe-a/Mn-a, Fe-a/Mb-a, Zn-w/ Mn-a, Fe-s/Fe-a, Zn-w/Fe-a, Cu-w/Pb-s, Fe-s/Zn-s, Znw/ Zn-s, /Mn-w/Zn-s, Fe-w/Zn-s, Fe-s/Mn-s, Zn-w/Mns, Zn-w/Fe-s, Mn-w/Fe-s, Fe-w/Fe-s, Cd-w/Pb-w, Fe-w/ Zn-w, Mn-w/Zn-w, Fe-w/Zn-w, Fe-w/Zn-w and, Pb-s/EC, Zn-w/EC, Cu-w/DO, Cu-s/DO, as well as Mn-w/Ec were positively correlated with each other, except Zn-s/EC, Fea/ Temp, Pb-s/pH and Zn-w/Temp which were negatively correlated. The rest of the pairs were not significantly correlated. Table 9 (d) shows that Mn-a/Zn-a, Fe-a/Zn-a, Fe-a/Mn-a, Zn-s/Cu-a, Mn-s/Cd-a, Pb-w/Pb-a, Mn-w/Zna, Mn-w/Mn-a, Mn-w/Fe-a, Fe-w/Zn-a, Fe-w/Mn-a, Few/ Fe-a, Cu-w/Fe-s, Zn-w/Fe-s, Zn-w/Cu-w, Fe-w/Mn-w and Pb-a/Temp, Cu-a/EC, Cd-a/BOD, Cu-s/EC, Mn-s/BOD except Cd-s/Cd-a, Cd-s/BOD, Cu-s/EC and Mn-s/Temp, were negatively correlated. The rest of the pairs were not significantly correlated. Elemental and physico-chemical characteristic pairs in Table 10 shows that Cu-a/Pb-a, Pbs/ Pb-a, Cu-s/Pb-a, Pb-s/Cu-a, Fe-a/Mn-a, Cu-s/Pb-s, Zn- s/Pb-s Zn-s/Cu-s, Pb-w/Cu-s, Fe-s/Mn-s, Cu-w/Fe-s, Znw/ Cd-w, Mn-w/Cd-w, Fe-w/Mn-a, Fe-w/Fe-a and Zn-a/ pH, Cd-w/pH, Mn-a/BOD, as well as Fe-a/BOD are positively correlated with the same elements and each other. The rest of the pairs were not significantly correlated. High correlation between Cd-s/Cu-a and Cu-s/Cu-a (Table 9 a) at site US02 suggests that the Car washing Bay and Kivuro slum establishment contribute to high Cd and Cu levels in stream sediments (Nyangababo and Ichikuni, 1986). Correlation coefficients between Pb-s/Pba, Fe-a/Cu-a, Zn-a/Cu-a, Fe-w/Cu-a, Mn-w/Zn-a, Fe-w/ Zn-a and Fe-a/Zn-a at site US04 indicate that vehicular emission contributes to high Pb, Cu and Zn levels in the environment. Petrol combustion products contain lead and copper, whereas zinc may be a constituent of parts of vehicle engines. The high correlation of Fe-a/Mn-a in algal biomass (Table 8 a and b, 9 a,b and d) possibly suggests their essentiality for algal growth. The negative correlation coefficients between Cu-a/Cd-a possibly suggests inhibition of uptake or adsorption of Cd by algae in preference for Cu as an essential element. The correlation of Cd-a/Pb-a, Cu-a/Cd-a, Zn-a/Cd-a, Pbw/Pba, Cu-w/Cd-a, Mn-a/Zn-a, Fe-a/Zn-a, Fe-a/Mn-a, Cu-w/ Zn-a and Cu-w/Fe-a along the Kayunga tributary may signify that each paired elements originate from identical source (Table 9 a). However, high correlation between these metal pairs possibly suggest that solid waste dumping along the sides of the tributary and vehicle traffic contribute to addition of Cu, Cd, Pb and Zn in the environment (stream water, sediments and algal biota). Elemental pairs along Kitante tributary (Table 9 b) indicate high correlation of Pb-s/Cd-a, Fe-a/Zn-a, Zn-s/Zn-a, Mns/ Zn-a and Fe-s/Zn-a in sediments. This suggests that hotels, residential establishment and vehicle traffic high correlation of elemental pairs along the Lugogo tributary of Cu-a/Cd-a, Zn-s/Cd-a, Zn-a/Cu-a, Mn-a/Cda, Mn-a/Zn-a, Fe-a/Zn-a, Fe-a/Mn-a, Fe-s/Mn-a, Zn-w/ Fe-a, and Zn-w/Mn-a indicates that petro stations, washing bays and vehicle traffic introduce high amounts of Cu, Cd and Zn to the environment. Referring to Table 9 (c), high correlations of Cd-s/Cd-a, Mn-s/Cd-a, Pb-w/ Pba, Zn-s/Cu-a, Mn-a/Zn-a, Fe-a/Zn-a, Fe-a/Mn-a, Mnw/ Zn-a, Fe-w/Zn-a, Mn-w/Mn-a, Fe-w/Fe-a and Mn-w/ Fe-a along the Kibira Road tributary were noted. This may indicate that industries contribute high levels of Cd, Zn, Cu and Pb, since wastewater effluents from batteries (Uganda Batteries LTD), plastic (Uganda House of Plastics LTD) and Iron sheet (galvanised) (Uganda Baati LTD) factories contain these elements. Very high elemental pairs of Cu-a/Pb-a, Pb-s/Pb-a, Cu-s/Pb-a, Pbs/ Cu-a and Fe-a/Mn-a (Table 9 d) may be explained by the contribution from atmospheric deposition and/or geochemistry of the sediments (Chakravarty and Patgiri, 2009; Sekabira et al., 2010). Water pH was negatively correlated with heavy metal concentration in algal biomass, whereas it was positively correlated in Watindo stream, suggesting its influence on the adsorption and uptake of heavy metals. CONCLUSION This study indicates that the Nakivubo ecosystem is actively accumulating heavy metals in the environment and that algae have the potential to accumulate Pb, Cd, Cu, and Zn. Algae can thus be used in bio-monitoring of heavy metal pollution in urban stream water since it can be used in quantification of pollutants. Concentrations of heavy metals in algal biomass reflect metal load in the stream water. Algae can therefore be used in the phytoextraction process of heavy metals in aquatic urban stream water and wastewater effluents. Significant correlations of heavy metal concentrations in algal biomass with stream water and sediments and the ability to accumulate these heavy metals also strengthen algae as good bio-monitor of Pb, Cd, Cu and Zn. Bio-concentration factor (BCF) of heavy metals in algal biota was found in decreasing order of Fe >Cu > Zn > Pb> Mn > Cd in the Nakivubo Channelized stream. ACKNOWLEDGMENTS The authors are thankful to Kampala International University for the financial support in form of PhD research project and Department of Geology, Faculty of Science,Makerere University, for geochemical analyses. REFERENCES
© IRSEN, CEERS, IAU The following images related to this document are available:Photo images[st11011t10.jpg] [st11011t1.jpg] [st11011f1.jpg] [st11011t8.jpg] [st11011t9a-b.jpg] [st11011t2.jpg] [st11011t5.jpg] [st11011t6.jpg] [st11011t4.jpg] [st11011t3.jpg] [st11011t7.jpg] [st11011t9c-d.jpg] [st11011f2.jpg] [st11011f3.jpg] |
| |||||||||
