 |
| About Bioline | All Journals | Testimonials | Membership | News |
|
||||||
|
||||||
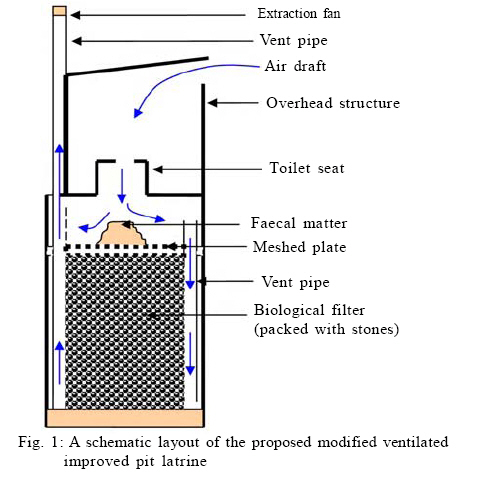
International Journal of Environment Science and Technology, Vol. 8, No. 2, 2011, pp. 363-372 Iron and chromium doped titanium dioxide nanotubes for the degradation of environmental and industrial pollutants *S. T. Hussain; A. Siddiqa Nano Science and Catalysis Division, National Center for Physics, Quaid-i-Azam University Complex, Islamabad, Pakistan *Corresponding Author Email: coetzeemaa@tut.ac.za Tel.: +12-382 6234; Fax: +12-382 6354 Received 13 January 2010; revised 16 October 2010; accepted 1 February 2011 Code Number: st11033 ABSTRACT: Pit latrines are the most frequently used sanitation systems in developing countries because of weak infrastructure and poor economic wealth. A modified ventilated improved pit latrine, with a biological filter beneath is proposed to stabilize and to remove the bulk of the nitrogen from the liquid phase. Although the hydraulic loading rate in the proposed biological filter system was calculated to be ca 36 L/m2/d, significantly lower than the rates that are typical applied in standard rate biological filters (in the range of 10004000 L/m2/d) used to treat domestic wastewater; the total Kjeldahl nitrogen and chemical oxygen demand concentrations are significantly higher in faecal sludge, namely 3 - 5 g /L and 20 50 g /L, respectively compared to ca 60 mg/L and 500 mg/L in standard rate biological filters. The biological filter was operated at nitrogen loading rates of 72, 145, 290 and 435 g/m2/d, respectively, until stable state conditions were obtained. The biological filter showed effective nitrogen removal between 72 and 434 g/m2/d and the best total nitrogen removal was obtained at 145 g/m2/d, namely 92 %. These results suggest that it should be possible to remove nitrogen effectively using a biological filter beneath a modified ventilated improved pit latrine. Keywords: Ammonia volatilization; Biomass assimilation;Denitrification; Nitrification; Urea INTRODUCTION Globally, 2.6 billion people do not have access to adequate sanitation (WHO, 2009). In Africa, 234 million people have no access to any sanitation systems (WHO and UNICEF, 2008). Because of weak infrastructure and poor economic wealth, pit latrines are the most frequently used sanitation systems (Pickford, 1995). Depending on the soil type, specifically the permeability, leachate from a pit latrine could contaminate the groundwater and whereas microbial contaminants will decrease over time, chemical contaminants could persist (DWAF, 2003; Nwuche and Oguji, 2010). This is especially true for the high concentrations of nitrogen and organic matter contained in the faecal sludge (3-5 g N/L and 2050 g COD/L, respectively) (Montangero and Strauss, 2002; Lu and Huang, 2010; Cheng et al., 2011). The composition of the biodegradable nitrogen and organic compounds in the leachate will change as it moves through the soil due to natural biological processes that occur (Babel et al., 2009). Although COD is reduced, research has shown elevated concentrations of nitrogen species specifically nitrate in groundwater surrounding pit latrines (Tredoux et al., 2000; Zingoni et al., 2005; Dzwairo et al., 2006; Okafor and Opuene, 2007; Chenini and Khemiri, 2009). Nitrate poses a serious health risk to the users of the water source (Nouri et al., 2008; Suthar et al., 2009), especially young babies who are bottle fed as it causes the condition methaemoglobinaemia (Terblance, 1991; Tredoux et al., 2000). Some researches also indicate a possible link between even low nitrate concentrations and gastric cancer (WHO, 1992). The nitrogen content of faecal matter (urine and faeces) is very high. The biggest contributor to the total nitrogen excreted is the urine fraction, contributing 93 % to the total nitrogen concentration (Geigy, 1962). In this fraction 84 % consists of urea-nitrogen, which is readily converted to ammonia (Geigy, 1962). The faecal fraction contributes to undigested nitrogen fractions (in smaller amounts) (WHO, 2006). The amount of nitrogen that humans excrete daily depends on the amount of proteins consumed and it varies in different countries from as low as 2.1 kg nitrogen per year in Haiti, 3.4 kg nitrogen per year in South Africa up to 4.0 kg nitrogen per year in China (WHO, 2006) due to the differences in eating habits. The concentration of the nitrogen in the urine depends on the climatic conditions, the amount of liquid consumed and the level of personal activity. The amount of liquid excreted by humans daily varies between 0.8 1.6 L (WHO, 2006). According to WHO (2006) a good estimate of the concentration of nitrogen in the urine at excretion, will be in the range of 3 7 g N/L. Assuming a liquid excretion rate of 1.5 L per person and an average nitrogen concentration of 5 g N/L, the nitrogen loading rate on a pit latrine will be 180 g N/m2/d (assuming that 6 persons use the pit latrine daily and that the useful surface area in the pit will be 0.25 m2). Currently no treatment of pit latrine content is done on-site in rural and remote areas and when the pit is full, it is closed and a new pit is installed (Koné and Strauss, 2004). These pits, from start of use, constantly release high nitrogen leachate into the soil (depending on the soil conditions). A simple yet effective treatment process for ammonia removal is the use of standard rate biological filters, packed with rock media. However, when comparing the daily loading rates of a standard rate biological filter and a pit latrine, there are marked differences. The typical organic loading rate on a standard rate biological filter that treats domestic waste water is in the range of 0.07 to 0.22 kg BOD/m3/d and the nitrogen loading rate is in the range of 0.2 to 1.0 g N/m2/d (MetCalf and Eddy, 2003). The nitrogen loading rate on a standard rate biological filter is therefore considerably lower (between 180 to 900 times lower) than the 180 g N/m2/d loading rate experienced in a pit latrine. Similarly, organic loading rates are higher than what is required to achieve nitrification as nitrifying bacteria are autotrophic and have to compete with heterotrophic bacteria for space in the filter, so they usually only become well established when the concentration of the organic matter starts to decrease in the filter (Grady and Lim, 1980). According to MetCalf and Eddy (2003) very low organic loading rates, between 0.05 to 0.10 kg BOD5/m3/d, are required to achieve between 85-95 % nitrification, while the organic loading rate in a pit latrine will be about 0.3 kg BOD5/m3/d. However, the hydraulic loading rate, ca 36 L/m2/d, is much lower than a typical standard rate biological filter that treats domestic wastewater, receiving 1000 4000 L/m2/d (MetCalf and Eddy, 2003). These lower hydraulic loading rates lead to slower trickling through the filter and consequently longer retention times that should be favourable in the treatment process. Evidence of the application of biological filters to treat VIP effluent on-site could not be found and therefore a new modified VIP system is proposed, where the faecal sludge in the pit will be allowed to leach into a biological filter (Fig. 1). The filter will be packed with stones. The vent pipe will be fitted with an extraction fan to induce a draft through the filter. Thus, all the liquid that seeps from the top part of the pit will be treated in the biological filter. The nitrogen will be removed by a combination of nitrification and denitrification processes. The purpose of this investigation was to evaluate the effect of different nitrogen loading rates on a laboratory scale, biological filter (with dimensions proportional to that of the proposed system) loaded with nitrogen, at the same application rates as would be applied to the proposed process. The research for this project was conducted at Tshwane University of Technology during the period 2006 to 2009. MATERIALS AND METHODS Biological filter set-up The biological filter consisted of a PVC column, 150 mm in diameter and 1500 mm in length. The filter was packed with stones, 10-20 mm in diameter. The synthetic waste medium was fed intermittently to the biological filter by means of a diaphragm dosing pump (Model: Alldos M205). The pump was controlled by an electronic timer, which switched the pump on for 30 seconds, every hour. The medium was distributed through micro sprayers over the stones onto the biological filter (Fig. 2). Air was supplied by means of a compressor (Model: Fini, 100) through a network of perforated perspex pipes at a rate of 1Nm3/h. The composition of the synthetic waste medium Fresh medium was prepared daily. The synthetic waste medium contained 16 g/L glucose equal to a COD concentration of 17 100 mg COD/L. The pH was buffered to pH 7 with 1.8 g/L potassium dihydrogen phosphate, and 2.8 g/L disodium hydrogen phosphate. The phosphate salts were also used to ensure sufficient phosphorous to sustain unrestricted microbial growth in the biological filter. Nitrogen was added in the form of urea. The urea concentration added during the different trials was 4.3 g/L, 8.6 g/L, 17.2 g/L and 25.8 g/L, this was equal to 2 g N/L, 4 g N/L, 8 g N/L and 12 g N/L, respectively. Operational conditions in the biological filter The biological filter was operated at a dosing rate of 650 mL/d. That is equal to a hydraulic loading rate of 35.7 L/m2/d. The biological filter was operated at the following nitrogen concentrations: 2 g N/L, 4 g N/L, 8 g N/L and 12 g N/L (nitrogen loading rates of 72, 145, 290 and 435 g/m2/d, respectively). When the nitrogen concentration was changed the reactor was operated until stable state conditions were obtained. Stable state conditions were based on stable performance of the biological filter with regards to ammonia, nitrite and nitrate concentrations (three to four weeks of comparable results) in the effluent. Monitoring of the effluent composition The pH (Orion Model 410A) and conductivity (Hach Model Sension 6) of the effluent from the biological filter, as well as the volume throughput were determined daily in all the trials. The effluent from the different trials were also analysed at least once a week for COD, TKN, nitrate, nitrite and ammonia according to Standard Methods (APHA et al., 2005). High concentrations of nitrate and nitrite Higher concentrations of nitrate and nitrite were determined with an ion chromatograph (76I Compact IC from Metrohm). A Metrosep A Supp 3 column (6.1005.320) was used. The sample loop was 20 ìL and the flow rate through the column was 1.0 mL/min with a mixture of 1.7 mM NaHCO3 and 1.8 mM Na2CO3 as eluents (APHA et al., 2005). Low concentrations of nitrate and nitrite Lower concentrations of nitrate and nitrite were determined with colorimetric methods. The salycilate method was used for nitrate analyses (Miller and Wideman, 1956). An aliquot of the sample, treated with sodium salicylate was evaporated on top of a water bath. The dried sample was resuspended with concentrated sulphuric acid and diluted with distilled water before a 50 % sodium hydroxide solution was added for colour development. Thereafter the sample was transferred, quantitatively, to a volumetric flash and the absorbance was read at a wavelength of 410 nm on a spectrophotometer (Hach model: DR2000). The concentration was determined with the aid of a calibration curve. The nitrite concentration was determined colorimetrically by addition of the colour developing agent which consisted of a mixture of 2.5 g/L sulfanilamide, 25 mL/L of a 85 % phosphoric acid solution and 0.25 g/L N-(-1-naphthyl)-etylene diamine dihydrochloride to an aliquot of the sample. The absorbance was read at a wavelenght 543 nm. The concentration was determined with the aid of a calibration curve. A DR2000 spectrophotometer (Hach Co. Loveland CO) was used. The ammonia concentration The ammonia concentration was determined using the distillation method (APHA et al., 2005). An aliquot of the sample was buffered with 25 mL of a solution that contained 9.5 g/L sodium tetra borate and 88 mL 0.1 N NaOH, treated with 30 % sodium hydroxide to increase the pH value above pH 9. The sample was then distilled on a Kjeltec system 1002 distillation unit. The distillate was collected in 2 % boric acid solution and titrated to end point with 0.02 N sulphuric acid. TKN For the TKN analysis, an aliquot of the sample was first digested (Buchi) with 10 mL concentrated sulphuric acid and a TKN tablet (Merck) (potassium sulphate and cupric sulphate) at 360 ºC. The resultant ammonia was determined as mentioned before (APHA et al., 2005). COD The COD concentration was determined according to the closed reflux, colorimetric method. An aliquot of the sample was treated with 1.5 mL digestion solution (which was a mixture of 10.216 g/L potassium dichloromate, 167 mL concentrated sulphuric acid and 33.3 g/L mercuric sulphate) and 3.5 mL concentrated sulphuric acid, and digested at 150 °C for two hours. After cooling, the absorbance of the samples was read at 600 nm using a spectrophotometer (Hach model: DR2000). The concentration was determined with the aid of a calibration curve (APHA et al., 2005). All chemicals used were of analytical grade and obtained from major retailers. Data analysis The estimated interval of the mean (t-estimate)
was calculated at 95 % confidence level for the
different parameters in the effluent from the different trials,
at stable state conditions. Data Analysis
PlusTM 2.12 an add-in for Microsoft Excel was used to perform
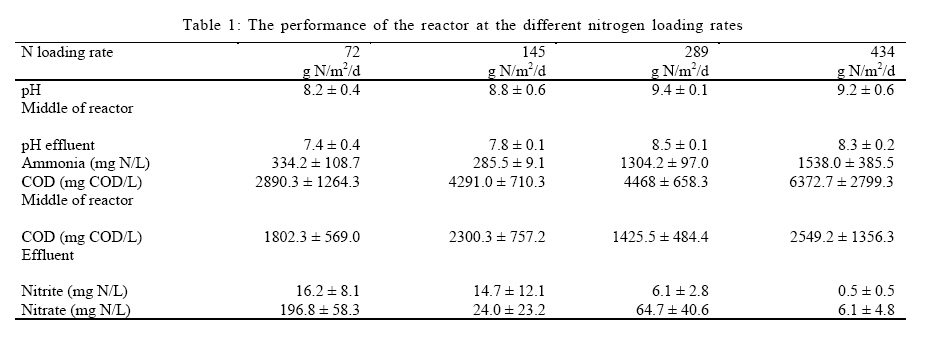
the data analysis. The results are reported as RESULTS AND DISCUSSION The synthetic medium applied to the filter contained urea as the nitrogen source at different concentrations. It is known that urea will be hydrolysed rapidly by the enzyme urease to form ammonium ions according to the following reaction equation (Orhon and Artan, 1994): (NH2 )2 CO + 2H2 O ⇔ 2NH4+ + CO32- (1) The production of carbonate ions will increase the alkalinity of the liquid and thereby cause an increase in the pH. The synthetic medium was buffered to a pH value of 7 with dihydrogen phosphate and hydrogen phosphate salts. The concentration of the phosphate in the synthetic medium was 1.0 g P/L. The buffering capacity in urine is also because of the phosphate concentration which depends on a person's diet as the excess phosphate ingested is excreted in the urine (Sherwood, 2008). Wilsenach (2006) reported that urine contains ca 1.0 g P/p.d and the volume of urine excreted daily varies between 0.8 1.6 L (WHO, 2006), thus the phosphate concentration will vary between 0.62 1.25 g P/L which is thus comparable to the buffer capacity of the synthetic medium.The equilibrium between the HPO42- and H2PO4- ions will buffer changes in pH until saturated (Sherwood, 2008). The effect of this phenomenon was observed when the initial pH values in the middle of the reactor (0.75 m from the top) were compared during the different trails. The pH values steadily increased from 7.0 to 8.2 ± 0.4, 8.8 ± 0.6, 9.4 ± 0.1 and 9.2 ± 0.6 at 72, 145, 289 and 434 g N/m2/d, respectively (Table 1). The ammonium ions (NH4+) produced during the hydrolysis of urea, will also be in equilibrium with ammonia (NH3) according to the following reaction equation (Benefield et al., 1982): NH3 + H2 O ⇔ NH4+ + OH− (2) When the pH increases, the equilibrium of the reaction will shift to the left and ammonium ions will form ammonia gas. Ammonia gas is very insoluble in water and will escape to the atmosphere. The percentage ammonia that will volatilize is a function of pH and temperature and can be calculated from the following equation (MetCalf and Eddy, 2003):
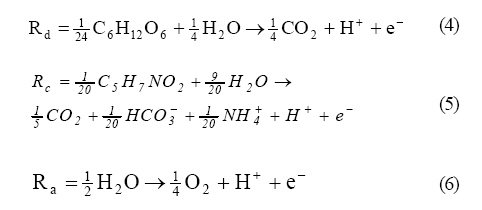
Ka= ionization constant for ammonia, which is dependent on the temperature. The concentration of the ammonia that could theoretically have volatilized during the trails was calculated based on the initial pH values observed in the middle of the reactor during the different trials. These values were used for the calculation and not those of the effluent, as these would differ significantly due to the hydrolysis of urea in the top part of the reactor, increasing the pH and nitrification in the lower part of the reactor, decreasing the pH (Table 1). The volatilization at 2000 mg N/L was 5 % (at a pH value of 8.2 and 20 °C) compared to 19.8 % at 4000 mg N/L (at a pH value of 8.8) and 44 % for both 8 000 and 12 000 mg N/L having similar pH values of 9.4 and 9.2, respectively (Table 2). The success of the removal of ammonia by the air stripping process (volatilization) depends largely on the air: liquid ratio applied in the process. An air: liquid ratio of 1:1660 is required to remove ammonia by the stripping process (WPCF, 1983). As the air was supplied at a rate of 1.0 Nm3/h and the average dosing rate was ca 630 mL/d, the air: liquid ratio was 1:2.6 x 10⁻⁵, thus the air supplied was significantly higher than the requirements. In addition to ammonia being removed by volatilization, some of the ammonium ions will be assimilated by the bacteria to form new cell material. Microorganisms require nitrogen for growth. Heterotrophic organisms which grow on domestic waste water require carbon, nitrogen and phosphorous (expressed as BOD5:N:P) in a ratio of 100:5:1 (Orhon and Artan, 1994). However, the biomass yield for aerobic heterotrophic growth on pure glucose (carbon source used in this study) is higher than growth on domestic waste water. The YH (e-. e biomass/ e-. e substrate) for domestic waste water is 0.66 e-. e biomass/ e-. e substrate compared to the 0.79 e-. e biomass/ e-. e substrate for glucose (Orhon and Artan, 1994). The nitrogen requirements can be calculated from stoichiometric reaction equations developed by using the concept of half-reactions (Grady and Lim, 1980; Orhon and Artan, 1994). For heterotrophic, aerobic growth with glucose as carbon source and electron donor, the three half reactions will be:
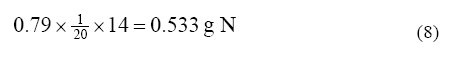
Thus for glucose, where YNH = 0.79 e-. e biomass/ e-. e substrate, the overall stoichiometric reaction equation for bacterial growth is: R0 = Rd − 0.79Rc − 0.21Ra (7) R0 = the overall stoichiometric reaction Rd = Reaction for electron donor Rc = Reaction for bacterial cell synthesis Ra = Reaction for electron acceptor By applying equation (7) the amount of ammonia required per e-. e substrate (expressed as N) can be calculated as follows:
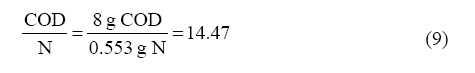
As 1 e-. e substrate is equivalent to 8 g COD (Orhon and Artan, 1994) the COD: N ratio can be calculated as follows:
Since 16 g/L glucose (concentration of the glucose used in the synthetic medium) has a theoretical COD value of 17.1 g/L, the amount of N required for growth will be 1.182 g/L (Table 2). The amount of nitrogen required for synthesis of new biomass could therefore account for 59.1 %, 29.6 %, 14.8 % and 9.9 % of the initial nitrogen loss in the system during the trails at nitrogen loading rates of 72, 145, and 289 and 434 g N/m2/d, respectively. The nitrification capacity (the residual concentration of ammonium after volatilization and biomass production) i.e. the ammonium, available to be nitrified, was calculated, at the different nitrogen loading rates according to the following formula and the results given in Table 2: Nc = Nt − Ns − Nv (10) NC = nitrification capacity, mg N/L Nt = TKN concentration in the feed, mg N/L Ns = concentration of the nitrogen that is assimilated to form new biomass in mg N/L Nv = concentration of the nitrogen that was volatilized in mg N/L. The nitrification capacity increased as the nitrogen load increased. The theoretical nitrogen removal for biomass production was constant and the major factor influencing the increase in nitrification capacity was volatilization driven by the pH. The volatilization at 2 000 mg N/L was 117 mg N/L (at a pH value of 8.2) compared to 792 mg N/L at 4 000 mg N/L (at a pH value of 8.8), 3508 mg N/L at 8 000 and 5262 mg N/L at 12 000 mg N/L. Due toncreased volatilization at the higher nitrogen loading rates the nitrification capacity did not increase proportionally to the increase in nitrogen loading (Table 2). The following chemical reaction occurs during nitrification (MetCalf and Eddy, 2003):
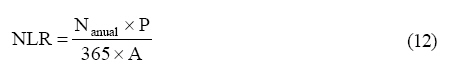
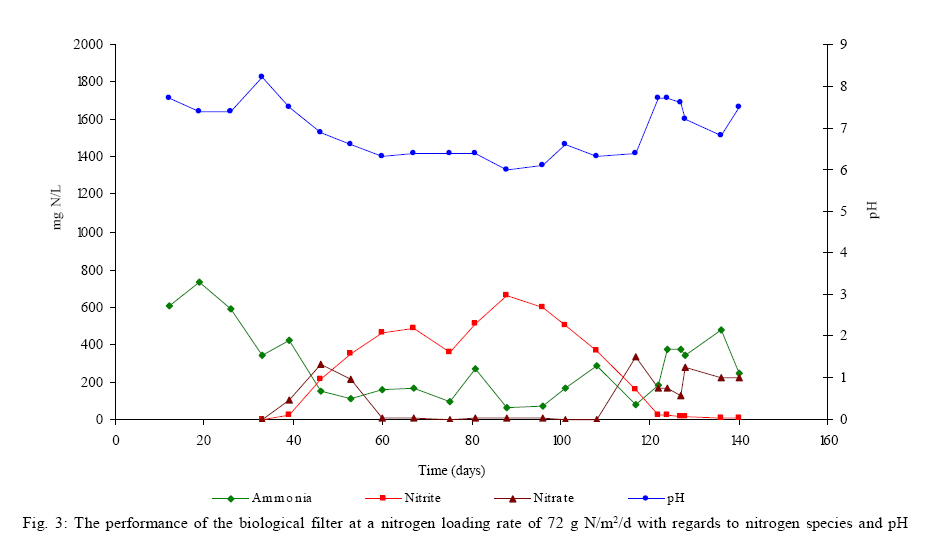
NH4+ + 2O2 ⇔ NO3- + 2H+ + H2O (11) Because of the production of hydrogen ions, alkalinity decreases and the pH of the liquid declines (WRC, 1984). The pH decreased in the lower part of the reactor during all the trails, as the pH values at all the nitrogen loading rates were lower than that observed from the middle of the reactor (Table 1). This decrease in pH together with the appearance of nitrate and nitrite ions in the effluent supply evidence that nitrification had occurred. The actual ammonium concentration was determined in the effluent and the concentration nitrified calculated by using the difference between the nitrification capacity (the theoretical maximum that can be nitrified Nc) and the ammonium concentration in the effluent at all the nitrogen loading rates (Table 2). As the nitrogen loading rate increased, the concentration of the ammonia that was nitrified increased progressively from 366.8 mg N/L, 1740.5 mg N/L, 2005.8 mg N/L and 4018 mg N/L at 72, 145, 289 and 434 g N/m2/d, respectively. However the highest percentage ammonia was nitrified at a nitrogen loading rate of 145 g N/m2/d, namely 85 %, while the lowest percentage was observed at 72 g N/m2/d, namely 57 %. The weak performance of the reactor at 72 g N/m2/d could be explained from the observed results of ammonia, pH, nitrate and nitrite concentrations during that trail (Fig. 3). Between approximately 50 days and 118 days of operation, the ammonia concentration decreased to 63 mg N/L while the pH decreased to pH 6. The nitrite concentration increased to a high of ca 600 mg N/L and very little nitrate was formed. After approximately 118 days, the pH and ammonia concentration increased again and stabilized at pH 7.4 ± 0.4, an ammonium concentration of 334.2 ± 108.7 mg N/L and the nitrate concentration at 196.8 ± 58.3 mg N/L. A possible explanation for the near absence of nitrates could be attributed to the fact that the bacteria involved in the second step of nitrification, the Nitrobacter species, are inhibited when the pH decrease below 7 (Anthonison et al., 1976). It would have been a definite advantage to have extended the running time of this reactor to ascertain stable state conditions. In contrast to the above, the first step of nitrification, the oxidation of ammonia, is inhibited if the pH is higher than 9 (Anthonison et al., 1976). This can probably explain the weaker nitrification rate at the higher nitrogen loading rates where the pH increased to above 9, as the percentage ammonia that was nitrified, was 61 % at 289 g N/m2/d and 72 % at 434 g N/m2/d compared to 85 % obtained at a nitrogen loading rate of 145 g N/m2/d (Tables 2 and 3). Near complete denitrification was observed at all nitrogen loading rates, except at the lowest nitrogen loading rate of 72 g N/m2/d. There, only 36 % of the ammonia concentration that was nitrified, was denitrified and the concentration of the nitrates were 196.8 ± 58.3 mg N/L and that of the nitrites were 16.2 ± 8.1 mg N/L (Table 1). At the higher nitrogen loading rates the affectivity increased and the denitrification rate was greater than 96 %. Two factors which have an influence on the rate of denitrification are the presence of dissolved oxygen, which will inhibit denitrification and the availability of a carbon source (WRC, 1984). Although air was supplied to the reactor, denitrification occurred as the biofilm was probably thick enough to maintain anaerobic conditions within, as also reported in literature (Iwai and Kitoa, 1994, Biesterfeld et al., 2003). The other factor which has a major influence on the denitrification rate is the availability of carbon. The C:N ratios in this study decreased as the nitrogen loading rate increased. Based on the initial loading rates, the C:N ratios were 8.6:1, 4.3:1, 2.1:1 and 1.4:1 at 72, 145, 289 and 434 g N/m2/d, respectively. However, most of the nitrification occurred in the lower part of the reactor so the ammonium concentration nitrified and the COD concentration in the middle of the reactor was used to determine the COD: NO3-N ratios during the trials at different nitrogen loading rates. The ratios were 7.5:1; 2.6:1, 2.2:1 and 1.5:1 at 72, 145, 289 and 434 g N/m2/d, respectively. The C:N ratios at the higher nitrogen loading rates decreased below the C:N ratios reported in literature to yield successful denitrification. The type of carbon source used will have an influence of the C:N ratio required to achieve denitrification. Chiu and Chung (2003) reported optimal C:N ratios between 2.6 and 5.5 for different carbon sources. There is two possible explanations for the good denitrification rates at the low C:N ratios at the nitrogen loading rates of 289 and 434 g N/m2/d. Firstly, Chiu and Chung (2003) reported that denitrifiying bacteria become dominant at higher nitrate concentrations and that the carbon requirements to satisfy denitrification will decrease as the nitrate concentration increase. Secondly bacteria may oxidize nitrite, which is formed as intermediate compounds during both nitrification and denitrification and as these processes occurred simultaneously in the bottom part of the reactor. According to Chung et al. (2007), by using nitrite during denitrification, 40 % less carbon is required to achieve denitrification. Nitrogen was removed at all the nitrogen loading rates. The best total nitrogen removal was obtained at 145 g N/m2/d, with 92 % of which 29.6 % was incorporated into biomass, 19.8 % volatilized and 42.6 % denitrified. At a nitrogen loading rate of 289 g N/m2/d the total nitrogen removal was 82.7 % (14.8 % incorporated into biomass, 43.8 % volatilized and 24.2 % denitrified) and at a nitrogen loading rate of 434 g N/m2/d, 87.2 % total nitrogen was removed (9.9 % incorporated into biomass, 43.8 % volatilized and 33.4 % denitrified). The weakest performance was obtained at a nitrogen loading rate of 72 g N/m2/d where the total nitrogen removal was only 72.7 % (59.1 % incorporated into biomass, 5.9 % volatilized and 7.7 % denitrified). Should the biological filter be installed beneath a ventilated improved pit latrine, the nitrogen loading rate on the biological filter can be calculated as follows:
NLR = nitrogen loading rate on the proposed system, g N/m2/d. Nanual = annual nitrogen loading rate excreted per person, g N. P = number of people that use the pit latrine A = the surface area of the proposed biological filter = 0.25 m2 By using equation 12 and taking into account the variations, given in literature, for nitrogen excreted daily (depending on diet) namely between 2.1 kg N/p/y and 4.0 kg N/p/y (WHO, 2006), the nitrogen loading rate on the pit latrine could vary between 138 and 263 g N/m2/d. The results obtained in this study, examining the nitrogen removal efficiency of a laboratory scale biological filter (with dimensions proportional to that of the proposed system) charged with between 72 and 434 g N/m2/d, showed high nitrogen removal and should therefore be able to remove nitrogen in the range of 138 and 263 g N/m2/d effectively. CONCLUSION Nitrogen removal in the form of urea was obtained in a biological filter at nitrogen loading rates of 72, 145, 289 and 434 g N/m2/d, applied at a very low hydraulic loading rate (35.7 L/m2/d) and a relative high organic loading rate (0.3 kg BOD5/m3/d). The nitrogen was removed by a combination of assimilation, volatilization, nitrification and denitrification processes. The biological filter showed effective nitrogen removal between 72 and 434 g N/m2/d and the best total nitrogen removal was obtained at 145 g N/m2/d, namely 92 %. These results suggest that it should be possible to remove nitrogen effectively using a biological filter beneath a modified ventilated improved pit latrine. ACKNOWLEDGEMENTS The authors gratefully acknowledge the financial assistance from Tshwane University of Technology towards the completion of this project. REFERENCES
© IRSEN, CEERS, IAU The following images related to this document are available:Photo images[st11033t2.jpg] [st11033f3.jpg] [st11033f1.jpg] [st11033t3.jpg] [st11033f2.jpg] [st11033t1.jpg] |
| |||||||||

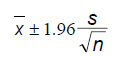 (where is the estimated mean, ó is the
standard deviation and n the number of samples (Keller and Warrack, 2000).
(where is the estimated mean, ó is the
standard deviation and n the number of samples (Keller and Warrack, 2000). 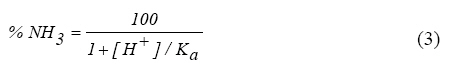